Apply Automotive Tag

In the world of marketing, this can happen to all of us. We think we know how much ad spend we should put towards a PPC campaign or what time a TV ad should air. In this digital realm, dealers are given a lot of data when a campaign finishes. Technology has pushed our boundaries so now, someone looking at a video of a specific automobile on a social media platform like YouTube can be targeted to receive video advertisements for your dealership. With that said, how do you know if you are targeting the right people? When it comes to your campaigns, you want to know your money is going towards the right forms of advertisements as well as the right demographics. If a campaign is doing well, extending out that campaign can be a better decision compared to letting it end. On the other side, if a campaign is doing poorly, pausing or evening stopping the campaign can be more beneficial in the future. The big questions you must ask yourself are: Am I targeting the wrong people? There can be a few reasons why you may be targeting the wrong people. First, the type of campaign can be incorrect. Social media is the newest and hottest form of marketing, but that may not work with your audience. Second, your demographics may be off. Without knowing the key demographics that you are targeting, you could be blindly targeting customers not interested in your vehicles or not in the market. The opposite could be said for that as well. You may be leaving out potential customers in key geological areas around your dealership. Because of this, you could be losing sales. Targeting doesn’t just stop with humans. You must think about your location and what you have in your inventory. If you are in a state like Colorado, you will want to allocate more SUVs and vehicles that have all-wheel-drive. By advertising rear-wheel-drive or sports cars to individuals that exclusively drive SUVs or only research SUVs, that can be a loss of advertising dollars. What can I do about it? A revamped marketing campaign is a good start for a strategy, but it may not be enough. Targeting can be a difficult endeavor, but thankfully there are programs and companies that can help. Experian Automotive’s Dealer Positioning System® can target key ZIP Code™ and display which campaigns are working - as well as which should be cut. Thanks to this type of data-driven targeting, market share and sales can increase even while advertising spend decreases. Another great aspect of using a system like Experian DPS is the ability to create campaigns to target vehicles your customers want. Like the example above of what not to do, you can formulate a plan of attack to focus on SUVs and light-duty trucks in a mountainous area. Conquesting intelligently not only means more people coming through your door but more allocations for vehicles your customers will want. Marketing is important. Whatever kind of advertising you do, remember that building your dealership is important. Having a solid game plan to conquest around you relies on smart targeting and the correct forms of advertising. Experian DPS can help boost market share and increase sales core models which is very helpful. To learn more about how Experian Automotive can assist with your targeting, click here.

At their heart, car dealers have always been marketers. It's part of learning the trade and understanding the business to gain natural insight into modern marketing and advertising practices. One could even argue that the experience gained through knowledge passed down, trial and error, and exposure to the automotive game itself can yield better strategies than a marketing degree. With all that said, it's still important to have the right data to guide the decisions as well as the tools necessary to decipher the data. Although we have a vast amount of information at our fingertips, it's very possible to truly build on "actionable data" and allow it to define the parameters for a dealership's marketing strategy. One of the most important things to consider when you're building and enhancing your strategies is that the data allows for decision making on the macro and micro levels. We see trend reports, analytics, and test cases that can influence decisions on both sides of the spectrum. Making decisions on the macro level means wholesale changes or additions. For example, the overall effectiveness of a particular classified advertising website can be broken down to determine whether or not it's making the right type of impact. Dealers have so many options today to advertise both online and offline, so making sure that any particular venue is effective is key to success. On the micro level, decisions can be made about how to position the dealership within the individual venues. You may be a big believer in search pay-per-click advertising, for example, and data can help to guide you or your vendor partners to position the dealership properly on search. Knowing which messages about individual cars are effective can be a guide. Then, understanding what zip codes have the highest opportunity level for the individual model can mold your PPC spend, while demographic data can drive effective messaging and help you optimize campaign creative and landing pages. Having access to the data is only the first step. Looking at the data appropriately is an important second step that many dealers are missing. Putting it all together into a decision-driving model is the step that almost every dealer should embrace to allow them to make the best decisions, macro or micro.

The number of vehicles in operation (VIO) has jumped 5.7 million, going from 265.3 million in Q3 2016 to 271 million in Q3 2017.
Below is our 5 Results for Dealers and Agencies Using DPS infographic.

The auto industry has been riding a wave of prosperity for the past seven years, bouncing back nicely from the 2008 market collapse. But, it looks like rising sales of the past 10 years, are, well...a thing of the past. According to Alix Partners, 2016 sales of 17.5 million units might be the high-water sales mark, at least through 2022. Alix Partners says the next five years sales will range between 15.6 million to 16.8 million annually. Suddenly, it will be challenging for dealers to stay in strong growth mode. How can dealers best react to the tightening market? The Experian white paper “Data Tools Evolve to Give Dealers an Edge in a Tight Sales Market” takes a look at how new and improved data and analytic tools can provide deeper insights to help automotive retailers unlock sales. The paper reviews current market sales statistics, historical sales trends and how dealers reacted during similar market conditions in the past. In addition, the paper provides a look at the challenges faced by automotive retailers, in terms of shrinking gross profit, higher advertising expenses and increased competition. Automotive retailers also will find information on the importance of customer conquesting and a look at technology tools to help provide a deeper understanding and actionable intelligence about local markets. Data and analytics are no longer the private purview of large mega-dealers. The Experian white paper outlines today’s data tools that can be implemented quickly and cost effectively by dealers of any size. To learn more about these trends, download the paper here: https://www.experian.com/automotive/dealerwhitepaper.html

Experian’s latest State of Automotive Finance Market report reveals the average credit score for purchasing a vehicle has increased four points across the board.

What bubble? Subprime vehicle loans hit Q1 10-year low; 30-day delinquencies drop
Apply Automotive TagAccording to State of the Automotive Finance Market report, 30-day delinquencies dropped and subprime auto lending reached a 10-year record low for Q1.
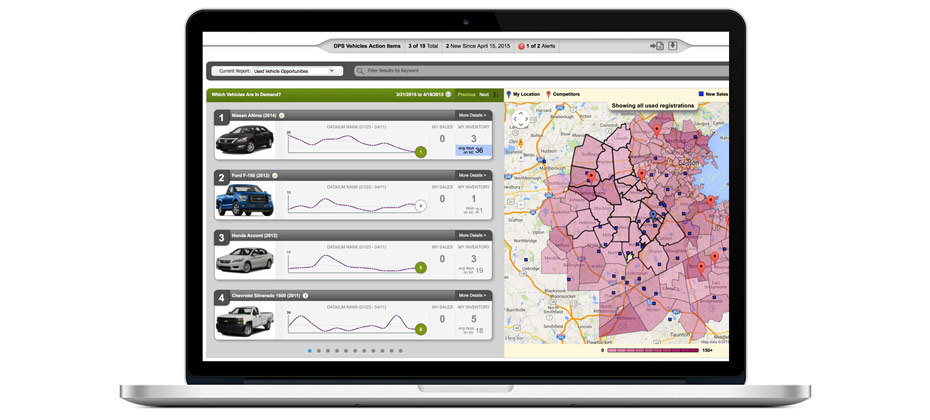
Experian helps automotive dealers make smarter advertising decisions by transforming market intelligence into targeted actions
Apply Automotive TagExperian helps automotive dealers make smarter advertising decisions by transforming market intelligence into targeted actions

For an industry that has grown accustomed to sustained year-over-year growth, recent trends are concerning. The automotive industry continued to make progress in the fourth quarter of 2016 as total automotive loan balances grew 8.6% over the previous year and exceeded $1 trillion. However, the positive trend is slowing and 2017 may be the first year since 2009 to see a market contraction. With interest rates on the rise and demand peaking, automotive lending will continue to become more competitive. Lenders can be successful in this environment, but must implement data-driven targeting strategies. Credit Unions Triumph Credit unions experienced the largest year-over-year growth in the fourth quarter of 2016, increasing 15% over the previous period. As lending faces increasing headwinds amid rising rates, credit unions can continue to play a greater role by offering members more competitive rates. For many consumers, a casual weekend trip to the auto mall turns into a big new purchase. Unfortunately, many get caught up in researching the vehicle and don’t think to shop for financing options until they’re in the F&I office. With approximately 25% share of total auto loan balances, credit unions have significant potential to recapture loans of existing members. Successful targeting starts with a review of your portfolio for opportunities with current members who have off-book loans that could be refinanced at a lower rate. After developing a strategy, many credit unions find success targeting these members with refinance offers. Helping members reduce monthly payments and interest expense provides an unexpected service that can deepen loyalty and engagement. But what criteria should you use to identify prospects? Target Receptive Consumers As originations continue to slow, marketing response rates will as well, leading to reduced marketing ROI. Maintaining performance is possible, but requires a proactive approach. Propensity models can help identify consumers who are more likely to respond, while estimated interest rates can provide insight on who is likely to benefit from refinance offers. Propensity models identify who is most likely to open a new trade. By focusing on these populations, you can cut a mail list in half or more while still focusing on the most viable prospects. It may be okay in a booming economy to send as many offers as possible, but as things slow down, getting more targeted can maintain campaign performance while saving resources for other projects. When it comes to recapture, consumers refinance to reduce their payment, interest rate, or both. Payments can often be reduced simply by ‘resetting’ the clock on a loan, or taking the remaining balance and resetting the term. Many consumers, however, will be aware of their current interest rate and only consider offers that reduce the rate as well. Estimated interest rates can provide valuable insight into a consumer’s current terms. By targeting those with high rates, you are more likely to make an offer that will be accepted. Successful targeting means getting the right message to the right consumers. Propensity models help identify “who” to target while estimated interest rates determine “what” to offer. Combining these two strategies will maximize results in even the most challenging markets. Lend Deeper with Trended Data Much of the growth in the auto market has been driven by relatively low-risk consumers, with more than 60% of outstanding balances rated prime and above. This means hypercompetition and great rates for the best consumers, while those in lower risk tiers are underserved. Many lenders are reluctant to compete for these consumers and avoid taking on additional risk for the portfolio. But trended data holds the key to finding consumers who are currently in a lower risk tier but carry significantly less risk than their current score suggests. In fact, historical data can provide much deeper insight on a consumer’s past use of credit. As an example, consider two consumers with the same risk score at a point in time. While they may be judged as carrying similar risk, trended data shows one has taken out two new trades in the past 6 months and has increasing utilization, while the other is consolidating and paying down balances. They may have the same risk score today, but what will the impact be on your future profitability? Most risk scores take a snapshot approach to gauging risk. While effective in general, it misses out on the nuance of consumers who are trending up or down based on recent behavior. Trended data attributes tell a deeper story and allow lenders to find underserved consumers who carry less risk than their current score suggests. Making timely offers to underserved consumers is a great way to grow your portfolio while managing risk. Uncertain Future The automotive industry has been a bright spot for the US economy for several years. It’s difficult to say what will happen in 2017, but there will likely be a continued slowing in originations. When markets get more competitive, data-driven targeting becomes even more important. Propensity models, estimated interest rates, and trended data should be part of every prescreen campaign. Those that integrate them now will likely shrug off any downturn and continue growing their portfolio by providing valuable and timely offers to their members.

Loan balances reach all-time high, while vehicle prices push more people to used cars and leasing
Apply Automotive TagWith steady sales growth the past several years, the auto industry has had a great run since the trough of the Great Recession in 2009. Based on the latest data published in the State of the Automotive Finance Market report, the auto industry’s robust sales totaled more than 17 million vehicles in 2016, pushing the total open auto loan balances to a record high of $1.072 trillion, up from $987 billion in Q4 2015. Despite the current boom, new vehicle affordability is becoming more challenging. The average monthly payment for a new vehicle loan jumped from $493 in Q4 2015 to $506 in Q4 2016, while the average new vehicle loan reached an all-time high in Q4 2016, at $30,621. In addition, the chasm between new vehicle loan and used vehicle loan average amounts is wider than ever at $11,292. This trend appears to be pushing more credit-worthy customers into the used vehicle market. In Q4 2016, the percentage of used vehicle loans going to prime and super prime customers was up from 45.49 percent in Q4 2015 to 47.76 percent in Q4 2016. In addition, the average credit score for used vehicle loans is up from 649 in Q4 2015 to 654 in Q4 2016. Consumers also appear to be combating the vehicle affordability issue by shifting into leases or longer-term loans to keep their monthly payments low. Leasing was up from 28.87 percent of all new vehicle financing in Q4 2015 to 28.94 percent in Q4 2016. Loan terms of 73 to 84 months now account for 32.1 percent of all new vehicle loans, up from 29 percent in Q4 2015. Keeping payments manageable will help keep people out of delinquencies, which is good for consumers and their lenders. Data shows that 30-day delinquencies were relatively flat, moving from 2.42 percent in Q4 2015 to 2.44 percent in Q4 2016, while 60-day delinquencies are growing, moving from 0.71 percent to 0.78 percent. It seems that as long as new vehicle costs rise, it is likely that more people will move toward leasing, longer term loans and used vehicles. While none of these trends are inherently bad, they could re-shape dealer strategy moving forward. Many analysts predict flat new vehicle sales in 2017, making used vehicle, F&I and service business more important to overall dealership growth this year.
The auto industry has had an impressive recovery from the Great Recession and has enjoyed steady growth for the past seven years. After bottoming out in 2009 at 10.5 million new vehicle registrations, the industry has grown each year since, culminating in 17.3 million new vehicle registrations in 2016. However, the rate of growth has been slowing over the past several years, increasing just 1.03 percent from 2015 to 2016. While retail registrations were nearly flat, the growth came from fleet, with a 13.69 percent spike in registrations by government entities and a 5.59 percent increase in commercial/taxi registrations. When automotive sales growth begins to taper, hanging onto existing customers becomes more important than ever. Fortunately, customer loyalty in the auto industry is rising for manufacturers, dealers and lenders. The manufacturer loyalty rate through November 2016 was 62.8 percent, up from 59 percent in 2010. At the make level, the loyalty rate went from 50.6 percent in 2010 to 54.5 percent through November 2016. Loyalty to a specific dealer is significantly lower but still on the rise, moving from 19.5 percent in 2010 to 23 percent through November 2016. Interestingly, 61.3 percent of all new vehicle registrations in 2016 were to customers 45 years old and older. Manufacturers and dealers who can keep these customers in the fold in the next several years are likely to maintain and grow their overall share. Our recent analysis also looked as how age impacts vehicle purchasing loyalty. In general, older customers tend to be more loyal than younger customers. Manufacturer loyalty rates by age include: 18-24 years old – 58.3 percent 25-34 years old – 55.4 percent 35-44 years old – 59.9 percent 45-54 years old – 64.4 percent 55-64 years old – 68.2 percent 65+ years old – 70.4 percent General Motors market share still number one For manufacturer market share in 2016, General Motors led the way at 16.91 percent. However, this is a significant drop from the 24 percent share of total vehicles in operation (VIO) enjoyed by GM. Toyota was second in manufacturer market share at 15.46 percent, followed by Ford Motor Co. at 12.59 percent and FCA US at 11.77 percent. Honda rounded out the top five manufacturers at 11.19 percent. For manufacturer customer loyalty, however, Tesla came out on top at 73.6 percent, followed by Toyota at 68.7 percent and Subaru at 66.8 percent. Ford and GM round out the top five at 65.7 percent and 64.7 percent respectively. Pickup trucks claim top model share, loyalty rankings Pickup trucks again held the top two positions among the most popular vehicles, with the Ford F-150 at 3.06 percent and the Chevy Silverado at 2.61 percent. Honda claimed the next three spots with the Honda Civic (2.53 percent), the Honda CR-V (2.46 percent) and the Honda Accord (2.37 percent). While the F-150 and Silverado were the most popular models, their competition led the way in customer loyalty. The Ram 1500 full-size pickup truck had a customer loyalty rate of 50.9 percent, followed by the F-150 at 46.3 percent and the Lincoln MKZ at 43.9 percent. In other trends: Non-luxury small CUV/SUVs were tops in segment market at 17.81 percent, followed by non-luxury mid-size sedans (13.89 percent) and non-luxury mid-size SUVs (13.22 percent). Tesla led the industry with a Conquest/Defection ratio of 13.77 to 1. 4-cylinder engines overtook 6-cylinder engines as the top engine type, 38 percent to 37.4 percent Vehicles in Operation are expected to reach 292 million by 2020 For more information on how to drive customer loyalty rates, visit Experian Automotive.
If you listen to some of the latest auto industry analysis, you might get the impression that the industry is doomed because younger consumers aren’t interested in buying cars. It is true the vast majority – 61.3 percent – of new vehicle registrations in 2016 were from customers 45 years old and older, but is that really a cause for concern? Or are automotive marketers simply doing a better job of identifying customers with the means to buy their product? Remember Willie Sutton’s response when asked why he robbed banks? “Because that’s where the money is.” Maybe, just maybe, automotive marketers are getting better at market segmentation and finding the right customers for their vehicles. Maybe, they’re simply going to “where the money is” like Willie Sutton. How do auto marketers know where to look? Experian’s Mosaic® USA consumer lifestyle segmentation is a good place to start. It is made up of 71 different consumer groupings from the most affluent suburbanites to the most economically challenged. Understanding who and where these customers are and knowing which vehicles fit their current lifestyles and economic standing can help automakers and retailers boost sales. Take luxury vehicles, for example. In Q4 2016, the top three Mosaic® consumer segments in the luxury vehicle category included: American Royalty – 12.67 percent Silver Sophisticates – 7.69 percent Aging in Aquarius – 5.01 percent Who are these folks? Individuals and households in the: American Royalty include wealthy, empty nest Baby Boomers with million dollar homes; Silver Sophisticates include a mix of older and retired couples and singles living in suburban comfort; and Aging in Aquarius include empty-nesting couples between 50 and 65 years old with no children at home who are finally enjoying the kick-back-and-relax stage of their lives. What do each of these segments have in common? Their members have the disposable income to pamper themselves a bit, and a luxury vehicle might just be the way to do it. But, what if you sell minivans? The Mosaic consumer segment Babies and Bliss is one target audience to consider targeting. These large families with multiple children live in homes valued over $250,000 and should be at the top of your prospecting list. How about those younger customers who seem so anti-auto? Fast Track Couples -- families on the road to upward mobility, under the age of 35, with good jobs and own their homes are ripe for a CUV. Or perhaps Status Seeking Singles -- younger, middle-class singles preoccupied with balancing work and leisure lifestyles? There’s got to be a hybrid vehicles waiting for them, right? Just because younger customers are still in the minority of auto buyers, it doesn’t mean the industry is in crisis. The right customer segment for the right vehicle is out there – even in the younger demographics. And besides…younger customers get older so now is the time to win their hearts and minds and begin building a long-term relationship with them. But, if you’re not the patient type and you’ve got a vehicle to sell, you can find your next best customer by using Mosaic USA to create cross-channel messaging that connects with the lifestyle and values of your audience. For more information on automotive target marketing, visit Experian Automotive.
Latest results from Experian's Market Trends report shows that 17.3 million new vehicles have been added to the U.S. Market of light-duty vehicles on the road.
If you live in Michigan, you are more likely to be loyal to the brand of car you drive when purchasing your next one
Apply Automotive TagWith Detroit’s Motor City being the epicenter of the North American automotive manufacturing industry, that detail should come as no surprise. Furthermore, a recent analysis of Experian data showed that of the nearly 12.6 million consumers who returned to market to purchase a new vehicle, 60.9 percent remained loyal to their brand. Consumers going from a Certified Pre-Owned (CPO) vehicle to another CPO vehicle from the same original equipment manufacturer (OEM) showed even higher loyalty rates at 75 percent. Seeing as how pre-owned vehicle purchases are on the rise, and becoming more and more popular among consumers across all credit risk tiers, it isn’t unexpected to see higher loyalty rates in the CPO category. CPO vehicles are an attractive option for both auto manufacturers and consumers. Auto manufacturers continue to increase sales through higher rates of lease penetration, then channel these off-lease vehicles into certified pre-owned fleets. In essence, they are controlling both supply and demand of their off-lease used vehicles and building an amazingly loyal customer base. By understanding these loyalty rates, manufacturers, dealers and resellers are able to make smarter decisions that create more opportunities for themselves and in-market consumers. Buying a CPO vehicle can also give consumers an extra layer of confidence when making a purchasing decision because of the multi-point inspections included in the manufacturer’s program. Now, what about Michigan you ask? Well, if you are a Michiganian, you are 63 percent more likely to remain loyal to your particular brand of car. The analysis showed North Dakota (62.4 percent) and South Dakota (61.4 percent) round out the top three states with the most brand-loyal consumers. But, regardless of home state, which brands do consumers choose time and time again? Well, for overall brand loyalty including all purchase types, Tesla ranked highest, with 70.3 percent of Tesla owners choosing to buy another. Subaru was second, with 65.9 percent of its owners coming back, followed by Ford at 65 percent, Toyota at 63.5 percent and Mercedes-Benz at 63.1 percent. Other findings: CUV/SUV owners were most loyal when returning to market, with 69.6 percent returning to buy another CUV/SUV, followed by pickup owners (59.6 percent), sedan owners (58.4 percent), minivan owners (33.2 percent) and hatchback owners (29.4 percent). CPO owners choosing to purchase another CPO vehicle, were loyal to: Ford, 84.6% Mercedes-Benz, 82.8% Honda, 81.9% Toyota, 81.6% Lincoln, 78.1% CPO owners that chose to buy a new vehicle, were loyal to: Kia, 65% Ford, 63.5% Toyota, 63.1% Honda, 60.5% Chevrolet, 58.4% To find out more about Experian Automotive’s research into the automotive marketplace, visit https://www.experian.com/automotive/auto-industry-analysis.html.
Experian’s latest Market Trends and Loyalty report shows that for the first time in history, cars with four-cylinder engines have outpaced any other light-duty vehicle type on the road. That’s because the auto industry has been hard at work the past two decades improving both power and fuel efficiency of its engines. Auto manufacturers have been given aggressive fuel efficiency targets (54.5 mpg by 2025), but still need to meet consumer demand for performance. The net result is today’s average four-cylinder engine (188.1 hp) actually has more horsepower than the average V8 from 20 years ago (188 hp). It has helped four-cylinder engines become the most prominent engine type on the road, according to Experian Automotive Vehicles in Operation (VIO) database. Of the vehicles on the road, 37.7 percent are being powered by a four-cylinder engine, compared to 37.6 percent of six-cylinder engines. The top five vehicles at both the VIO and registration levels shows that all but one have four-cylinder engines. Top segments Total VIO Q3 vehicle registrations 1. Full-size pickup 1. Entry-level CUV 2. Standard midrange car 2. Full-size pickup 3. Small economy car 3. Small economy car 4. Lower midrange car 4. Standard midrange car 5. Entry-level CUV 5. Lower midrange car The four-cylinder VIO market share growth will continue in the future. In 2016, for example, four-cylinder engines accounted for 54.2 percent of all engines in new vehicles sold. It is the fifth consecutive year that four-cylinder engines had more than 50 percent market share. Market share for six-cylinder engines has dropped from 32.5 percent in 2012 to 29.7 percent in 2016, while eight-cylinder engines have dropped from 16.1 percent to 12.1 percent.