Automotive
There are over 280M cars and light duty trucks on the road and over 25% have at least one open recall. Do you know which of your online units have an open recall? Would it be helpful to your business if you had up-to-date recall information available every day—automatically? AutoCheck® dealerships can receive an emailed daily Open Recall Inventory Check Report as part of their AutoCheck subscription. The report (PDF format) will show dealers which of their online listings have an open recall. The report will list inventory that has open recall(s) based on pre-owned vehicles the dealer has listed on AutoCheck.com. Having an easily reviewable report delivered to your Inbox is a great way to stay on top of internal recall policies and procedures. Taking care of open recalls is good for business Taking action on recalls is also good for business. Consumers searching your online inventory want transparency from their dealer and running across a vehicle that has an open recall may not be in the dealer’s best interest. Taking care of that recall and ensuring that a consumer doesn’t stumble across it during the purchase process is good for consumer loyalty. Another AutoCheck dealer benefit is the option to list pre-owned inventory on CarZing and AutoCheck.com for no additional fee. AutoCheck is the exclusive vehicle history report provider on CarZing.com, so the CarZing vehicle details page will display both AutoCheck data elements and provide a link to the full AutoCheck report. Any AutoCheck dealer displaying their inventory on CarZing will automatically have their inventory available via the “Finding Vehicles” search features on AutoCheck.com. (Yes, you read that correctly – dealers can list their inventory on CarZing and AutoCheck.com for NO additional fee – it’s part of their AutoCheck subscription!) In addition, any dealer listing their inventory on AutoCheck.com can also receive the AutoCheck Open Recall Inventory Check report. Please note that Experian provides the AutoCheck Open Recall Inventory Check Report based upon recall information reported and made available to Experian by the applicable automotive manufacturer(s). Clients should check the automotive manufacturer’s website for the most current recall information for all inventory vehicles. For dealers with an AutoCheck subscription, you can activate your vehicle listings for free on AutoCheck.com and CarZing.com, by calling client services at 1 888 409 2204. For dealers that are not yet subscribers, here’s a few other things you may not know about AutoCheck Vehicle History Reports. We do not re-market to shoppers, resell VDP leads or offer your competitors inventory for consideration on AutoCheck.com. Our goal is to help your dealership sell your inventory. For dealers who are interested in learning more about the benefits of becoming an AutoCheck subscriber contact us today.
While dealers wait out the chip shortage, many are looking for new revenue streams and creative ways to maintain profit levels. Dealers understand that used vehicles are more valuable than ever and that savvy consumers who are near their lease term can purchase their vehicle with a much higher book value than their negotiated residual and capitalize on that extra equity. At Experian Automotive, we help dealers analyze consumer and market data insights so they can develop marketing strategies that more effectively engage consumers. In today’s market, we recommend dealers focus on targeting consumers who are nearing the term of their lease—because the end of a lease forces consumers to either turn in the vehicle or purchase it—and many consumers realize they can purchase their equity rich vehicle and trade it in anywhere. Dealers desiring to conquest customers would benefit from using data insights to develop marketing strategies to help educate consumers of their options. So, how do dealers make sure their lease customers remain loyal to their dealership? One way is to target those customers that are near term and recommend a trade in. In many cases, the customer can upgrade to a model with more features or a model in a different class—both of which may be compelling, even if the newer vehicle is an older model year than the trade in. This way, the dealer obtains the later model, lower mileage vehicle and the customer gets a model with the extra features they want or an entirely new class of vehicle. Both parties are happy. What about third party lease buy outs? In response to the inventory shortage, many captive lenders are no longer permitting 3rd party lease buy outs. In other words, consumers are required to purchase their leased vehicle at an in-brand dealership. Initially, this would appear to bolster brand loyalty by making it more challenging to switch brands. However, educated consumers know they can simply purchase the vehicle and drive it to another dealership as a trade. We recommend automotive dealers educate consumers on their options through effective marketing strategies that offer options and more freedom in their car purchasing. Dealers looking for every sales opportunity are utilizing data sources such as Experian’s Automotive Intelligence Engine™ (AIE) to identify all consumers with leased vehicles for their brands. Because the OEM will not share lease customer information for neighboring stores, dealers must seek out this information on their own. Experian’s Automotive Intelligence Engine provides off lease consumer information for conquest brands as well as dealer brands. The OEM still expects each store to be successful and using data-driven insights to uncover opportunities in this tight market is one critical way dealers can stay competitive and increase brand loyalty. The chip shortage will eventually recede but until then dealers can use automotive data insights that can help them remain profitable. Learn more about Experian’s Automotive Intelligence Engine.
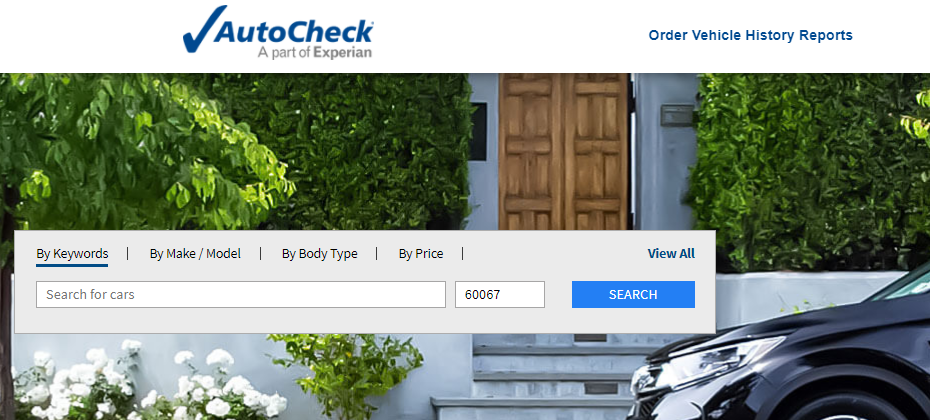
As more consumers turn to the internet to research and purchase preowned vehicles, dealers have focused marketing efforts to the online marketplace to get their vehicles in front of shoppers. According to Think with Google, 95% of vehicle buyers use digital as a source of information and it takes 65% of buyers just three weeks to research vehicles online prior to purchase. With seventy-eight percent of consumers visiting two or more sites during their shopping “journey”1 how do dealers capture their attention, increase lead and sales conversions? Dealers need to share key data in a vehicle history report such as information related to reported accidents, odometer readings, open recalls, and whether the vehicle qualifies for buyback protection. These details help consumers better understand and make informed decisions when shopping. Case Study: How leveraging the AutoCheck VHR subscription increased lead and sales conversions Our integration partner, CarZing, an online auto shopping portal, offered a Free AutoCheck® Vehicle History Report on their Vehicle Detail Page (VDP) which increased lead and sales conversions. Together, we analyzed six months of lead activity on millions of vehicle listings on CarZing focusing on the 200 most popular vehicles by year/make/model. Key findings indicated that vehicle listings offering a Free AutoCheck VHR on the VDPs achieved a higher lead conversion rate than listings for the same year/make/model for vehicles without a Free AutoCheck report. Here’s a few highlights from the full report: Furthermore, when layering in available sales data, sales conversion is higher for vehicles featuring a free VHR available to consumers than vehicle listings that did not. Based on the results, CarZing’s Director of Operations, Frank Merle strongly encourages all AutoCheck clients take advantage of the exponential value that offering a free AutoCheck report brings to dealership VDPs. Dealers with an AutoCheck subscription can list their vehicles for free on AutoCheck.com and CarZing.com. Simply contact your Experian account executive or call 1 888 409 2204. For dealers that are not yet subscribers, here’s a few more things you may not know about Experian AutoCheck Vehicle History Reports. We do not re-market to shoppers, resell VDP leads or offer your competitors’ inventory for consideration on AutoCheck.com. Our goal is to help your dealership sell your inventory. For dealers who are interested in learning more about the benefits of becoming an AutoCheck subscriber contact us today. 1https://www.coxautoinc.com/wp-content/uploads/2021/02/Cox-Automotive-Car-Buyer-Journey-Study-Pandemic-Edition-Summary.pdf

In Experian’s Automotive Market Trends Review: Q2 2021, we looked at the data to better understand EV and internal combustion engine registration trends.

Although 2021’s continued focus is Americans learning to co-exist with COVID-19, automotive manufacturers and dealers will likely remember 2021 as the year of the chip. The semiconductor chip shortage is now expected to cost the global automotive industry $210 billion in revenue in 2021 and it is now forecasted that 7.7 million units of production will be lost in 2021, up from 3.9 million in the May forecast.1 Most experts agree that the shortage will likely extend into 2022. Chip Shortage Creates Additional Challenge for Dealers The current shortage in semiconductors has automotive manufacturers and dealers questioning whether to continue advertising or pull back. Some dealers view the increase in profits due to reduced inventory a signal to pull back on advertising spend. Other dealers, however, are thinking about long-term marketing strategy—and are continuing to advertise to help maintain brand exposure to customers. Foreword-thinking dealers and agencies should use this time to evaluate advertising strategies and plan for life after the chip shortage. Staying visible to customers in the interim is critical, so any advertising needs to be strategic in audience, medium and message. Here are three recommendations to help keep your brand in front of current and future consumers while using marketing dollars wisely. Identify Your Audience: Be Sure to Market to the Right People Knowing which consumers are most likely to purchase your vehicles is a key element of targeting with the promise of saving money by marketing only to those who are most likely to result in a sale. By evaluating prior purchase, demographic, and psychographic trends, including specific life events, dealership marketers can more effectively pinpoint demand as well as foster positive relationships. For example, knowing that a consumer recently added a new child to the family would be a great reason to send a coupon or make a call. Experian’s Automotive Intelligence Engine™ (AIE) will send “events” to your CRM to alert you of life events that can help develop and deepen relationships that lead to future vehicle sales. Additionally, AIE’s Market Insights enable dealers to grow market share by identifying the best prospects and matching them with the right messages. Strategically targeting both conquest and loyal customers with appropriate messaging keeps consumers engaged so they will remember your brand when they buy next. Leverage Your Brand Reputation Keeping your brand front and center has been the cornerstone of your marketing efforts and that shouldn’t change. Much like looking at family photos or reading an article about your favorite team, exposure to positive advertisements reinforces a consumer’s relationship with your brand. Whether the goal is to leverage your OEM driven brand awareness or support the consumer relationship with your dealership, positive messages from local dealers perpetuate ongoing loyalty. Experian’s Automotive Intelligence Engine generates powerful marketing strategies and efficient data-driven, omni-channel media plans with engaging, brand-specific messaging direction that resonates with consumers. Dealers and agencies use AIE to generate custom marketing plans that leverage data-driven market analysis, strategic audience creation, and powerful marketing strategy, creating messages that effectively reach the right prospects, with the right message, on the right channel. This end-to-end solution will reach consumer mailboxes, inboxes, screens, and computers where your best audiences spend their time. Continue to Foster a Positive Relationship with Consumers Marketing is more than selling a story. Marketing initiates the consumer experience, especially in the digital world. From effective OTT ads to strategic social posts, successful dealerships often put their relationship with the community at the heart of their message. Simple images of your dealership delivering meals to local first responders and essential workers or posts showing the local high school marching band loading instruments into one of your trucks can convey a strong sense of community pride to your brand. This sort of promotion impacts future consumer purchases well beyond any chip shortage. While the chip shortage has had a profound impact on how dealerships approach vehicle acquisition, price structures and marketing, it will eventually be resolved. The decisions you make now can have a big impact on your success when the shortage ends. Learn more about Experian’s Automotive Intelligence Engine™ (AIE). https://www.cnbc.com/2021/09/23/chip-shortage-expected-to-cost-auto-industry-210-billion-in-2021.html

When we look at how automotive manufacturers and dealers have marketed vehicles over the last few decades, we can see how through every decade, and every learning, it has led to data-driven marketing strategies that are powering success today. Let’s take a look: Strategic marketing in the 1990’s In the 1990’s dealership marketing included mainly newspaper and radio advertisements complimented by occasional direct mail pieces mailing to every home in a zip code. OEMs purchased ad time on popular Television and their dealer associations and local dealers had an option to do the same. Because the 1990’s was the age of “mass media,” marketing was based off geography. There was less attention on channel or audience and a good deal of spending! Cars were sold. Strategic marketing in the 2000’s The new millennium brought advancements in computers and databases. Dealerships explored the exciting world of internet promotion and email marketing and continued using traditional newspaper, radio and television to drive traffic. mail programs such as the “scratch and win” or the “key to a car you can win” efforts were common, resulting in massive mail-based marketing campaigns. Then came 2008, when many dealers drastically cut back on spending and were focused mainly on surviving the Great Recession. As we all know, many dealers, and even vehicle makes, did not. Strategic marketing in the 2010’s In the beginning of the decade, manufacturers and dealers were still recovering from the recession but were slowly feeling more optimistic about the economy. If there is one thing the industry learned from the recession, it was to be much more strategic when it came to spending. During this decade, ad technology advanced, as did the ability to evaluate marketing spend. Dealers became aware of the true cost of their traditional marketing ways and embarked on new paths of marketing to a smaller but more specific audience. Equity mining and greatly advanced revolutionized the direct mail and related online arena. As the decade drew to a close, marketers leveraged solutions where merge fields enabled customization and personalization for both direct mail and email marketing. With the ability to deliver massive volumes at a lower cost, email blasts grew in popularity. Social media platforms emerged as a force, and dealers experimented to invent new ways to leverage them. Television marketing underwent a massive facelift as consumers left cable for streaming services resulting in new advertising strategies such as addressable and connected TV, OTT (Over The Top) advertising. Strategic marketing in 2020 2020 will forever be remembered as the year of the pandemic. In automotive marketing, it was also the year of reinvention! With many showroom closures, dealers and OEMs found themselves with a reduced advertising budget and a greater need to find more targeted audiences with more effective marketing messaging. How do I master my market share? Who is in-market for my vehicles? How is my website performing? Which customers are in equity? Which customers have added a child to the household? How do I reach them in a digital world? This is where Experian has helped both manufacturers and dealers. Experian’s automotive marketing solutions help marketers utilize vehicle, consumer, lender, and market data to leverage market insights, target the right audience, develop effective messaging strategies, and measure outcomes to continually optimize results. Over the last four decades, automotive marketing strategies have become much more data driven, so having a solution that uses data insights to help retain loyal customers and win new conquest customers, all while reducing total marketing spend, is a key requirement for success in this decade…and beyond. If you're a marketer at a Dealership, learn more about our marketing solutions here. If you're an Auto OEM marketer, learn more about our marketing solutions here.

The AutoCheck FREE Flood Risk Check site has been updated with Hurricane Ida information New cars have been in short supply due to the worldwide microchip shortage, so consumers quickly turned their attention to used cars. Unfortunately, dealers continue to struggle with obtaining enough used car inventory to meet demand. To add to an already challenging year, Hurricane Ida hit the gulf coast in August resulting in an estimated 250,000 cars sustaining flood damage. It’s more important than ever that dealers be careful about obtaining pre-owned cars that could potentially have flood damage. The best way to mitigate the risk of purchasing a flood damaged vehicle is to start by running an AutoCheck Free Flood Risk Check. Visitors simply enter any vehicle's 17-digit VIN and the tool will check for flood brands and provide information if the vehicle was registered in a region impacted by a FEMA disaster declaration. Two levels of reporting available The first level of reporting determines whether the vehicle has been titled/registered 12 months prior in a county that has been identified as requiring public and individual assistance (FEMA categories A and B) for a FEMA-declared major disaster. This would yield a “Yes” result. For instance, you would get a “Yes” result if the vehicle was registered in an impacted area during the time of a FEMA-declared major disaster like Hurricane Ida. The “Yes” result should not be interpreted as confirmation of flood damage or even possible flood damage. The data is provided merely as information regarding the location of the vehicle’s registration/title history so users can be aware of risk exposure. For example, the Hurricane Ida region had thousands of damaged cars, but some cars in the region may not have been damaged by the hurricane — the owner could have driven the car when they evacuated, or a child or other family member may have been out of town with the car when the hurricane hit. The second level of reporting is based on search results from Experian data such as flood title and problem records, including flood State title brands, auction flood announcements, salvage auction flood designations, and other vehicle records determined by Experian to relate to or suggest an increased likelihood of flood damage or risk exposure. It takes time for claims and updates to vehicle title information to appear on a vehicle’s history and although the DMV requires that title brands be issued for vehicles damaged by floods, not every vehicle flood event is reported by car owners. Unreported flood events may not appear on an AutoCheck Flood Risk Check or AutoCheck Vehicle History Report. Although Experian provides flood related records from available data sources, we cannot provide assurance that an AutoCheck Flood Risk Check that does not produce any records means that the subject vehicle has not experienced flood damage. That’s why it’s important to review a full AutoCheck Vehicle History Report, which—in addition to potential flood damage—includes reported accidents, branded titles, recalls, number of owners and more. Once you run the full Vehicle History Report we recommend an independent evaluation and inspection of the vehicle to determine and confirm a vehicle’s condition prior to purchase. Try the AutoCheck Flood Risk Check today to help mitigate the risk of purchasing flood damaged vehicles. Not an AutoCheck subscriber? Contact us to become an AutoCheck client.

Despite used vehicle prices rising, loan-to-value (LTVs) ratios are dropping. Ultimately, lower LTVs are a positive trend for consumers because it puts them into positive equity on their vehicle faster.
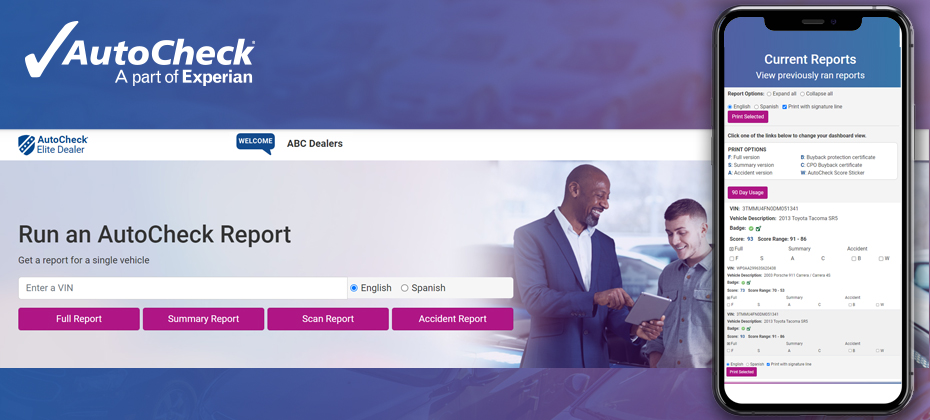
We’re excited to announce that the AutoCheck Member Website has received a facelift! AutoCheck has always been the industrial strength Vehicle History Report that automotive professionals trust to help manage risk and confidently buy and sell the right vehicles. We’ve made this great solution even greater by improving our Member Site user experience. Based on extensive research and user feedback, we’ve added many visual and workflow enhancements which make it easier for users to use the site. One noticeable change to the Member Website is the addition of Experian’s brand and color scheme. You’ll know right away that you’re accessing AutoCheck data backed by Experian, the industry experts for reliable data. The entire site is now mobile responsive—optimizing the experience for tablet and mobile users to provide even more shopping convenience. The new site will allow full functionality from a tablet or mobile device. As always, subscribers can continue to access AutoCheck reports via our mobile app or AutoCheck Fast Link℠ integration within their DMS, CRM, inventory management, online vehicle listings or many other integrated solutions. In addition, the AutoCheck Member Website is now WCAG 2.1 compliant. Web Content Accessibility Guidelines (WCAG) were developed to make web content more accessible to people with disabilities. This ‘web content’ usually refers to text, images and sounds on a webpage or web application. It also may include code that defines structure and presentation of the page of application. While a generated AutoCheck was already WCAG2.1 compliant, the entire member site now also meets the accessibility guidelines. AutoCheck Members can expect the same great functionality once they have signed into the site: Run single or multiple reports Print and email AutoCheck reports Print the Buyback Protection Certificate and the AutoCheck Score Sticker View the Track their 90-day usage Access AutoCheck brand materials including logos, videos and showroom materials Review Best Practices and Frequently Asked Questions Update account information …and much more! Below are a couple of examples which highlight the new user experience. Already an AutoCheck Member? Contact us or call us at 1.888.409.2204 if you have any questions about navigating the redesigned website. Not an AutoCheck subscriber? Contact us to become an AutoCheck client and take advantage of all the benefits.

Your local auto market changes every day. Today’s challenge is securing the inventory needed to keep new and repeat customers coming in the door. Tomorrow it might be finding the right customers for the inventory you have secured. Either way, understanding the competitive activity in your market is key to developing ongoing strategies for success. Important competitive insights include the ability to: • Gauge your performance against the competition by identifying each unit registered in your market • Discover what vehicles are popular among your consumers by make and model • Identify the key characteristics of customers in your area. In yet another benefit, Experian provides our AutoCheck Elite dealer clients with complimentary access to in-depth market reporting, including these comprehensive reports: The AutoCount Market Ranking Report Learn whether you’re getting your share of vehicle sales in your local market’s top zip codes. This report: • Lists all sales activity within a 15-mile radius of your dealership • Provides unbiased monthly information from state DMVs on new and used vehicle sales • Includes access to our web-based portal to provide instant access to a variety of customizable reports • Identifies vehicle registration by ZIP code to pinpoint marketing opportunities The AutoCount Vehicle Model Ranking Report Stock the right inventory by learning what vehicles are popular among your consumers (see example below). This report: • Provides an expanded view of the dealership’s market, which leads to more informed decisions that maximize untapped profit potential • Track the top 25 new and used vehicles within a 15-mile radius of your dealership as well as the top gainers and losers in the market • Offers an easy-to-read graphical summary of critical market information, including lender ranking • Gives an unbiased scorecard of dealership performance in the local market to determine market share and competitive insight Having access to monthly DMV reports and analysis can help deliver a competitive edge to your dealership. To become an AutoCheck member today, contact us or call 1.888.409.2204.

The automotive finance market is beginning to level out to pre-pandemic trends in Q2 2021.

I woke up early this morning to get my run in on the treadmill before starting my day. As I listened to music on my Pandora account, I saw an advertisement for my local Ford dealer. Later in the week, I was streaming my favorite show, and on came an advertisement suggesting I service my vehicle at the same local Ford dealer. When I checked my email on Tuesday, I remembered I wanted to schedule my service. Then came the letter with an option to check the appraisal for my vehicle. Now, I am fully shopping!!! Why you ask? Because the marketing message across so many channels set the stage for my interest. According to Google, multi-channel users will have a 30 percent higher lifetime value compared to single channel users. As contemporary society grows more attached to streaming services, social media and their cell phones, it is imperative to market to consumers where they spend time. Why then do so many automotive marketing companies only offer direct mail and email? Simple− those two forms of communication have been around for decades and can be the most cost effective to provide. While direct mail marketing is effective, utilizing the power of social media, streaming services and other digital platforms effectively puts your message in front of consumers. While I can toss the letter on my desk for later reading, the video commercial during my television streaming cannot be set aside. Multi-channel marketing combines various platforms to amplify your campaign’s frequency and reach, creating more effective messaging. One channel is often not enough for a robust marketing campaign since audiences tend to frequent many different channels. Experian’s Automotive Intelligence Engine with Marketing Creative & Fulfillment executes the strategic marketing plan created in AIE with true multi-channel messaging. This end-to-end solution utilizes Experian’s world-class data to create a powerful, brand-specific marketing strategy that resonates with your buyers by reaching their inbox, mailbox, screen and desktop −where they spend the most time.

Have you ever wanted to ask a customer to sign an AutoCheck vehicle history report to indicate they have received and reviewed the report and they are aware of the status of the vehicle they are purchasing?

Experian’s Q1 2021 Automotive Market Trends Review revealed that some of the once-consistent new registration generational trends have reversed.
The AutoCheck® Elite program enables auto dealerships to better understand the vehicles in their market. And, right now, making strategic decisions about stocking the right inventory and marketing to the right consumers has never been more important.