Automotive

In the Q1 2021 Market Trends Review, we explore the average age myth and highlight other ways to inform aftermarket strategy.

Expanded FCRA regulated data can help lenders extend more credit, and ensure consumers have access to affordable credit when they need it.

Experian's Q1 2021 State of the Automotive Finance Market report explores the benefits of leveraging both national and regional data when strategizing.
Trends can vary based on location. In the Q1 2021 State of the Automotive Finance Market report, we took a look at market share nationally and regionally.
AutoCheck® is a powerful vehicle history report that helps take the unknown out of the used car buying process, so you can confidently understand, compare, and select a vehicle that is right for you. Only AutoCheck vehicle history reports include the patented AutoCheck Score, which summarizes vehicle history data into an easy to understand ‘Score” along with an equivalent score range. The patented AutoCheck Score predicts the likelihood a car will be on the road in 5 years. It compares vehicles of similar age and class based on a scale of 1-100. The AutoCheck Score is based on a proprietary model to help you understand a vehicles predicted reliability as it pertains to age, number of owners, accidents and other vehicle history factors. Watch this video to learn more about the AutoCheck vehicle history report and how it can help you identify hidden damage and accident events to avoid costly mistakes. Contact us to learn more about becoming an AutoCheck subscriber.

As the used vehicle market continues to thrive, a vehicle history report is more vital than ever. There can be hidden risk associated with used cars. It’s important for dealers to ensure the safety of their inventory for car shoppers. This is why dealers need to consistently use vehicle history reports when acquiring vehicles from the auction. AutoCheck vehicle history reports include data from 95% of all U.S. Auction Houses, with most providing exclusive structural damage announcement information. We want to help dealers feel more confident in the used vehicles they bring into their inventory. Contact us to learn more about becoming an AutoCheck subscriber.

Experian’s Q4 2020 Market Trends Review takes a closer look at aftermarket trends, including the growing sweet spot.

In 2020, new trends emerged, driven by a continued shift in consumer preferences. Let’s take a closer look at how the industry fared during the year.

AutoCheck Buyback Protection is a policy that will compensate a consumer by buying back their vehicle under certain circumstances...

Experian's Q4 2020 State of the Automotive Finance Market report gives insight into the current state of the leasing market.
The Q4 2020 State of the Automotive Finance Market report zooms in to get a better picture of the alternative fuel marketplace.
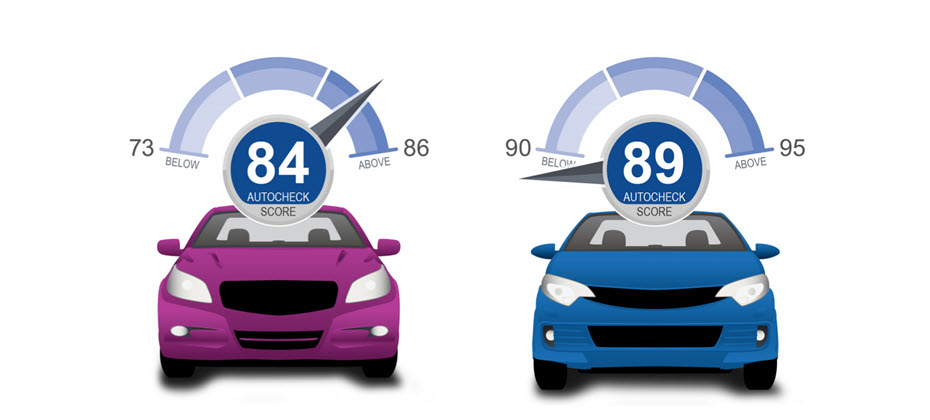
Do you know what the patented AutoCheck Score represents? The AutoCheck Score predicts the likelihood an individual vehicle will be on the road in five years.

Last year is a testament to how quickly trends can shift, and entire industries can be turned upside down.

Millennials and Gen Z consumers have proven to be future trend shapers for the auto industry.

Experian Automotive Market Insights includes an in-depth analysis of auction volume across the United States.