Automotive

Experian Automotive Market Insights helps dealers efficiently identify potential conquest opportunities in their region and beyond.

Experian Automotive Market Insights dashboard provides a variety of insights to help dealers tackle their biggest challenges.

Small SUVs became the most financed vehicle segment in Q3 2020, making up 26.01% of all financed vehicles during the quarter.

According to Experian’s Q3 2020 State of the Automotive Finance Market report, 26.20% of all new vehicles are leased compared to 30.27% last year.

While things aren't quite back to normal in Q3 2020, there were a number of positive trends that demonstrates the automotive industry's resilience.

Leveraging data to eliminate wasted ad spend will set your dealership up for success in the new year.

When we think about vehicle history, we tend to imagine two audiences: dealers and consumers. After all, identifying any potential hidden defects could have a significant impact on a used car buying decision; vehicle history reports are an invaluable part of the process. But it’s not just dealers and consumers who can benefit. It takes three things to sell a vehicle: the car (dealers), the consumer and credit; we’ve covered the first two, so let’s focus on the third. Lenders take a plethora of information into consideration when making automotive lending decisions, including a borrower’s credit score, payment history and utilization rate. But these data points only reflect the risk associated with the borrower; there’s also inherent risk with the vehicle itself. I recently participated in a virtual workshop, The Risky Side of the Road, during Used Car Week 2020, where we discussed the value of leveraging vehicle history information to minimize risk with lending decisions. Extending a loan to a borrower hoping to purchase a used vehicle with unidentified defects exposes the lender to unnecessary risk; hidden damage and maintenance costs could impact a borrower’s ability to repay the loan. To minimize portfolio risk, we recommend lenders leverage vehicle history reports, such as AutoCheck, before making a lending decision. Hidden Damage Significantly Impacts Vehicle Value Let’s consider the universe of used vehicles that could potentially be sold and financed. According to Experian’s Q2 2020 Market Trends Review, there are more than 280 million vehicles on the road. And our research indicates that four out of 10 of the cars and light duty trucks on the road have been in at least one accident, and around 20% of vehicles have been in multiple accidents. What does this mean for a vehicle’s value? Even if a vehicle has been completely restored and repaired, the value of the vehicle diminishes. According to a recent Mitchell Industry Trends Physical Damage Report, in Q2 2019, the average diminished value for a vehicle involved in an accident was $3,151; and this doesn’t include the fiscal impact of other hidden defects, such as flood damage. And the loss in value trickles down to the consumer and lender. For instance, if a lender unknowingly extends a $10,000 loan to a consumer who purchases a used vehicle that was involved in an accident, the actual value of the vehicle may be around $7,000. If the consumer decides to sell the vehicle before paying off the loan, it is very likely they will be up-side down. If the consumer falls behind on payments and the vehicle is repossessed, it will be difficult for the lender to recoup any losses at auction. But that’s where vehicle history reports come into play. Tools, such as AutoCheck vehicle history reports, inform lenders about reported accidents and recall information, among other insights. In addition, the AutoCheck Score, enables users to compare a vehicle with vehicles of similar class and age and assess the likelihood it will be on the road in five years. The AutoCheck Score can also help gauge the value and drivability of a repossessed vehicle. For example, according to Experian’s similarly titled white paper, The Risky Side of the Road, we found that the percentage of repossessed vehicles that were drivable was higher for vehicles assured by AutoCheck vehicle history reports (86.16%) versus those that were not assured (80.75%). Additionally, we found that repossessed vehicles that were drivable tend to have higher AutoCheck Score range. And unsurprisingly, vehicles that are drivable tend to perform better at auction, meaning a better return on investment for the lender. During these uncertain times, it is important for lenders to more precisely gauge the level of risk they take on. The more information lenders have about the used vehicles they are financing, the better positioned they will be to offer loan terms that minimize portfolio risk, while better meeting consumer needs. To view Experian’s white paper, The Risky Side of the Road, click here.

Enterprise Security Magazine recently named Experian a Top 10 Fraud and Breach Protection Solutions Provider for 2020. Accelerating trends in the digital economy--stemming from stay-at-home orders and rapid increases in e-commerce and government funding--have created an attractive environment for fraudsters. At the same time, there’s been an uptick in the amount of personally identifiable information (PII) available on the dark web. This combination makes innovative fraud and breach solutions more crucial than ever. Enterprise Security Magazine met with Kathleen Peters, Experian’s Chief Innovation Officer, and Michael Bruemmer, Vice President of Global Data Breach and Consumer Protection, to discuss COVID-19 digital trends, the need for robust fraud protection, and how Experian’s end-to-end breach protection services help businesses protect consumers from fraud. According to the magazine, “With Experian’s best in class analytics, clients can rapidly respond to ever-changing environments by utilizing offerings such as CrossCore® and Sure ProfileTM to identify and prevent fraud.” In addition to our commitment to develop new products to combat the rising threat of fraud, Experian is focused on helping businesses minimize the consequences of a data breach. The magazine noted that, “To serve as a one-stop-shop for data breach protection, Experian offers a wide range of auxiliary services such as incident management, data breach notification, identity protection, and call center support.” We are continuously working to create and integrate innovative and robust solutions to prevent and manage different types of data breaches and fraud. Read the full article Contact us
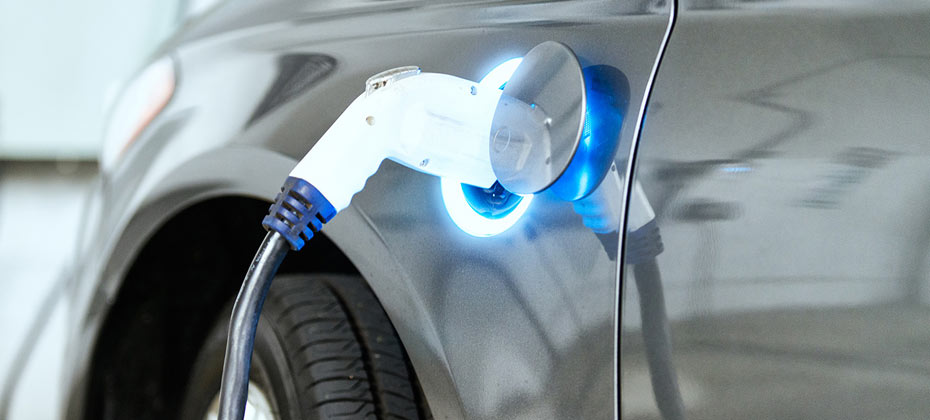
In late September, California announced a new requirement for the sale of all new passenger vehicles to be zero-emission by 2035. While that’s still 15 years away, the executive order created quite a buzz in the automotive industry, reigniting conversations about electric vehicles (EVs) and the current market penetration of the most common zero-emission vehicles. With that in mind, we wanted to take a closer look at the state of EVs—across the country and more specifically, in California—to better understand the EV market and how it’s grown over the past few years. As of Q2 2020, electric vehicles comprised just 0.312% of vehicles in operation (VIO). While EV market share seems small, there has been significant growth since Q2 2015, when they only held 0.0678% of the VIO market—meaning the growth of EVs has more than tripled (3.6x) in the last five years. But even still, other segments, such as CUVs have seen faster growth in the same time period (10% market share in Q2 2020 compared to 6.2% in Q2 2015). California sees faster EV adoption California has seen growth in EV adoption in the last decade, but it has grown exponentially in the last five years. EVs comprised 1.79% of new vehicle registrations 2015, and the percentage grew to 5.32% as of Q2 2020. Much of the growth occurred between 2017 and 2018, when market share jumped from 2.62% to 5.04% year-over-year, with the introduction of the more cost-effective Tesla Model 3. Even with that growth, California new vehicle purchases have a long way to grow to move up to 100% EV. With the popularity of the Model 3, it’s somewhat unsurprising, Tesla holds the lion’s share of the EV market in California, making up 61.9% of EVs on the road within VIO, and nationally at 64.8% share. That could potentially change down the road though. Over the next two years, numerous manufacturers have plans to introduce electric versions of popular models or introduce new EV models altogether. This not only creates competition but could also help continue to drive down vehicle cost, making EVs a more viable option for consumers. Examining costs and other factors Cost is one of the key considerations that industry experts have routinely brought up over the years as a barrier to EV adoption. While some say that maintenance and fuel are cheaper in the long run, purchasing an EV today is typically a more expensive option at the dealership. The average loan amount for an EV in California in 2019 was $40,964, compared to an average vehicle loan amount of $32,373. That said, as EV adoption has seen exponential growth in the last five years, the average price has reduced. The average loan amount for an EV in 2016 was $78,646, dropping more than $35,000 in just five years as the technology continued to mature and vehicle costs lowered. Additionally, tax incentives, particularly in California, have also helped reduce affordability concerns. Though today’s tax incentives may not be in place through 2035, California will likely need to evaluate if economic incentives are required along the way to achieving the zero-emission vehicle deadline. However, even as costs lower, there are additional challenges to be overcome. For instance, infrastructure continues to be a barrier to adoption. In a 2019 AAA study, concern over being able to find a place to charge is the top reason listed as to why respondents are unlikely to purchase an EV in the future. In addition, according to Statisa, in March 2020, the U.S. had almost 25,000 charging stations for plug-in electric vehicles, and approximately 78,500 charging outlets. Of those charging stations, nearly 30% are in California. But with continued growth of EV sales, there will be a critical need for continued infrastructure nationwide—not just in California. In addition to these considerations, many impacts of the new mandate remain unknown. California will have to navigate increased electricity demand—especially during peak hours—and increases in battery scrappage, as EVs wear out. Gas stations will need to manage a loss of revenue, while changes in fuel taxes are likely, and vehicle technicians will require new training. If increased adoption of zero emission vehicles is California’s long-term goal, this could also impact the popularity of used vehicles, which could leave dealers looking for alternative locations to sell their gasoline-powered inventory. Looking toward the future of EVs Realistically, with 15 years until the mandate takes effect, the California mandate won’t have much of an immediate effect on the industry. But it does highlight key considerations for automakers and the aftermarket moving forward. To achieve better adoption rates, automakers need to understand the barriers to success and how they impact consumer behavior. An example of this is how California has seen higher EV adoption rates as the availability of plug-in stations has increased. Continuing to find ways to lower costs and focusing on savings over the lifetime of the vehicle is will help consumers see the value of an EV. At the end of the day, automakers play a large role in moving the country toward EV adoption, so having a clear understanding of the trends can help refine strategies as we move toward an electrified future.

While the automotive industry initially took a hit at the onset of COVID-19, things are beginning to rebound. New vehicle registrations are still down compared to 2019, however, the year-over-year comparisons by month are starting to level out. And, while most of the attention has been paid to new registration figures, we can’t lose sight of the vehicles on the road. Some consumers acted to take advantage of automaker incentives and low interest rates, and others purchased due to newfound needs, but the vast majority have stuck with their current vehicle. That means, despite some bumps over the past few months, opportunity for the aftermarket and dealer service departments to thrive by keeping these vehicles on the road still exists. It starts with understanding what’s on the road. Insight into these vehicles will better position aftermarket suppliers and repairs shops to perform scheduled maintenance and address the needs of drivers. According to Experian’s Q2 2020 Market Trends Review, there were 280.6 million vehicles in operation, up from 278.1 million a year ago. Of those vehicles on the road, light-duty trucks accounted for 56.5%, and passenger cars made up the remaining 43.5%. So, there’s little surprise that the top three segments on the road were full-sized pick-ups (16%), CUVs (10%) and mid-range cars (9.9%). And if we break it down even further, the top three brands were Ford (15.5%), Chevrolet (14.3%) and Toyota (12.1%). But we understand that not all 280.6 million vehicles will need aftermarket parts or service; it’s important for the industry to keep a close eye on the aftermarket “sweet spot”—those vehicles that are six- to 12-years old. Identifying these vehicles and anticipating their maintenance needs will help aftermarket suppliers navigate the recovery. In Q2 2020, 31.2% (87.6 million) of vehicles in operation fell within the “sweet spot”—with a mix nearly 46% domestic and 54% import brands. And while the opportunity today is significant, we expect the “sweet spot” to continue to grow for at least the next four years. To make the most of the opportunity, aftermarket suppliers need to understand where these vehicles are located, what types of vehicles fall within the sweet spot and the most common parts that are used. COVID-19 has shifted the industry for all parties involved. Some consumers may opt to hold onto their vehicles a little bit longer rather than purchase a vehicle; only time will tell. In any event, the more aftermarket suppliers and repair shops understand about the vehicles on the road, the better positioned they will be to address the needs of consumers and grow business. To view Experian’s full Q2 2020 Market Trends Review, click here.

Consumers are taking advantage of new car incentives, low interest rates and longer-term loans in order to ensure that their vehicle purchase is manageable.

Staying ahead of the trends and adjusting will support sales growth, while also supporting consumers as they begin to recover from the impact of COVID-19.

Changing consumer behaviors caused by the COVID-19 pandemic have made it difficult for businesses to make good lending decisions. Maintaining a consistent lending portfolio and differentiating good customers who are facing financial struggles from bad actors with criminal intent is getting more difficult, highlighting the need for effective decisioning tools. As part of our ongoing Q&A perspective series, Jim Bander, Experian’s Market Lead, Analytics and Optimization, discusses the importance of automated decisions in today’s uncertain lending environment. Check out what he had to say: Q: What trends and challenges have emerged in the decisioning space since March? JB: In the age of COVID-19, many businesses are facing several challenges simultaneously. First, customers have moved online, and there is a critical need to provide a seamless digital-first experience. Second, there are operational challenges as employees have moved to work from home; IT departments in particular have to place increase priority on agility, security, and cost-control. Note that all of these priorities are well-served by a cloud-first approach to decisioning. Third, the pandemic has led to changes in customer behavior and credit reporting practices. Q: Are automated decisioning tools still effective, given the changes in consumer behaviors and spending? JB: Many businesses are finding automated decisioning tools more important than ever. For example, there are up-sell and cross-sell opportunities when an at-home bank employee speaks with a customer over the phone that simply were not happening in the branch environment. Automated prequalification and instant credit decisions empower these employees to meet consumer needs. Some financial institutions are ready to attract new customers but they have tight marketing budgets. They can make the most of their budget by combining predictive models with automated prescreen decisioning to provide the right customers with the right offers. And, of course, decisioning is a key part of a debt management strategy. As consumers show signs of distress and become delinquent on some of their accounts, lenders need data-driven decisioning systems to treat those customers fairly and effectively. Q: How does automated decisioning differentiate customers who may have missed a payment due to COVID-19 from those with a history of missed payments? JB: Using a variety of credit attributes in an automated decision is the key to understanding a consumer’s financial situation. We have been helping businesses understand that during a downturn, it is important for a decisioning system to look at a consumer through several different lenses to identify financially stressed consumers with early-warning indicators, respond quickly to change, predict future customer behavior, and deliver the best treatment at the right time based on customer specific situations or behaviors. In addition to traditional credit attributes that reflect a consumer’s credit behavior at a single point in time, trended attributes can highlight changes in a consumer’s behavior. Furthermore, Experian was the first lender to release new attributes specifically created to address new challenges that have arisen since the onset of COVID. These attributes help lenders gain a broader view of each consumer in the current environment to better support them. For example, lenders can use decisioning to proactively identify consumers who may need assistance. Q: What should financial institutions do next? JB: Financial institutions have rarely faced so much uncertainty, but they are generally rising to the occasion. Some had already adopted the CECL accounting standard, and all financial institutions were planning for it. That regulation has encouraged them to set aside loss reserves so they will be in better financial shape during and after the COVID-19 Recession than they were during the Great Recession. The best lenders are making smart investments now—in cloud technology, automated decisioning, and even Ethical and Explainable Artificial Intelligence—that will allow them to survive the COVID Recession and to be even more competitive during an eventual recovery. Financial institutions should also look for tools like Experian’s In the Market Model and Trended 3D Attributes to maximize efficiency and decisioning tactics – helping good customers remain that way while protecting the bottom line. In the Market Models Trended 3D Attributes About our Expert: [avatar user="jim.bander" /] Jim Bander, PhD, Market Lead, Analytics and Optimization, Experian Decision Analytics Jim joined Experian in April 2018 and is responsible for solutions and value propositions applying analytics for financial institutions and other Experian business-to-business clients throughout North America. He has over 20 years of analytics, software, engineering and risk management experience across a variety of industries and disciplines. Jim has applied decision science to many industries, including banking, transportation and the public sector.

As subprime originations decrease, some think that subprime consumers are being locked out of the automotive finance market, but that’s not the whole story.

The early assessment for the automotive industry is that despite significant challenges at the onset of the pandemic, the industry continues to rebound.