Financial Services

Isis has had a slew of announcements – about an impending national rollout and further assertion by both Amex and Chase of their intent to continue their partnership. Surprisingly (or not) Capital One has stayed mum about its plans, and neither has Barclays or Discover shown any interest. And much ink has been spilled at how resolute (and isolationist) Isis has been – including here on this blog. So does the launch reflect a maturity in the JV to tackle a national rollout, or is it being forced to show its hands? Wait..I have more questions... What about the missing partner? I have no reason to believe that CapitalOne will continue its relationship with Isis – as I doubt they learnt anything new from the Isis pilot – apart from the excruciatingly difficult orchestration required to balance multiple TSMs, Carriers, Handsets and the Secure Element. Further, there are no new FI launch partners – no BofA, no WellsFargo, no Citi – who each are capable of paying the upfront cost to be on Isis. But, even to those who can afford it – the requisite capital and operating expenditures stemming from a national rollout, should give pause when compared against the lift Isis can provide to incremental revenue via Isis wallet consumers. This is the biggest qualm for Issuers today – that Isis has all the capability to drive distribution and do secure provisioning – but none of the capacity to drive incremental card revenue. And Isis opting to profit from simply delivering merchant offers based on store proximity, with no visibility in to past payment behavior and no transactional marketing capabilities – is hardly different or better than what FourSquare already does for Amex, for example. So why bother? *Updated* There is also a total misalignment of objectives between Isis and its Issuing partners around customer acquisition. Isis charges for provisioning credentials to the wallet regardless of how many transactions that may follow. So Isis has an incentive to push its wallet to everyone with a phone even if that person never completes a contactless transaction. Where as its Issuers have an incentive to get most bang for the buck by targeting the folks most likely to use a smartphone to pay after activation. See a problem? *End Update* How much more runway does Isis have? This is the question that has been around most. How much more capital is Isis’s parents willing to plow in to the JV before they come calling? The rumored quarter a billion pot holds enough to power a national rollout, but is it enough to sustain that momentum post-launch? If those $100 Amazon Gift cards they were handing out in Austin/SLC to boost consumer adoption (a final push just prior to reporting overall usage numbers) were any indication, Isis needs to invest in a smarter go-to-market strategy. It wouldn’t be surprising if Isis had to go back to its parents for mo’ money so that it can continue to run – while standing absolutely still. Who has a recognizable brand – Isis or Amex/Chase? Isis once boasted about buying a billion impressions in their pilot markets across various marketing channels. I shudder to see the ROI on that ad spend – especially when all the Ads in the world could not help if a customer still had to get a new phone, or get a new SIM by visiting the carrier store – to do what a plastic card can do effortlessly. It’s FI partners (Chase, Amex and CapitalOne) have so far kept any Isis branding outside of their ads, and I doubt if that would change. After all, why would Amex and Chase who collectively spent about $4.2B in advertising last year care about giving Isis any visibility, when a Chase or an Amex customer still has to fire up an Isis app to use a Chase or an Amex card? Why would Amex and Chase dilute its brand by including Isis messaging – when they themselves are pitted against each other inside the wallet? For some inexplicable reason – Isis made a conscious decision to become a consumer brand instead of a white label identity, provisioning and payment platform. (And for all of the faults attributable to Google – they are a consumer brand and yet – look at all the trouble it had to make its payments efforts scale.) I believe that until Isis displays a willingness to let its Issuing partners play front and center, any support they in turn provide to Isis is bound to be non-committal. Have you counted the Point-of-Sale registers? MCX proved to be the sand in mobile payments gears since the announcement. It has had “quite the intended” effect of killing any kind of forward movement on in-store payment initiatives that required a conventional point-of-sale upgrade. Contactless upgrades at point-of-sale which have long been tied to the EMV roadmap has had a series of setbacks, not the least of which is the continuing ambiguity around Issuer readiness, merchant apathy, and roadblocks such as the recent ruling. More so, the ruling injected more ambiguity in to how proximity payments would function, which payment apps must be supported for the same debit or credit transaction etc. With retailers, Isis brings nothing new that others are unable to claim, and infact it brings even less – as there is no new context outside of store-customer-proximity that it can bring to deliver discounts and coupons to customer prospects. And it’s cringeworthy when someone claims to “help” retailers in driving incremental traffic to stores, simply because they are able to pair context and proximity among other factors. These claims are hugely suspect due to how limited their “contexts” are – and no one can blend intent, past behavior, location and other factors better than Google – and even they churned out an inferior product called Google Offers. Transactional data is uniquely valuable – but Banks have been negligent in their role to do anything meaningful. But I digress. Coming full circle: Will we ever see proximity payments realized in a way that does not include the SE? The UICC based Secure Element model has been the favored approach by Carriers, which allows device portability and to exert control on the proximity payments ecosystem. We have seen deviations from the norm – in the form of Bankinter, and the recent RBC/BellID Secure cloud – which reject the notion of an onboard Secure Element, and opts to replace it with credentials on TEE, in memory or on the cloud. There is much interest around this topic, but predicting which way this will turn out is difficult owing to where the power to effect change resides – in the hands of OEMs, Ecosystem owners, Carriers etc. And don’t forget that Networks need to subscribe to this notion of credentials outside of SE, as well. But what about an Isis wallet that decouples itself from NFC/SE? Google has toyed with such an approach, but it clearly has the assets (Gmail, Android et al) to build itself a long runway. What about an Isis that exists outside of NFC/SE? Well – why do you need Isis then? To be fair, such an approach would pale against MCX or Paydiant or a number of other wallets and offer even less reasons for merchants to adopt. Paydiant offers both a better point-of-sale integration and a quicker QR capture – which Isis will struggle to match. It’s abundantly clear – take away the SE – and just as easily, the Carrier value proposition collapses on its own like a pack of cards. That’s one risky bet. What are your thoughts about the future of Isis? I am on Twitter here, if you wish to connect. And you can find me on LinkedIn here. This is a re-post from Cherian's original blog post "Isis: A JV at odds."
The desire to return to portfolio growth is a clear trend in mature credit markets, such as the US and Canada. Historically, credit unions and banks have driven portfolio growth with aggressive out-bound marketing offers designed to attract new customers and members through loan acquisitions. These offers were typically aligned to a particular product with no strategy alignment between multiple divisions within the organization. Further, when existing customers submitted a new request for credit, they were treated the same as incoming new customers with no reference to the overall value of the existing relationship. Today, however, financial institutions are looking to create more value from existing customer relationships to drive sustained portfolio growth by increasing customer retention, loyalty and wallet share. Let’s consider this idea further. By identifying the needs of existing customers and matching them to individual credit risk and affordability, effective cross-sell strategies that link the needs of the individual to risk and affordability can ensure that portfolio growth can be achieved while simultaneously increasing customer satisfaction and promoting loyalty. The need to optimize customer touch-points and provide the best possible customer experience is paramount to future performance, as measured by market share and long-term customer profitability. By also responding rapidly to changing customer credit needs, you can further build trust, increase wallet share and profitably grow your loan portfolios. In the simplest sense, the more of your products a customer uses, the less likely the customer is to leave you for the competition. With these objectives in mind, financial organizations are turning towards the practice of setting holistic, customer-level credit lending parameters. These parameters often referred to as umbrella, or customer lending, limits. The challenges Although the benefits for enhancing existing relationships are clear, there are a number of challenges that bear to mind some important questions to consider: · How do you balance the competing objectives of portfolio loan growth while managing future losses? · How do you know how much your customer can afford? · How do you ensure that customers have access to the products they need when they need them · What is the appropriate communication method to position the offer? Few credit unions or banks have lending strategies that differentiate between new and existing customers. In the most cases, new credit requests are processed identically for both customer groups. The problem with this approach is that it fails to capture and use the power of existing customer data, which will inevitably lead to suboptimal decisions. Similarly, financial institutions frequently provide inconsistent lending messages to their clients. The following scenarios can potentially arise when institutions fail to look across all relationships to support their core lending and collections processes: 1. Customer is refused for additional credit on the facility of their choice, whilst simultaneously offered an increase in their credit line on another. 2. Customer is extended credit on a new facility whilst being seriously delinquent on another. 3. Customer receives marketing solicitation for three different products from the same institution, in the same week, through three different channels. Essentials for customer lending limits and successful cross-selling By evaluating existing customers on a periodic (monthly) basis, financial institutions can assess holistically the customer’s existing exposure, risk and affordability. By setting customer level lending limits in accordance with these parameters, core lending processes can be rendered more efficient, with superior results and enhanced customer satisfaction. This approach can be extended to consider a fast-track application process for existing relationships with high value, low risk customers. Traditionally, business processes have not identified loan applications from such individuals to provide preferential treatment. The core fundamentals of the approach necessary for the setting of holistic customer lending (umbrella) limits include: · The accurate evaluation of credit and default risk · The calculation of additional lending capacity and affordability · Appropriate product offerings for cross-sell · Operational deployment Follow my blog series over the next few months as we explore the essentials for customer lending limits and successful cross-selling.

There are two core fundamentals of evaluating loan loss performance to consider when generating organic portfolio growth through the setting of customer lending limits. Neither of which can be discussed without first considering what defines a “customer.” Definition of a customer The approach used to define a customer is critical for successful customer management and is directly correlated to how joint accounts are managed. Definitions may vary by how joint accounts are allocated and used in risk evaluation. It is important to acknowledge: Legal restrictions for data usage related to joint account holders throughout the relationship Impact on predictive model performance and reporting where there are two financially linked individuals with differently assigned exposures Complexities of multiple relationships with customers within the same household – consumer and small business Typical customer definitions used by financial services organizations: Checking account holders: This definition groups together accounts that are “fed” by the same checking account. If an individual holds two checking accounts, then she will be treated as two different and unique customers. Physical persons: Joint accounts allocated to each individual. If Mr. Jones has sole accounts and holds joint accounts with Ms. Smith who also has sole accounts, the joint accounts would be allocated to both Mr. Jones and Ms. Smith. Consistent entities: If Mr Jones has sole accounts and holds joint accounts with Ms. Smith who also has sole accounts, then 3 “customers” are defined: Jones, Jones & Smith, Smith. Financially-linked individuals: Whereas consistent entities are considered three separate customers, financially-linked individuals would be considered one customer: “Mr. Jones & Ms. Smith”. When multiple and complex relationships exist, taking a pragmatic approach to define your customers as financially-linked will lead to a better evaluation of predicted loan performance. Evaluation of credit and default risk Most financial institutions calculate a loan default probability on a periodic basis (monthly) for existing loans, in the format of either a custom behavior score or a generic risk score, supplied by a credit bureau. For new loan requests, financial institutions often calculate an application risk score, sometimes used in conjunction with a credit bureau score, often in a matrix-based decision. This approach is challenging for new credit requests where the presence and nature of the existing relationship is not factored into the decision. In most cases, customers with existing relationships are treated in an identical manner to those new applicants with no relationship – the power and value of the organization’s internal data goes overlooked whereby customer satisfaction and profits suffer as a result. One way to overcome this challenge is to use a Strength of Relationship (SOR) indicator. Strength of Relationship (SOR) indicator The Strength of Relationship (SOR) indicator is a single-digit value used to define the nature of the relationship of the customer with financial institution. Traditional approaches for the assignment of a SOR are based upon the following factors Existence of a primary banking relationship (salary deposits) Number of transactional products held (DDA, credit cards) Volume of transactions Number of loan products held Length of time with bank The SOR has a critical role in the calculation of customer level risk grades and strategies and is used to point us to the data that will be the most predictive for each customer. Typically the stronger the relationship, the more we know about our customer, and the more robust will be predictive models of consumer behavior. The more information we have on our customer, the more our models will lean towards internal data as the primary source. For weaker relationships, internal data may not be robust enough alone to be used to calculate customer level limits and there will be a greater dependency to augment internal data with external third party data (credit bureau attributes.) As such, the SOR can be used as a tool to select the type and frequency of external data purchase. Customer Risk Grade (CRG) A customer-level risk grade or behavior score is a periodic (monthly) statistical assessment of the default risk of an existing customer. This probability uses the assumption that past performance is the best possible indicator of future performance. The predictive model is calibrated to provide the probability (or odds) that an individual will incur a “default” on one or more of their accounts. The customer risk grade requires a common definition of a customer across the enterprise. This is required to establish a methodology for treating joint accounts. A unique customer reference number is assigned to those customers defined as “financially-linked individuals”. Account behavior is aggregated on a monthly basis and this information is subsequently combined with information from savings accounts and third party sources to formulate our customer view. Using historical customer information, the behavior score can accurately differentiate between good and bad credit risk individuals. The behavior score is often translated into a Customer Risk Grade (CRG). The purpose of the CRG is to simplify the behavior score for operational purposes making it easier for noncredit/ risk individuals to interpret a grade more easily than a mathematical probability. Different methods for evaluating credit risk will yield different results and an important aspect in the setting of customer exposure thresholds is the ability to perform analytical tests of different strategies in a controlled environment. In my next post, I’ll dive deeper into adaptive control, champion challenger techniques and strategy design fundamentals. Related content: White paper: Improving decisions across the Customer Life Cycle
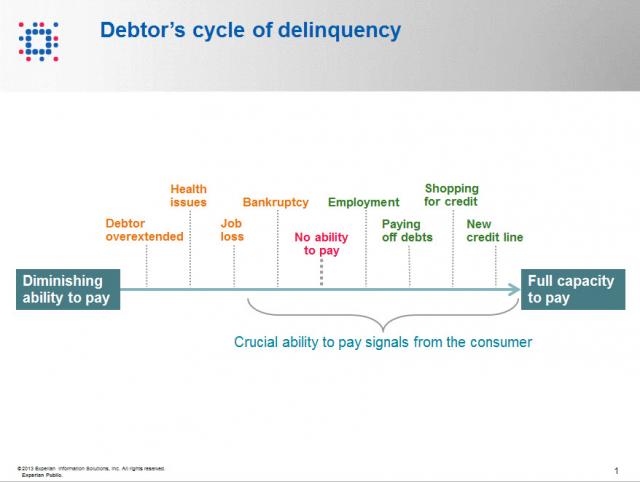
Contact information such as phone numbers and addresses are fundamental to being able to reach a debtor, but knowing when to reach out to the debtor is also a crucial factor impacting success or failure in getting payment. As referenced in the chart below, when a consumer enters the debtor life cycle, they often avoid talking with you about the debt because they do not have the ability to pay. When the debtor begins to recover financially, you want to be sure you are among the first to reach out to them so you can be the first to be paid. According to Don Taylor, President of Automated Collection Services, they have seen a lift of more than 12% of consumers with trigger hits entering repayment, and this on an aged portfolio that has already been actively worked by debt collection staff. Monitoring for a few key changes on the credit profiles of debtors provides the passive monitoring that is needed to tell you the optimal time to reach back to the consumer for payment. Experian compiled several recent collection studies and found that a debtor paying off an account that was previously past due provided a 710% increase in the average payment. Positive improvement on a consumers’ credit profile is one of those vital indicators that the consumer is beginning to recover financially and could have the will—and ability—to pay bad debts. The collection industry is not like the big warehouse stores—quantity and value do not always work hand in hand for the debt collection industry. Targeting the high value credit events that are proven to increase collection amounts is the key to value, and Experian has the expertise, analytics and data to help you collect in the most effective manner. Be sure to check out our other debt collection blog posts to learn how to recover debt more quickly and efficiently.
By: Joel Pruis Times are definitely different in the banking world today. Regulations, competition from other areas, specialized lenders, different lending methods resulting in the competitive landscape we have today. One area that is significantly different today, and for the better, is the availability of data. Data from our core accounting systems, data from our loan origination systems, data from the credit bureaus for consumer and for business. You name it, there is likely a data source that at least touches on the area if not provides full coverage. But what are we doing with all this data? How are we using it to improve our business model in the banking environment? Does it even factor into the equation when we are making tactical or strategic decisions affecting our business? Unfortunately, I see too often where business decisions are being made based upon anecdotal evidence and not considering the actual data. Let’s take, for example, Major League Baseball. How much statistics have been gathered on baseball? I remember as a boy keeping the stats while attending a Detroit Tigers game, writing down the line up, what happened when each player was up to bat, strikes, balls, hits, outs, etc. A lot of stats but were they the right stats? How did these stats correlate to whether the team won or lost, does the performance in one game translate into predictable performance of an entire season for a player or a team? Obviously one game does not determine an entire season but how often do we reference a single event as the basis for a strategic decision? How often do we make decisions based upon traditional methods without questioning why? Do we even reference traditional stats when making strategic decisions? Or do we make decisions based upon other factors as the scouts of the Oakland A’s were doing in the movie Moneyball? In one scene of the Movie, Billy Beane, general manager of the A’s, is asking his team of scouts to define the problem they are trying to solve. The responses are all very subjective in nature and only correlate to how to replace “talented” players that were lost due to contract negotiations, etc. Nowhere in this scene do any of the scouts provide any true stats for who they want to pursue to replace the players they just lost. Everything that the scouts are talking about relates to singular assessments of traits that have not been demonstrated to correlate to a team making the playoffs let alone win a single game. The scouts with all of their experience focus on the player’s swing, ability to throw, running speed, etc. At one point the scouts even talk about the appearance of the player’s girlfriends! But what if we changed how we looked at the sport of baseball? What if we modified the stats used to compile a team; determine how much to pay for an individual player? The movie Moneyball highlights this assessment of the conventional stats and their impact or correlation to a team actually winning games and more importantly the overall regular season. Bill James is given the credit in the movie for developing the methodology ultimately used by the Oakland A’s in the movie. This methodology is also referred to as Sabermetrics. In another scene, Peter Brand, explains how baseball is stuck in the old style of thinking. The traditional perspective is to buy ‘players’. In viewing baseball as buying players, the traditional baseball industry has created a model/profile of what is a successful or valuable player. Buy the right talent and then hopefully the team will win. Instead, Brand changes the buy from players to buying wins. Buying wins which require buying runs, in other words, buy enough average runs per game and you should outscore your opponent and win enough games to win your conference. But why does that mean we would have to change the way that we look at the individual players? Doesn’t a high batting average have some correlation to the number of runs scored? Don’t RBI’s (runs batted in) have some level of correlation to runs? I’m sure there is some correlation but as you start to look at the entire team or development of the line up for any give game, do these stats/metrics have the best correlation to lead to greater predictability of a win or more specifically the predictability of a winning season? Similarly, regardless of how we as bankers have made strategic decisions in the past, it is clear that we have to first figure out what it is exactly we are trying to solve, what we are trying to accomplish. We have the buzz words, the traditional responses, the non-specific high level descriptions that ultimately leave us with no specific direction. Ultimately it allows us to just continue the business as usual approach and hope for the best. In the next few upcoming blogs, we will continue to use the movie Moneyball as the back drop for how we need to stir things up, identify exactly what it is we are trying to solve and figure out how to best approach the solution.
As we prepare to attend next week’s FS-ISAC & BITS Summit we know that the financial services industry is abuzz about massive losses from the ever-evolving attack vectors including DDoS, Malware, Data Breaches, Synthetic Identities, etc. Specifically, the recent $200 million (and counting) in losses tied to a sophisticated card fraud scheme involving thousands of fraudulent applications submitted over several years using synthetic identities. While the massive scale and effectiveness of the attack seems to suggest a novel approach or gap in existing fraud prevention controls, the fact of the matter is that many of the perpetrators could have been detected at account opening, long before they had an opportunity to cause financial losses. Synthetic identities have been a headache for financial institutions for years, but only recently have criminal rings begun to exploit this attack vector at such a large scale. The greatest challenge with synthetic identities is that traditional account opening processes focus on identity verification compliance around the USA PATRIOT Act and FACT Act Red Flags guidance, risk management using credit bureau scores, and fraud detection using known fraudulent data points. A synthetic identity ring simply sidesteps those controls by using new false identities created with data that could be legitimate, have no established credit history, or slightly manipulate elements of data from individuals with excellent credit scores. The goal is to avoid detection by “blending in” with the thousands of credit card, bank account, and loan applications submitted each day where individuals do not have a credit history, where minor typos cause identity verification false positives, or where addresses and other personal data does not align with credit reports. Small business accounts are an even easier target, as third-party data sources to verify their authenticity are sparse even though the financial stakes are higher with large lines of credit, multiple signors, and complex (sometimes international) transactions. Detecting these tactics is nearly impossible in a channel where anonymity is king — and many rings have become experts on gaming the system, especially as institutions continue to migrate the bulk of their originations to the online channel and the account opening process becomes increasingly faceless. While the solutions described above play a critical role in meeting compliance and risk management objectives, they unfortunately often fall short when it comes to detecting synthetic identities. Identity verification vendors were quick to point the finger at lapses in financial institutions’ internal and third-party behavioral and transactional monitoring solutions when the recent $200 million attack hit the headlines, but these same providers’ failure to deploy device intelligence alongside traditional controls likely led to the fraudulent accounts being opened in the first place. With synthetic identities, elements of legitimate creditworthy consumers are often paired with other invalid or fictitious applicant data so fraud investigators cannot rely on simply verifying data against a credit report or public data source. In many cases, the device used to submit an application may be the only common element used to link and identify other seemingly unrelated applications. Several financial institutions have already demonstrated success at leveraging device intelligence along with a powerful risk engine and integrated link analysis tools to pinpoint these complex attacks. In fact, one example alone spanned hundreds of applications and represented millions of dollars in fraud saves at a top bank. The recent synthetic ring comprising over 7,000 false identities and 25,000 fraudulent cards may be an extreme example of the potential scope of this problem; however, the attack vector will only continue to grow until device intelligence becomes an integrated component of all online account opening decisions across the industry. Even though most institutions are satisfying Red Flags guidance, organizations failing to institute advanced account opening controls such as complex device intelligence can expect to see more attacks and will likely struggle with higher monetary losses from accounts that never should have been booked.
This post is in response to the recent Bankinter story of NFC payments at the point-of-sale without requiring SE – and the lack of any real detail around how it plans to achieve that goal. I am not privy to Bankinter’s plan to dis-intermediate the SE, but as I know a wee bit about how NFC works, I thought a post would help in clearing up any ambiguity as to how Card emulation and Host Card emulation differs, upsides, challenges – the whole lot. Back in December of 2012, Verizon responded to an FCC complaint over its continued blocking of GoogleWallet on Verizon network. The gist of Verizon’s response was that as GoogleWallet is different to PayPal, Square and other wallet aggregators in that its reliance on the phone’s Secure Element – a piece of proprietary hardware, lies behind the reason for Verizon denying GoogleWallet from operating on its devices or network. Verizon continued to write that Google is free to offer a modified version of GoogleWallet that does not require integration with the Secure Element. Now Software Card Emulation was not born out of that gridlock. It had been always supported by both NXP and Broadcom chipsets at the driver level. Among operating systems, BlackberryOS supports it by default. With Android however, application support did not manifest despite interest from the developer community. Google chose to omit exposing this capability via the API from Android 2.3.4 – may have to do with opting to focus its developer efforts elsewhere, or may have been due to carrier intervention. What very few knew is that a startup called SimplyTapp had already been toiling away at turning the switch back on – since late 2011. Host Card What? But first – let’s talk a bit about Card Emulation and how Host Card Emulation (or SE on the Cloud) differs in their approach. In the case of GoogleWallet, Card Emulation represents routing communication from an external contactless terminal reader directly to the embedded secure element, dis-allowing visibility by the operating system completely. Only the secure element and the NFC controller are involved. Card Emulation is supported by all merchant contactless terminals and in this mode, the phone appears to the reader as a contactless smart card. Google Wallet, Isis and other NFC mobile wallets rely on card emulation to transfer payment credentials to the PoS. However the downsides to this are payment apps are limited to the SE capacity (72kb on the original embedded SE on Nexus S), SE access is slower, and provisioning credentials to the SE is a complex, brittle process involving multiple TSM’s, multiple Carriers (in the case of Isis) and multiple SE types and handsets. Host Card Emulation (or Software Card Emulation) differs from this such that instead of routing communications received by the NFC controller to the secure element, it delivers them to the NFC service manager – allowing the commands to be processed by applications installed on the phone. With that, the approach allows to break dependency on the secure element by having credentials stored anywhere – in the application memory, in the trusted execution environment (TEE) or on the cloud. The benefits are apparent and a couple is noted: NFC returns to being a communication standard, enabling any wallet to use it to communicate to a PoS – without having to get mired down in contracts with Issuers, Carriers and TSMs. No more complex SE cards provisioning to worry about Multiple NFC payment wallets can be on the phone without worrying about SE storage size or compartmentalizing. No need to pay the piper – in this case, the Carrier for Over-the-air SE provisioning and lifecycle management. Card Issuers would be ecstatic. However this is no panacea, as software card emulation is not exposed to applications by Android and host card emulation patches that have been submitted (by SimplyTapp) have not yet been merged with the main android branch – and therefore not available to you and I – unless we root our phones. Which is where SimplyTapp comes in. SimplyTapp appealed to an early segment of Android enthusiasts who abhorred having been told as to what functionality they are allowed to enable on their phones – by Google, Carriers or anyone else. And to any who dared to root an NFC phone (supported by CyanogenMod) and install the Cyanogenmod firmware, they were rewarded by being able to use both SimplyTapp as well as GoogleWallet to pay via NFC – the former where credentials were stored on the cloud and the latter – within the embedded SE. So how does this work? SimplyTapp created a Host Card Emulation patch which resolves potential conflicts that could arise from having two competing applications (SimplyTapp and GW) that has registered for the same NFC event from the contactless external reader. It does so by ensuring that upon receiving the event – if the SimplyTapp app is open in the foreground (On-Screen) then the communication is routed to it and if not – it gets routed to GoogleWallet. This allows consumers to use both apps harmoniously on the same phone (take that ISIS and Google Wallet!). SimplyTapp today works on any NFC phone supported by CyanogenMod. Apart from SimplyTapp, InsideSecure is working on a similar initiative as reported here. You get a wallet! And you get a wallet! Everyone gets a wallet! Well not quite. What are the downsides to this approach? Well for one – if you wish to scale beyond the enthusiasts, you need Google, the platform owner to step up and make it available to all without having to root our phones. For that to happen it must update the NFC service manager to expose Host Card emulation for the NXP and Broadcom chipsets. And if Google is not onboard with the idea, then you need to find an OEM, a Handset manufacturer or an Amazon ready to distribute your amended libraries. Further, you can also expect Carriers to fight this move as it finds its investment and control around the secure element threatened. With the marked clout they enjoy with the OEM’s and Handset manufacturers by way of subsidies, they can influence the outcome. Some wonder how is it that BlackberryOS continues to support Host Card Emulation without Carrier intervention. The short answer may be that it is such a marginal player these days that this was overlooked or ignored. The limitations do not stop there. The process of using any cloud based credentials in an EMV or contactless transaction has not been certified yet. There is obviously interest and it probably will happen at some point – but nothing yet. Debit cards may come first – owing to the ease in certification. Further, Closed loop cards may probably be ahead of the curve compared to Open loop cards. More about that later. *Update: Latency is another issue when the credentials are stored on the cloud. Especially when NFC payments were called out last year to be not quick enough for transit.* So for all those who pine for the death of secure elements, but swear fealty to NFC, there is hope. But don’t set your alarm yet. So what will Google do? Let’s consider for a moment that Google is down with this. If so, does that represent a fork in the road for Google Wallet? Will the wallet application leverage HCE on phones with inaccessible Secure Elements, while defaulting to the Secure Element on phones it has? If so, it risks confusing consumers. Further – enabling HCE lets other wallets to adopt the same route. It will break dependency with the secure element, but so shall it open the flood gates to all other wallets who now wants to play. It would seem like a pyrrhic victory for Google. All those who despised proximity payments (I am looking at you Paypal & Square!) will see their road to contactless clear and come calling. As the platform owner – Google will have no choice but to grin and bear it. But on a positive note, this will further level the playing field for all wallets and put the case for contactless back – front and center. Will Google let this happen? Those who look at Google’s history of tight fisted control over the embedded SE are bound to cite precedent and stay cynical. But when it comes down it, I believe Google will do the right thing for the broader android community. Even on the aspect of not relinquishing control over the embedded SE in the devices it issued, Google had put the interests of consumer first. And it felt that, after all things considered it felt it was not ready to allow wanton and unfettered access to the SE. Google had at one point was even talking about allowing developers write their own “card emulation” applets and download them to the SE. Broadcom also has an upcoming quad-combo chip BCM43341 that has managed to wrap NFC, Bluetooth 4.0, Wi-Fi and FM Radio, all on a single die. Further, the BCM43341 also supports multiple Secure Elements. Now, I also hear Broadcom happens to be a major chip supplier to a fruit company. What do you think? This is content was originally posted to Cherian's personal blog at DropLabs.
Big news [last week], with Chase entering in to a 10 year expanded partnership with Visa to create a ‘differentiated experience’ for its merchants and consumers. I would warn anyone thinking “offers and deals” when they hear “differentiated experience” – because I believe we are running low on merchants who have a perennial interest in offering endless discounts to its clientele. I cringe every time someone waxes poetic about offers and deals driving mobile payment adoption – because I am yet to meet a merchant who wanted to offer a discount to everyone who shopped. There is an art and a science to discounting and merchants want to identify customers who are price sensitive and develop appropriate strategies to increase stickiness and build incremental value. It’s like everyone everywhere is throwing everything and the kitchen sink at making things stick. On one end, there is the payments worshippers, where the art of payment is the centre piece – the tap, the wave, the scan. We pore over the customer experience at the till, that if we make it easier for customers to redeem coupons, they will choose us over the swipe. But what about the majority of transactions where a coupon is not presented, where we swipe because its simply the easiest, safest and the boring thing to do. Look at the Braintree/Venmo model, where payment is but a necessary evil. Which means, the payment is pushed so far behind the curtain – that the customer spends nary a thought on her funding source of choice. Consumers are issuer agnostic to a fault – a model propounded by Square’s Wallet. Afterall, when the interaction is tokenized, when a name or an image could stand in for a piece of plastic, then what use is there for an issuer’s brand? So what are issuers doing? Those that have a processing and acquiring arm are increasingly looking at creative transaction routing strategies, in transactions where the issuer finds that it has a direct relationship with both the merchant and the consumer. This type of selective routing enables the issuer to conveniently negotiate pricing with the merchant – thereby encouraging the merchant to incent their customers to pay using the card issued by the same issuer. For this strategy to succeed, issuers need to both signup merchants directly, as well as encourage their customers to spend at these merchants using their credit and debit cards. FI’s continue to believe that they can channel customers to their chosen brands, but “transactional data doth not maketh the man” – and I continue to be underwhelmed by issuer efforts in this space. Visa ending its ban on retailer discounts for specific issuer cards this week must be viewed in context with this bit – as it fuels rumors that other issuers are looking at the private payment network option – with merchants preferring their cards over competitors explicitly. The wild wild west, indeed. This drives processors to either cut deals directly with issuers or drives them far deeper in to the merchant hands. This is where the Braintree/Venmo model can come in to play – where the merchant – aided by an innovative processor who can scale – can replicate the same model in the physical world. We have already seen what Chase Paymentech plans to do. There aren’t many that can pull off something similar. Finally, What about Affirm, the new startup by Max Levchin? I have my reservations about the viability of a Klarna type approach in the US – where there is a high level of credit card penetration among the US customers. Since Affirm will require customers to choose that as a payment option, over other funding sources – Paypal, CC and others, there has to be a compelling reason for a customer to choose Affirm. And atleast in the US, where we are card-entrenched, and everyday we make it easier for customers to use their cards (look at Braintree or Stripe) – it’s a tough value proposition for Affirm. Share your opinions below. This is a re-post from Cherian's personal blog at DropLabs.
Last January, I published an article in the Credit Union Journal covering the trend among banks to return to portfolio growth. Over the year, the desire to return to portfolio growth and maximize customer relationships continues to be a strong focus, especially in mature credit markets, such as the US and Canada. Let’s revisit this topic, and start to dive deeper into the challenges we’ve seen, explore the core fundamentals for setting customer lending limits, and share a few best practices for creating successful cross-sell lending strategies. Historically, credit unions and banks have driven portfolio growth with aggressive out-bound marketing offers designed to attract new customers and members through loan acquisitions. These offers were typically aligned to a particular product with no strategy alignment between multiple divisions within the organization. Further, when existing customers submitted a new request for credit, they were treated the same as incoming new customers with no reference to the overall value of the existing relationship. Today, however, financial institutions are looking to create more value from existing customer relationships to drive sustained portfolio growth by increasing customer retention, loyalty and wallet share. Let’s consider this idea further. By identifying the needs of existing customers and matching them to individual credit risk and affordability, effective cross-sell strategies that link the needs of the individual to risk and affordability can ensure that portfolio growth can be achieved while simultaneously increasing customer satisfaction and promoting loyalty. The need to optimize customer touch-points and provide the best possible customer experience is paramount to future performance, as measured by market share and long-term customer profitability. By also responding rapidly to changing customer credit needs, you can further build trust, increase wallet share and profitably grow your loan portfolios. In the simplest sense, the more of your products a customer uses, the less likely the customer is to leave you for the competition. With these objectives in mind, financial organizations are turning towards the practice of setting holistic, customer-level credit lending parameters. These parameters often referred to as umbrella, or customer lending, limits. The challenges Although the benefits for enhancing existing relationships are clear, there are a number of challenges that bear to mind some important questions: How do you balance the competing objectives of portfolio loan growth while managing future losses? How do you know how much your customer can afford? How do you ensure that customers have access to the products they need when they need them What is the appropriate communication method to position the offer? Few credit unions or banks have lending strategies that differentiate between new and existing customers. In the most cases, new credit requests are processed identically for both customer groups. The problem with this approach is that it fails to capture and use the power of existing customer data, which will inevitably lead to suboptimal decisions. Similarly, financial institutions frequently provide inconsistent lending messages to their clients. The following scenarios can potentially arise when institutions fail to look across all relationships to support their core lending and collections processes: Customer is refused for additional credit on the facility of their choice, whilst simultaneously offered an increase in their credit line on another. Customer is extended credit on a new facility whilst being seriously delinquent on another. Customer receives marketing solicitation for three different products from the same institution, in the same week, through three different channels. Essentials for customer lending limits and successful cross-selling By evaluating existing customers on a periodic (monthly) basis, financial institutions can holistically assess the customer’s existing exposure, risk and affordability. By setting customer level lending limits in accordance with these parameters, core lending processes can be rendered more efficient, with superior results and enhanced customer satisfaction. This approach can be extended to consider a fast-track application process for existing relationships with high value, low risk customers. Traditionally, business processes have not identified loan applications from such individuals to provide preferential treatment. The core fundamentals of the approach necessary for the setting of holistic customer lending (umbrella) limits include: The accurate evaluation of credit and default rise The calculation of additional lending capacity and affordability Appropriate product offerings for cross-sell Operational deployment Follow my blog series over the next few months as we explore the core fundamentals for setting customer lending limits, and share a few best practices for creating successful cross-sell lending strategies.
Each year, more than $1 billion is stolen from accounts at small and mid-sized banks across the U.S. and Europe. Unless the nature of the threat is recognized and addressed, this amount will only continue to grow. This week, we released of our latest webinar, Fraud Moving Downstream: Navigating Through the Rough Waters Ahead. Julie Conroy, research director at Aite Group and I team together to address this growing risk for regional and mid-sized banks, providing an overview of the current threat landscape and explain how the existing conditions are creating the perfect storm for fraudsters. Key topics discussed in this webinar include: How Regional Banks are Enhancing Online Offerings: Regional banks are responding to customer demand for more offerings, especially mobile banking options, which exposes them to new threats. The Rise in Sophisticated Fraud Attacks: Fraud rings and other new attack types (malware, man-in-the-middle, man-in-the-browser, etc.) are occurring at a higher rate than ever and pose serious threats to regional banks that lack strong, multi-layered defenses. Regional Banks’ Lack of Resources: Second and third tier banks have less manpower and less sophisticated solutions in place, which makes reviewing transactions and identifying repeat and cross-channel attacks incredibly difficult. You can access the on-demand webinar here. Also be sure to check out our infographic that illustrates this growing threat of fraud for small and mid-size banks, found here.
At midnight yesterday, Google sent me an email on how the new GoogleWallet update will now allow me to store my “Citi MasterCard” online. As other Google Wallet aficionados may recall (Bueller..? Bueller..?), Citi was the lone holdout in Google Wallet’s journey to the cloud and its race to conformity. Though to the untrained eye the Google Wallet app experience was mostly uniform irrespective of the card used to pay at the point-of-sale, behind the scenes, if the Citi MasterCard was used, Google had to do things one way versus another way for the rest of the brood. Furthermore, sharing the precious real estate that is the Secure Element with Citi meant that Google had very little room to maneuver. Embedded SEs, despite being newer to market than SIM-based SE’s, were limited in storage versus other chips. The initial embedded SEs that Google Wallet relied on had about 76KB memory, which once you factor in all the trimmings that come with provisioning a card to SE (MasterCard PayPass applet among others), left very little wiggle room. So Google, forced by a number of factors (resistance from the carriers and issuers, rising costs and complexities attributed to the multiple TSM model, a lack of SE space to accommodate future provisioning) migrated to the cloud — and left a MasterCard proxy on the wallet that it could use to funnel transactions through. The only standout to this model was the umbilical cord to the original Google Wallet partner: Citi. I had predicted last September that the partnership’s days were numbered. When the wallet is Google’s, and it needs to both reclaim the space on SE and reduce the provisioning or account management costs that it owes to its TSM (FirstData), the only reason for it to carry the torch for Citi would be if Google Wallet customers demanded it. But it so happens that any returns for items purchased using Google Wallet untill today had also been slightly broken. If you bought an item using the virtual MasterCard then the returns followed one route; of you purchased an item via the Citi card then returns were handled a different way. Additionally, It was disappointing for a customer to see “Paypass Merchant” instead of “McDonalds” and “Sent” instead of “$25.54″ when paying with the Citi card in GoogleWallet(unless one was planning to hide a fastfood habit from a spouse). A small mess – especially when it should be attributed to powers beyond the partnership, but still a mess for Google who demands conformity in customer experience across all its offerings. In the end, this partnership served no broader purpose for either partner to keep alive for any longer. Google is ready to move on beyond Wallet 1.0 and realizes that it can do so without issuers in tow. Furthermore, it had been expected for a better part of three months that Google will launch its partnership with Discover and this puts Google as an indispensable element back in the mobile payment narrative. For the issuers who were originally courted by Google Wallet in its early days this serves as validation, that they were correct in choosing to stay away. But that is no excuse for ignoring what Google and others are building as a parallel framework to the value-added services (credit card rewards being one) card issuers use to show that customers will choose them over Google. (But if Google could tout interchange relief to merchants as an incentive to court them, don’t you think a Google Rewards program will be close behind, supported by credits redeemable the Google Play store? Once again, it’s not an if, but when.) Finally, where does this leave Citi? Citi is a global institution with enough smart people at their end to make up for lost time. Google Wallet did not become the boogeyman that issuers feared back in 2011, and Citi can afford to roll out its own mobile initiatives in a measured pace at a global scale. And there had been rumblings of a Citi wallet all through 2012 and we may see it soon manifest outside of the U.S. before Citi attempts to do so here. Google may have opted to cut the cord so that there is no ambiguity when that happens. But they still have both Citi and FirstData to thank for bringing it to the prom. You dance with the one that brung ya…or something like it. Do you think this means GoogleWallet is now adrift, loyal to its own quest? What’s next for Citi? What do you think? Please leave your opinions below. This is a re-post from Cherian's personal blog at DropLabs
First, it aims to drastically reduce payment acceptance costs through any and all means and Secondly – keep merchant data firmly within their purview. MCX – MerChants reduX: The post that follows is a collection of thoughts around MCX, why it deserves respect, and yet how it is indeed mortal and bleeds like all others. For those who are not familiar with MCX – it’s a consortium of over 30 leading national retailers with a singular purpose – that is, to create a seamlessly integrated mobile commerce platform. The website for MCX is http://www.mcx.com. The consortium is led by merchants like Walmart, Target, CVS, BestBuy, Gap, Sears etc. By 2012, the mobile payments space was fragmented as it is, which itself may have precipitated the launch of MCX. And to a number of solutions looking for traction, things ground to a halt when MCX conceptualized to the merchants a solution that needed no costly upgrades and a promise to route the transaction over low cost routing options. My friends on the issuer side privately confide that MCX has infact succeeded in throwing a monkey wrench in their mobile payment plans – and merchant acceptance looks to be ambiguous around incumbent initiatives such as Isis and GoogleWallet, as well as for alternative payment initiatives. It had been easy to call it mere posturing and ignore it in the early days, but of late there is a lot of hand wringing behind the scenes and too many furrowed brows, as if the realization finally struck that merchants were indeed once again crucial to mobile payment adoption. MCX – It’s raison d’etre Meanwhile, the stakeholders behind MCX have been religious in their affirmation that MCX lives by two core tenets: First, it aims to drastically reduce payment acceptance costs through any and all means and Secondly – keep merchant data firmly within their purview. I can’t seem to think that the latter was any more than an after thought, because merchants individually can choose to decide if they wish to share customer preferences or Level III data with third parties, but they need all the collective clout they can muster to push networks and issuers to agree to reduce card acceptance costs. So if one distils MCX down to its raison d’etre, then it looks that it is aimed squarely at No.1. Which is fair when you consider that the merchants believe card fees are one of their biggest operating expenses. In 2007, 146,000 convenience stores and gas stations nationwide made a total of $3.4B in profits, yet they paid out $7.6B in card acceptance costs(Link). And MCX is smart to talk about the value of merchant data, the need to control it, yada yada yada. But if that were indeed more important, Isis could have been the partner of choice – someone who would treat customer and transaction data as sacrosanct and leave it behind for the merchants to fiddle with(vs. GoogleWallet’s mine..mine..mine.. strategy). But the same way HomeDepot was disappointed when they first saw GoogleWallet – no interchange relief, incremental benefits at the point-of-sale, and swoops all their data in return, Isis also offers little relief to MCX or its merchants, even without requiring any transaction or SKU level data in return. Does it mean that Carriers have no meaningful role to play in commerce? Au contraire. They do. But its around fraud and authentication. Its around Identity. And creating a platform for merchants to deliver coupons, alerts to opted-in customers. But they seem to be stuck imitating Google in figuring out a play at the front end of the purchase funnel, to become a consumer brand. The last thing they want to do is leave it to Apple to figure out the “Identity management” question, which the latter seems best equipped to answer by way of scale, the control it exerts in the ecosystem, its vertical integration strategy that allows it to fold in biometrics meaningfully in to its lineup, and to start with its own services to offer customer value. Did we say Apple? Its a bit early to play fast and loose with Apple predictions, but its Authentec acquisition should rear its head sometime in the near future (2013 – considering Apple’s manufacturing lead times), that a biometric solution packaged neatly with an NFC chip and secure element could address three factors that has held back customer adoption of biometrics: Ubiquity of readers, Issues around secure local storage and retrieval of biometric data, Standardization in accessing and communicating said data. An on-chip secure solution to store biometric data – in the phone’s secure element can address qualms around a central database of biometric data open to all sorts of malicious attacks. Standard methods to store and retrieve credentials stored in the SE will apply here as well. Why NFC? If NFC was originally meant to seamlessly and securely share content, what better way to sign that content, to have it be attributable to its original author, or to enforce one’s rights to said content – than to sign it with one’s digital signature. Identity is key, not just when enforcing digital rights management on shared content, but also to secure commerce and address payment/fraud risk. Back to MCX. The more I read the more it seems MCX is trying to imitate Isis in competing for the customer mindshare, in attempting to become a consumer brand – than simply trying to be a cheaper platform for payment transactions. As commerce evolved beyond being able to be cleanly classified under “Card Present” and “Card Not Present” – as transactions originate online but get fulfilled in stores, merchants expect rules to evolve alongside reality. For example, when customers are able to order online, but pick up in-store after showing a picture ID, why would merchants have to pay “Card not Present” rates when risk is what we attribute higher CNP rates to, and why is there an expectation of the same amount of risk even in this changed scenario? And beyond, as technology innovation blurs the lines that neatly categorized commerce, where we replace “Card Present” with “Mobile Present”, and mobile carry a significant amount of additional context that could be scored to address or quantify risk, why shouldn’t it be?. It’s a given that networks will have to accommodate for reduced risk in transactions where mobile plays a role, where the merchant or the platform enabling the transaction can meaningfully use that context to validate customer presence at the point-of-sale – and that they will expect appropriate interchange reduction in those scenarios. MCX – A brand like Isis or a platform? But when reading portions of the linked NRF blog, and elsewhere – it reflects a misplaced desire on MCX’s part to become a consumer facing solution – an app that all MCX partners will embrace for payment. This is so much like the Isis solution of today – that I have written about – and why it flies in the face of reason. Isis – the nexus between Carriers and FI’s – is a powerful notion, if one considers the role it could play in enabling an open platform – around provisioning, authentication and marketing. But for that future to materialize, Isis has to stop competing with Google, and must accept that it has little role to play by itself at the front end of the funnel, and must recede to its role of an enabler – one that puts its partner FI brands front and center, allows Chase’s customers to pay using Chase’s mobile app instead of Isis, and drives down the fraud risk at the point of sale by meaningfully authenticating the customer via his location and mobile assets Carriers control, and further – the historical data they have on the customer. It’s those three points of data and the scale Isis can bring, that puts them credibly in the payments value chain – not the evaporating control around the Secure Element. In the same vein, the value MCX brings to merchants – is the collective negotiating power of over 30 national merchants. But is it a new consumer brand, or is it a platform focused on routing the transaction over the least cost routing option. If its the latter, then it has a strong parallel in Paypal. And as we may see Paypal pop-up as legal tender in many a retailer’s mobile apps and checkout aisles going forward, MCX is likely to succeed by emulating that retailer aligned strategy than follow a brand of its own. Further, If MCX wants customers to pay using less costly means – whether they be private label, prepaid or ACH – then it and its partners must do everything they can to shift the customer focus away from preferred payment methods and focus on the customer experience and resulting value around loyalty. MCX must build its value proposition elsewhere, and make their preferred payment methods the bridge to get the customer there. Another example where the retailer focused too much on the payment, and less so on the customer experience is the Safeway Fast Forward program. The value proposition is clear for the customer – Pay using your Safeway Fast Forward card number and a self assigned PIN for simpler checkout. However to set up your account, the customer must provide a State issued ID (Drivers License) and on top of it – his Social Security Number(Safeway Fast Forward Requirements Here). What customer would, for the incremental convenience of paying via his Fast Forward Card and PIN, be willing to entrust Safeway with his Social Security Number? Clearly Safeway’s Risk team had a say in this and instead of coming up with better ways to answer questions around Risk and Fraud, they introduced a non-starter, which killed any opportunity for meaningful adoption. MCX & adoption So where does that leave MCX? Why will I use it? How will it address questions around adoption? It’s a given that it will have to answer the same questions around fraud and authentication during customer on-boarding or at a transactional level. Further, its not enough these days to simply answer questions pertaining to the customer. Further, one must address questions relating to the integrity and reputation of the device the customer use – whether that be a mobile device or a Laptop PC. But beyond fraud and auth, there are difficult questions around what would compel a techno-luddite who has historically paid using a credit instrument to opt for an ACH driven(i am guessing) MCX payment scheme. Well, for one: MCX and its retail partners can control the purchasing power parity of MCX credits. If they so wish, and after aggregating customer profiles across retailers, MCX determines that the Addams family spends a collective $400 on average per month between all the MCX retailers. MCX could propose that if instead, the Addams family were to commit to buy $450 in MCX credits each month, they could increase their purchasing power an additional $45 credits that could be used on specific retail categories (or flat out across all merchandise)? Would Morticia be interested? If she did, what does that mean to MCX? It eliminated having to pay interchange on approx $500, and further it enabled its partners to capture an incremental spend of 10% that did not exist before. Only merchants will be able to pull this off – by leveraging past trends, close relationships with CPG manufacturers and giving Morticia new reasons to spend in the manner they want her to. But then again, where does MCX stop in providing a level playing field for its partners, and step back – so that merchants can start to compete for their customers and their spend? And finally, can it survive the natural conflicts that will arise, and limit its scope to areas that all can agree – for long enough for it to take root? Should MCX become the next Isis or the next Paypal? Which makes most sense? What do you think? Please leave your opinions below... (This blog post is an adaptation of its original post found - http://www.droplabs.co/?p=662)
All skip tracing data is the same, right? Not exactly. While there are many sources of consumer contact data available to debt collectors, the quality, freshness, depth and breadth can vary significantly. Just as importantly, what you ultimately do or don't do with the data depends on several factors such as: Whether or not the debt is worth your while to pursue How deep and fresh the data is What if no skip data is available, and, What happens if there is no new information available when you go to your skip-tracing vendor requesting new leads? So what's the best way for your company to locate debtors? What data sources are right for you? Check out my recent article in Collections and Credit Risk for some helpful advice, and be sure to check out our other debt collection industry blog posts for best practices, tips and tricks on ways to recover more debt, faster. What data sources do you find most beneficial to your business and why? Let us know by commenting below.
Research shows that investing in superior customer management easily can exceed returns of 20 percent in the first year of implementation. A return that compounds in subsequent years as a results of customer-centric strategies that drive customer's loyalty, new customer referrals, and increased revenue opportunities. Customer loyalty is a key driver that differentiates retail banks when trying to retain existing and attract new customers. And cited by customers themselves as the way to win their business today. Achieving superior customer management, however, can be expensive and operationally prohibitive; and let's not to forget to mention there are a number of different approaches that aim to meet such a standard, but fail because critical qualitative insights are not captured in back-end systems of record (SOR). These "black-box" strategies struggle to be widely adopted across the enterprise and die a slow, internal political death - with wasted resources left on the floor. It also leaves the customer feeling frustrated and dissatisfied, maybe even ready to flee. One such example was recently illustrated in an article in Credit Union Times. Changing the retail bank's approach to adopt best practices in developing holistic customer-centric strategies is paramount to the improvement of the customer experiences, and the bottom line. Quantitative data alone can represent only a partial view of reality whereas holistic customer strategies exploit the full value of the enterprise by synthesizing customer knowledge from SOR with external off-your firm financial information and critical qualitative input from customer-facing staff. Customer-facing staff are critical in the adoption of such strategies and need to be actively engaged to extract customer learnings that will lead to the modification and alignment of customer-level treatement strategy designs and predictive models with the real world. A collaborative approach, blending art and science, ensures complete adoption across the enterprise and measurable customer experience improvements that can be monetized for shareholders through improved customer retention and new customer acquisitions. Get access to details on the framework to design and deploy such customer-centric strategies.
With the constant (and improving!) changes in the consumer credit landscape, understanding the latest trends is vital for institutions to validate current business strategies or make adjustments to shifts in the marketplace. For example, a recent article in American Banker described how a couple of housing advocates who foretold the housing crisis in 2005 are now promoting a return to subprime lending. Good story lead-in, but does it make sense for MY business? How do you profile this segment of the market and its recent performance? Are there differences by geography? What other products are attracting this risk segment that could raise concerns for meeting a new mortgage obligation? There is a proliferation of consumer loan and credit information online from various associations and organizations, but in a static format that still makes it challenging to address these types of questions. Fortunately, new web-based solutions are being made available that allow users to access and interrogate consumer trade information 24x7 and keep abreast of constantly changing market conditions. The ability to manipulate and tailor data by geography, VantageScore® credit score risk segments and institution type are just a mouse click away. More importantly, these tools allow users to customize the data to meet specific business objectives, so the next subprime lending headline is not just a story, but a real business opportunity based on objective, real-time analysis. Explore the features from one such tool available.