Automotive Lending

Lorem ipsum dolor sit amet, consectetur adipiscing elit. Phasellus at nisl nunc. Sed et nunc a erat vestibulum faucibus. Sed fermentum placerat mi aliquet vulputate. In hac habitasse platea dictumst. Maecenas ante dolor, venenatis vitae neque pulvinar, gravida gravida quam. Phasellus tempor rhoncus ante, ac viverra justo scelerisque at. Sed sollicitudin elit vitae est lobortis luctus. Mauris vel ex at metus cursus vestibulum lobortis cursus quam. Donec egestas cursus ex quis molestie. Mauris vel porttitor sapien. Curabitur tempor velit nulla, in tempor enim lacinia vitae. Sed cursus nunc nec auctor aliquam. Morbi fermentum, nisl nec pulvinar dapibus, lectus justo commodo lectus, eu interdum dolor metus et risus. Vivamus bibendum dolor tellus, ut efficitur nibh porttitor nec. Pellentesque habitant morbi tristique senectus et netus et malesuada fames ac turpis egestas. Maecenas facilisis pellentesque urna, et porta risus ornare id. Morbi augue sem, finibus quis turpis vitae, lobortis malesuada erat. Nullam vehicula rutrum urna et rutrum. Mauris convallis ac quam eget ornare. Nunc pellentesque risus dapibus nibh auctor tempor. Nulla neque tortor, feugiat in aliquet eget, tempus eget justo. Praesent vehicula aliquet tellus, ac bibendum tortor ullamcorper sit amet. Pellentesque tempus lacus eget aliquet euismod. Nam quis sapien metus. Nam eu interdum orci. Sed consequat, lectus quis interdum placerat, purus leo venenatis mi, ut ullamcorper dui lorem sit amet nunc. Donec semper suscipit quam eu blandit. Sed quis maximus metus. Nullam efficitur efficitur viverra. Curabitur egestas eu arcu in cursus. H1 asdf asdf H2 H3 H4 Lorem ipsum dolor sit amet, consectetur adipiscing elit. Vestibulum dapibus ullamcorper ex, sed congue massa. Duis at fringilla nisi. Aenean eu nibh vitae quam auctor ultrices. Donec consequat mattis viverra. Morbi sed egestas ante. Vivamus ornare nulla sapien. Integer mollis semper egestas. Cras vehicula erat eu ligula commodo vestibulum. Fusce at pulvinar urna, ut iaculis eros. Pellentesque volutpat leo non dui aliquet, sagittis auctor tellus accumsan. Curabitur nibh mauris, placerat sed pulvinar in, ullamcorper non nunc. Praesent id imperdiet lorem. H5 Curabitur id purus est. Fusce porttitor tortor ut ante volutpat egestas. Quisque imperdiet lobortis justo, ac vulputate eros imperdiet ut. Phasellus erat urna, pulvinar id turpis sit amet, aliquet dictum metus. Fusce et dapibus ipsum, at lacinia purus. Vestibulum euismod lectus quis ex porta, eget elementum elit fermentum. Sed semper convallis urna, at ultrices nibh euismod eu. Cras ultrices sem quis arcu fermentum viverra. Nullam hendrerit venenatis orci, id dictum leo elementum et. Sed mattis facilisis lectus ac laoreet. Nam a turpis mattis, egestas augue eu, faucibus ex. Integer pulvinar ut risus id auctor. Sed in mauris convallis, interdum mi non, sodales lorem. Praesent dignissim libero ligula, eu mattis nibh convallis a. Nunc pulvinar venenatis leo, ac rhoncus eros euismod sed. Quisque vulputate faucibus elit, vitae varius arcu congue et. Ut maximus felis quis diam accumsan suscipit. Etiam tellus erat, ultrices vitae molestie ut, bibendum id ipsum. Aenean eu dolor posuere, tincidunt libero vel, mattis mauris. Aliquam erat volutpat. Sed sit amet placerat nulla. Mauris diam leo, iaculis eget turpis a, condimentum laoreet ligula. Nunc in odio imperdiet, tincidunt velit in, lacinia urna. Aenean ultricies urna tempor, condimentum sem eget, aliquet sapien. Ut convallis cursus dictum. In hac habitasse platea dictumst. Ut eleifend eget erat vitae tempor. Nam tempus pulvinar dui, ac auctor augue pharetra nec. Sed magna augue, interdum a gravida ac, lacinia quis erat. Pellentesque fermentum in enim at tempor. Proin suscipit, odio ut lobortis semper, est dolor maximus elit, ac fringilla lorem ex eu mauris. Phasellus vitae elit et dui fermentum ornare. Vestibulum non odio nec nulla accumsan feugiat nec eu nibh. Cras tincidunt sem sed lacinia mollis. Vivamus augue justo, placerat vel euismod vitae, feugiat at sapien. Maecenas sed blandit dolor. Maecenas vel mauris arcu. Morbi id ligula congue, feugiat nisl nec, vulputate purus. Nunc nec aliquet tortor. Maecenas interdum lectus a hendrerit tristique. Ut sit amet feugiat velit. Test Yes asedtsdfd asdf asdf adsf Related Posts
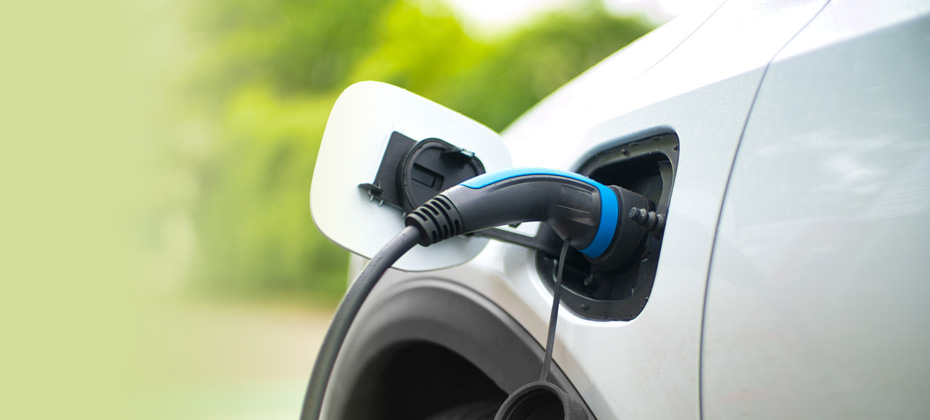
The State of the Automotive Finance Market: Q4 2021 report broke down alternative fuel financing trends—specifically how electric vehicle (EV) financing doubled year-over-year.

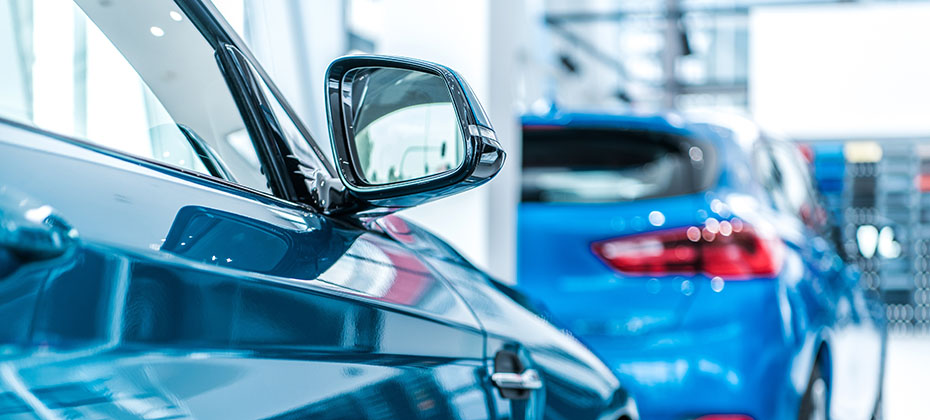
According to Experian’s State of Automotive Finance Market: Q3 2021 report, leasing comprised 24.03% of new vehicle financing in Q3 2021.

In Q3 2021, the average new vehicle loan amount increased 8.5% year-over-year, while the average used vehicle loan jumped more than 20% year-over year.

Despite used vehicle prices rising, loan-to-value (LTVs) ratios are dropping. Ultimately, lower LTVs are a positive trend for consumers because it puts them into positive equity on their vehicle faster.

The automotive finance market is beginning to level out to pre-pandemic trends in Q2 2021.

AutoCheck Buyback Protection is a policy that will compensate a consumer by buying back their vehicle under certain circumstances...

Small SUVs became the most financed vehicle segment in Q3 2020, making up 26.01% of all financed vehicles during the quarter.
According to Experian’s Q3 2020 State of the Automotive Finance Market report, 26.20% of all new vehicles are leased compared to 30.27% last year.
While things aren't quite back to normal in Q3 2020, there were a number of positive trends that demonstrates the automotive industry's resilience.
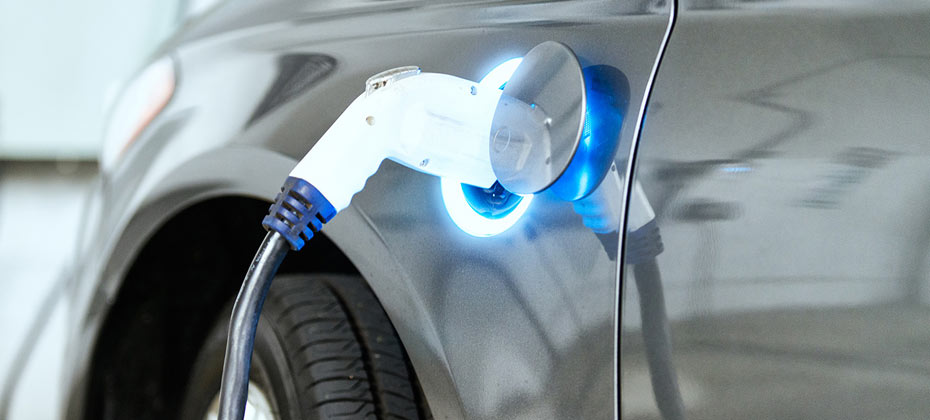
In late September, California announced a new requirement for the sale of all new passenger vehicles to be zero-emission by 2035. While that’s still 15 years away, the executive order created quite a buzz in the automotive industry, reigniting conversations about electric vehicles (EVs) and the current market penetration of the most common zero-emission vehicles. With that in mind, we wanted to take a closer look at the state of EVs—across the country and more specifically, in California—to better understand the EV market and how it’s grown over the past few years. As of Q2 2020, electric vehicles comprised just 0.312% of vehicles in operation (VIO). While EV market share seems small, there has been significant growth since Q2 2015, when they only held 0.0678% of the VIO market—meaning the growth of EVs has more than tripled (3.6x) in the last five years. But even still, other segments, such as CUVs have seen faster growth in the same time period (10% market share in Q2 2020 compared to 6.2% in Q2 2015). California sees faster EV adoption California has seen growth in EV adoption in the last decade, but it has grown exponentially in the last five years. EVs comprised 1.79% of new vehicle registrations 2015, and the percentage grew to 5.32% as of Q2 2020. Much of the growth occurred between 2017 and 2018, when market share jumped from 2.62% to 5.04% year-over-year, with the introduction of the more cost-effective Tesla Model 3. Even with that growth, California new vehicle purchases have a long way to grow to move up to 100% EV. With the popularity of the Model 3, it’s somewhat unsurprising, Tesla holds the lion’s share of the EV market in California, making up 61.9% of EVs on the road within VIO, and nationally at 64.8% share. That could potentially change down the road though. Over the next two years, numerous manufacturers have plans to introduce electric versions of popular models or introduce new EV models altogether. This not only creates competition but could also help continue to drive down vehicle cost, making EVs a more viable option for consumers. Examining costs and other factors Cost is one of the key considerations that industry experts have routinely brought up over the years as a barrier to EV adoption. While some say that maintenance and fuel are cheaper in the long run, purchasing an EV today is typically a more expensive option at the dealership. The average loan amount for an EV in California in 2019 was $40,964, compared to an average vehicle loan amount of $32,373. That said, as EV adoption has seen exponential growth in the last five years, the average price has reduced. The average loan amount for an EV in 2016 was $78,646, dropping more than $35,000 in just five years as the technology continued to mature and vehicle costs lowered. Additionally, tax incentives, particularly in California, have also helped reduce affordability concerns. Though today’s tax incentives may not be in place through 2035, California will likely need to evaluate if economic incentives are required along the way to achieving the zero-emission vehicle deadline. However, even as costs lower, there are additional challenges to be overcome. For instance, infrastructure continues to be a barrier to adoption. In a 2019 AAA study, concern over being able to find a place to charge is the top reason listed as to why respondents are unlikely to purchase an EV in the future. In addition, according to Statisa, in March 2020, the U.S. had almost 25,000 charging stations for plug-in electric vehicles, and approximately 78,500 charging outlets. Of those charging stations, nearly 30% are in California. But with continued growth of EV sales, there will be a critical need for continued infrastructure nationwide—not just in California. In addition to these considerations, many impacts of the new mandate remain unknown. California will have to navigate increased electricity demand—especially during peak hours—and increases in battery scrappage, as EVs wear out. Gas stations will need to manage a loss of revenue, while changes in fuel taxes are likely, and vehicle technicians will require new training. If increased adoption of zero emission vehicles is California’s long-term goal, this could also impact the popularity of used vehicles, which could leave dealers looking for alternative locations to sell their gasoline-powered inventory. Looking toward the future of EVs Realistically, with 15 years until the mandate takes effect, the California mandate won’t have much of an immediate effect on the industry. But it does highlight key considerations for automakers and the aftermarket moving forward. To achieve better adoption rates, automakers need to understand the barriers to success and how they impact consumer behavior. An example of this is how California has seen higher EV adoption rates as the availability of plug-in stations has increased. Continuing to find ways to lower costs and focusing on savings over the lifetime of the vehicle is will help consumers see the value of an EV. At the end of the day, automakers play a large role in moving the country toward EV adoption, so having a clear understanding of the trends can help refine strategies as we move toward an electrified future.

While the automotive industry initially took a hit at the onset of COVID-19, things are beginning to rebound. New vehicle registrations are still down compared to 2019, however, the year-over-year comparisons by month are starting to level out. And, while most of the attention has been paid to new registration figures, we can’t lose sight of the vehicles on the road. Some consumers acted to take advantage of automaker incentives and low interest rates, and others purchased due to newfound needs, but the vast majority have stuck with their current vehicle. That means, despite some bumps over the past few months, opportunity for the aftermarket and dealer service departments to thrive by keeping these vehicles on the road still exists. It starts with understanding what’s on the road. Insight into these vehicles will better position aftermarket suppliers and repairs shops to perform scheduled maintenance and address the needs of drivers. According to Experian’s Q2 2020 Market Trends Review, there were 280.6 million vehicles in operation, up from 278.1 million a year ago. Of those vehicles on the road, light-duty trucks accounted for 56.5%, and passenger cars made up the remaining 43.5%. So, there’s little surprise that the top three segments on the road were full-sized pick-ups (16%), CUVs (10%) and mid-range cars (9.9%). And if we break it down even further, the top three brands were Ford (15.5%), Chevrolet (14.3%) and Toyota (12.1%). But we understand that not all 280.6 million vehicles will need aftermarket parts or service; it’s important for the industry to keep a close eye on the aftermarket “sweet spot”—those vehicles that are six- to 12-years old. Identifying these vehicles and anticipating their maintenance needs will help aftermarket suppliers navigate the recovery. In Q2 2020, 31.2% (87.6 million) of vehicles in operation fell within the “sweet spot”—with a mix nearly 46% domestic and 54% import brands. And while the opportunity today is significant, we expect the “sweet spot” to continue to grow for at least the next four years. To make the most of the opportunity, aftermarket suppliers need to understand where these vehicles are located, what types of vehicles fall within the sweet spot and the most common parts that are used. COVID-19 has shifted the industry for all parties involved. Some consumers may opt to hold onto their vehicles a little bit longer rather than purchase a vehicle; only time will tell. In any event, the more aftermarket suppliers and repair shops understand about the vehicles on the road, the better positioned they will be to address the needs of consumers and grow business. To view Experian’s full Q2 2020 Market Trends Review, click here.

Consumers are taking advantage of new car incentives, low interest rates and longer-term loans in order to ensure that their vehicle purchase is manageable.
Staying ahead of the trends and adjusting will support sales growth, while also supporting consumers as they begin to recover from the impact of COVID-19.

As subprime originations decrease, some think that subprime consumers are being locked out of the automotive finance market, but that’s not the whole story.