Credit Lending

Experian’s Chris Ryan and Bobbie Paul recently re-joined David Mattei from Aite to discuss how emerging fraud trends and changes in consumer behavior will have long-term impacts on businesses. Chris, Bobbie, and David have combined experience of more than 60 years in the world of fraud prevention. In this discussion, they bring that experience to bear as they review how businesses should revise their long-term fraud strategy in response to COVID-19 and the subsequent economic shifts, including: The requirements to authenticate a digital customer Businesses’ technology challenges Differentiating between first party and third party fraud The importance of businesses’ technology investment How to build a roadmap for the next 90 days and beyond Experian · Make Your Fraud Plan Recession-Ready: Your 90 Day and Beyond Plan

Every few months we hear in the news about a fraud ring that has been busted here in the U.S. or in another part of the world. In May, I read about a fraud ring based in Georgia and Louisiana that bought 13,000 stolen identities of children who were on the Louisiana Medicaid program and billed the government for services not rendered. This group defrauded the Medicaid program of more than $500,000. This is just one of many stories that we hear about fraud rings, and given the rapidly changing economic environment, now is the time for businesses to think about how to protect against fraud rings. There are a number of challenges that organizations may have when it comes to sharing trends and collaborations, understanding the ways to tie fraud rings together, creating treatments for identifying fraud rings and ways to store and catalogue fraud ring experiences so they can be easily recognized. The trouble with identifying fraud rings It’s important to understand the challenges that organizations have because they see the fraud rings through their own internal lens. Here are a few of the top things businesses should work on: Think like a fraudster. This will help businesses become more creative in their approach to fraud prevention. Facilitate internal collaboration. Share with in-organization partners. Sometimes this can be difficult due to organizational structure. Promote external collaboration. Intel-sharing groups are a great way for businesses to network within their industries and learn about the fraud that others are seeing. An organization that I’ve worked with in the past is the National Cyber Forensic and Training Alliance (NCFTA). Putting the pieces together How do businesses identify a fraud ring? There are three steps to get started. The first is reviewing and understanding the data. Fraudsters are lazy and want to replicate the process over and over again, and because of this there is always some piece of information that is repeated. It could be a name, an email address, device fingerprint, or similar. The second step is tying the fraud ring together. This is done by creating rules to help identify the trends. Having rules in place to identify fraud rings allows businesses to easily pull stats together for their leadership. Lastly, applying an acronym or name to the particular fraud ring and adding comments to the cases associated with a particular ring will help with post-investigation analysis. Learning from the past Before I became a consultant, I remember identifying a fraud ring that was submitting events with the same language pack and where the device fingerprint was staying consistent. Those events were being referred out for review and marked with the same note. At a post-mortem review, I was able to talk to the fraud ring we had seen, and it was easy to pull all events associated with this fraud ring because my team had marked the events with the same comments. Another fraud ring example happened a few years ago. A client called me and said that they were under a fraud attack and this fraud ring was rotating the email handle. I reviewed the data and came up with a rule to catch this activity. Fraud rings will use email handle rotation to help them keep track of accounts that are opened or what emails they used in the past. By coupling the email handle rotation with an email verification service like Emailage, this insight could be very telling. I would assume that when fraud rings use email handle rotation these emails are new and have just been created. These are just a few of the many fraud rings that I’ve encountered over the course of my career and I’m sure there will be a lot more in the years to come. The best advice I can give to anyone that reads this post is to understand the data that you are reviewing, look for anomalies within the data, ask questions and test your theories by running queries on the data that you’re reviewing. I would love to hear about the different fraud rings that you’ve encountered over your career. Stay safe. Contact us

Experian’s own Chris Ryan and Bobbie Paul recently joined David Mattei from Aite to discuss the latest research and insights into emerging fraud schemes and how businesses can combat them in light of COVID-19 and the resulting economic changes. Between them, Chris, Bobbie, and David have more than 60 years of experience in the world of fraud prevention. Listen in as they discuss how businesses can shape their fraud prevention plan in the short term, including: The impacts of the health crisis and physical distancing The rise of e-commerce and consumer digital engagement Changes in criminal activity Fraud attack vectors 2020 fraud loss projections Critical next steps for the 30-60 day time frame Experian · Make Your Fraud Plan Recession-Ready: 2020 Fraud Trends
To combat the growing threat of synthetic identity fraud, Experian recently announced the launch of Sure ProfileTM, a revolutionary change to the credit profile that gives lenders peace of mind with Experian’s commitment to share in losses that result from an identity we’ve assured. “Experian has always been a leader in combatting fraud, and with Sure Profile, we’re proud to deliver an industry-first fraud offering integrated into the credit profile that mitigates lender losses while protecting millions of consumers’ identities,” said Robert Boxberger, President of Decision Analytics, Experian North America. Synthetic identity fraud is expected to drive $48 billion in annual online payment fraud losses by 2023. Between opportunistic fraudsters and a lack of a unified definition for synthetic identity theft it can be nearly impossible to detect—and therefore prevent—this type of fraud. This breakthrough solution provides a composite history of a consumer’s identification, public record, and credit information and determines the risk of synthetic fraud associated with that consumer. It’s not just a fraud tool, it’s a comprehensive credit profile that utilizes premium data so lenders can make positive credit decisions. Sure Profile leverages the capabilities of the Experian Ascend Identity PlatformTM and uses Experian’s industry-leading data assets and data quality to drive advanced analytics that set a higher level of protection for lenders. It’s powered by newly-developed machine learning and AI models. And it offers a streamlined approach to define and detect synthetic identities early in the originations process. Most importantly, Sure Profile differentiates between real people and potentially risky applicants so lenders can increase application approvals with greater assurance and less risk. “Experian can confidently define and help detect synthetic fraud. That's why we can help stop it,” said Craig Boundy, CEO of Experian North America. “Experian stands behind our data with assurance given to our clients. It’s better for lenders and it’s better for consumers.” Sure Profile is a complement to our robust set of identity protection and fraud management capabilities, which are designed to address fraud and identity challenges including account openings, account takeovers, e-commerce fraud and more. This first-of-its kind profile is the future of underwriting and portfolio protection and it’s here now. Read press release Learn More About Sure Profile
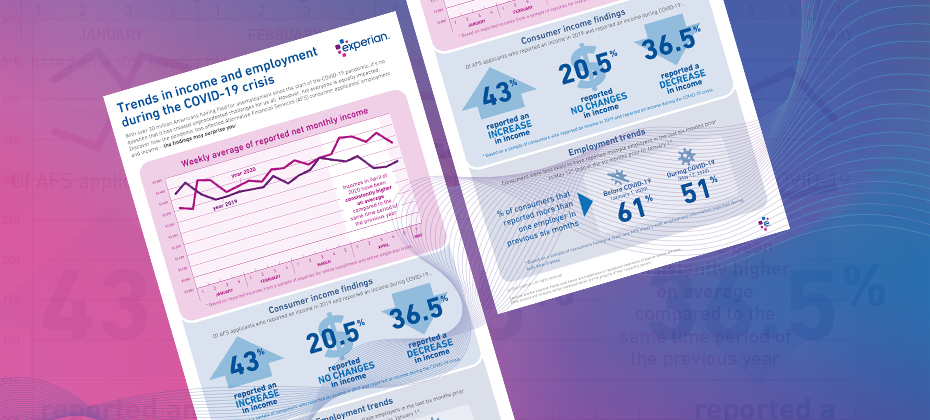
With many individuals finding themselves in increasingly vulnerable positions due to COVID-19, lenders must refine their policies based on their consumers’ current financial situations. Alternative Financial Services (AFS) data helps you gain a more comprehensive view of today's consumer. The COVID-19 pandemic has had far-reaching economic consequences, leading to drastic changes in consumers’ financial habits and behavior. When it comes to your consumers, are you seeing the full picture? See if you qualify for a complimentary hit rate analysis Download AFS Trends Report

The largest industry disruptor was a surprise to everyone. Where bets may have been placed on digital transformation, automated decisioning, or better omnichannel programs, no one foresaw the global pandemic of COVID-19 and the corresponding economic fall out that ensued. As financial institutions have spent the past two months scattered and then regrouping, whether with pivoted downturn contingency strategies or with a business-focused Hail Mary, some might argue that the dust is beginning to settle. While the world and the majority of businesses are working to manage and stabilize a new normal against a background of some form of chaos, once federal and state regulations are loosened, the world – and financial institutions in particular – will need a plan forward. So, what comes after COVID-19? With stimulus checks and what everyone hopes will soon be a re-stimulating of the economy, consumers will seek credit. And when that influx comes, there will be a need to strategize what is the right offer for the right consumer. How do you take on more customers while minimizing risk? Non-existent and/or shrinking budgets Many marketing budgets were already small prior to the global pandemic, so coming out of it, to say every marketing dollar counts is an understatement. Traditional prescreen, while a pillar in acquisition operations, is an antiquated strategy. Using hyper-segmentation via a true end-to-end marketing service, pumped up by the right data for decision making, enables financial institutions to not only build the right audience but tailor quality experiences that increase engagement and loyalty. That means ultimately reducing operating costs while improving experiences and take rates. Work from home turned life from home Going virtual has gone viral. Seemingly overnight, most brick and mortar operations went online. Some versions of digital transformation became a need to have, versus a nice to have, and the gap between the financial institutions who were equipped to pivot online, versus those who were not, spread further. As the vast majority of consumers are at home – whether by way of work from home or furlough – our society has quickly embraced everything being online. Reach your consumers where they are, in the digital-first channels to which they have become familiar with and accustomed. As consumers are at the center of every marketing strategy, engaging omnichannel delivery enhances reach across critical touchpoints. Inclusive of social media, email, direct mail, TV, and more, the campaign should provide a seamless experience, all working together in a synchronized fashion. Consistency has always been key, but especially during these volatile times, to reflect stability, empathy and constant messaging is an undertone that can only help strengthen consumers’ view of your organization. Learn fast, grow faster For marketing financial products, it’s a matter of connecting the dots between consumer touchpoints and results data. By making these critical connections, financial institutions will be better positioned to identify the most effective elements in the campaign. By gleaning more insights from campaign performance, organizations can optimize future campaigns and minimize wasted ad spend. These key learnings, delivered at the end of every campaign cycle, help your organization to remain nimble, pivot quickly and execute campaigns that get increasingly better ROI as you hone in on the nuances revealed by data on consumer behavior, preferences, motivations and more. Changing times and even faster-changing needs There’s always been a need for faster decisioning and more results with increasingly fewer resources. The need for speed has been put on hyperdrive as the economy has entered the current environment. How do you keep up with the changing needs of your consumers? Get your marketing right from the start and see results through to the end. Incorporating the right data, advanced analytics and constant access ultimately enable more strategic focus and shorter campaign cycles. As we all navigate the ever-changing “normal,” offering the right support to your consumers is the right thing to do for them and for you. Managing rising consumer needs, while also minimizing risk to your bottom line, is also the right thing to do for your business. Once plans move from managing business operations through the crisis to moving forward, make sure your marketing – how you are reaching out to existing customers and prospective customers for the next steps in their financial journey – is data-driven. To learn more about how Experian can help you execute data-driven marketing that fuels customer acquisition, visit our website. Learn More

This is the third in a series of blog posts highlighting optimization, artificial intelligence, predictive analytics, and decisioning for lending operations in times of extreme uncertainty. The first post dealt with optimization under uncertainty and the second with predicting consumer payment behavior. In this post I will discuss how well credit scores will work for consumer lenders during and after the COVID-19 crisis and offer some recommendations for what lenders can be doing to measure and manage that model risk in a time like this. Perhaps no analytics innovation has created opportunity for more individuals than the credit score has. The first commercially available credit score was developed by MDS (now part of Experian) in 1987. Soon afterwards FICO® popularized the use of scores that evaluate the risk that a consumer would default on a loan. Prior to that, lending decisions were made by loan officers largely on the basis on their personal familiarity with credit applicants. Using data and analytics to assess risk not only created economic opportunity for millions of borrowers, but it also greatly improved the financial soundness of lending institutions worldwide. Predictive models such as credit scores have become the most critical tools for consumer lending businesses. They determine, among other things, who gets a loan and at what price and how an account such as a credit line is managed through its life cycle. Predictive models are in many cases critical for calculating loan and loss reserves, for stress testing, and for complying with accounting standards. Nearly all lenders rely on generic scores such as the FICO® score and VantageScore® credit score. Most larger companies also have a portfolio of custom scorecards that better predict particular aspects of payment behavior for the customers of interest. So how well are these scorecards likely to perform during and after the current pandemic? The models need to predict consumer credit risk even as: Nearly all consumers change their behaviors in response to the health crisis, Millions of people—in America and internationally—find their income suddenly reduced, and Consumers receive large numbers of accommodations from creditors, who have in turn temporarily changed some of their credit reporting practices in response to guidelines in the federal CARES Act. In an earlier post, I pointed out that there is good reason to believe that credit scores will tend to continue to rank order consumers from most likely to least likely to repay their debts even as we move from the longest economic expansion in history to a period of unforeseen and unexpected challenges. But the interpretation of the score (for example, the log odds or the bad rate) may need to be adjusted. Furthermore, that assumes that the model was working well on a lender’s population before this crisis started. If it has been a long time since a scorecard was validated, that assumption needs to be questioned. Because experts are considering several different scenarios regarding both the immediate and long-term economic impacts of COVID-19, it’s important to have a plan for ongoing monitoring as long as necessary. Some lenders have strong Model Risk Management (MRM) teams complying with requirements from the Federal Reserve, Federal Deposit Insurance Corporation (FDIC), the Office of the Comptroller of the Currency (OCC). Those resources are now stretched thin. Other institutions, with fewer resources for MRM, are now discovering gaps in their model inventories as they implement operational changes. In either case, now’s the time to reassess how well scorecards are working. Good model validation practices are especially critical now if lenders are to continue to make the sound data-driven decisions that promote fairness for consumers and financial soundness for the institution. If you’re a credit risk manager responsible for the generic or custom models driving your lending, servicing, or capital allocation policies, there are several things you can do--starting now--to be sure that your organization can continue to make fair and sound lending decisions throughout this volatile period: Assess your model inventory. Do you have good documentation showing when each of the models in your organization was built? When was it last validated? Assign a level of criticality to each model in use. Starting with your most critical models, perform a baseline validation to determine how the model was performing prior to the global health crisis. It may be prudent to conduct not only your routine validation (verifying that the model was continuing to perform at the beginning of the period) but also a baseline validation with a shortened performance window (such as 6-12 months). That baseline validation will be useful if the downturn becomes a protracted one—in which case your scorecard models should be validated more frequently than usual. A shorter outcome window will allow a timelier assessment of the relationship between the score and the bad rate—which will help you update your lending and servicing policies to prevent losses. Determine if any of your scorecards had deteriorated even before the global pandemic. Consider recalibrating or rebuilding those scorecards. (Use metrics such as the Population Stability Index, the K-S statistic and the Gini Coefficient to help with that decision.) Many lenders chose not to prioritize rebuilding their behavioral scorecards for account management or collections during the longest period of economic growth in memory. Those models may soon be among the most critical models in your organization as you work to maintain the trust of your accountholders while also maintaining your institution’s financial soundness. Once the CARES accommodation period has expired, it will be important to revalidate your models more frequently than in the past—for as long as it takes until consumer behavior normalizes and the economy finds its footing. When you find it appropriate to rebuild a scorecard model, consider whether now is the time to implement ethical and explainable AI. Some of our clients are finding that Machine Learned models are more predictive than traditional scorecards. Early Experian research using data from the last recession indicates this will continue to be true for the foreseeable future. Furthermore, Experian has invested in Research and Development to help these clients deliver FCRA-compliant Adverse Action reasons to their consumers and to make the models explainable and transparent for model risk governance and compliance purposes. The sudden economic volatility that has resulted from this global health crisis has been a shock to all organizations. It is important for lenders to take the pulse of their predictive models now and throughout the downturn. They are especially critical tools for making sound data-driven business decisions until the economy is less volatile. Experian is committed to helping your organization during times of uncertainty. For more resources, visit our Look Ahead 2020 Hub. Learn more

The economic impact of the COVID-19 health crisis is ever-evolving and requires great flexibility and planning from lenders. Shannon Lois, Experian’s Senior Vice President, Analytics, Consulting and Operations, discusses what lenders can expect and next steps to take. Q: Though COVID-19 is catalyzing a sharp economic slowdown, many experts expect it to be temporary and liken it more to a global natural disaster than the prior financial crisis. What are your reactions? SL: There is still debate as to whether we will have a U-shaped or a V-shaped recession and its probable severity and longevity. Regardless, we are in a recession caused by a health pandemic with uncertainty of what it will mean for our global economy and without a clear view as to when it will end. The sooner we can contain the virus the more it will help to curtail the size of the recession. The unemployment rates and the consumer lack of confidence in the future will continue to contract spending which in turn will continue to propagate the recession. Our ability to limit COVID-19 over the coming months will have a direct impact in the economy, although the effects will probably linger on for six or more months. Q: From an economic perspective, what are the current trends we’re seeing? SL: Unemployment has skyrocketed and every business sector has been impacted although with different degrees of severity. In particular, tourism/hospitality, airlines, automotive, consumer products and retail have suffered. Consumers’ financial status varies and will continue to fluctuate, and credit conditions tighten while welfare payments increase. The government programs that have started will help, but they’re not enough to counter a prolonged recession. As some states seek to reopen and others extend their shelter in place orders, we will continue to see economic changes, with different sectors bouncing back or dipping further depending on their geographic location. Q: How does the economic slowdown compare to what we may have expected previously? SL: This recession is different than anything we have encountered previously not only because of the health concerns and implication of our population but because of the uncertainty of it all. As an example, social distancing has significantly and immediately impacted consumer demand but overall it is their low confidence in the future that will cause a continuous drop in discretionary and non-discretionary spending. Not only do we have challenges on the demand side, we also are seeing the same on the supply side with no automotive manufacturing occurring in the USA, and international oil flooding the market causing negative impact on domestic oil and the broad energy market. Q: How do the unemployment and liquidity challenges come into play? SL: The unemployment rate has already jumped to a record high. Most consumers are facing liquidity and affordability challenges and businesses do not have enough cash reserves to sustain them. Consumer activity has shifted drastically across all channels while lenders are exercising more caution. If this is a V-shaped recession (and hopefully it will be), then most activity is bound to spring back quickly in Q3. With companies safeguarding some jobs and the help of governments’ supplemental programs, businesses will restore supply and consumer demand will get a kick start. Q: What is the smartest next play for financial institutions? SL: The path forward requires several steps. First, understand your customers, existing and new. Refine your policies with the right information around your customers’ financial situations and extend programs (forbearance and loan payment forgiveness) as needed under the right guidelines. It’s also important to use refreshed data to lend to consumers and businesses who need it now more than ever, with the proper policies and fraud checks in place. Finally, increase your agility to operate effectively and dynamically with automation, interactive communication and self-serving digital tools. Experian is committed to helping lenders throughout these uncertain times. For more resources, visit our Look Ahead 2020 Resource Hub. Learn more About Our Expert Shannon Lois, Senior Vice President, Analytics, Consulting and Operations, Decision Analytics Shannon and her team of analysts, scientists, credit, fraud and marketing risk management experts provide results-driven consulting services and state-of-the-art advanced analytics, science and data products to clients in a wide range of businesses, including banking, auto, credit, utility, marketing and finance. Prior to her current role, she founded the Advisory Services practice at Experian, driving to actionable and proven solutions for our clients’ most pressing business problems.

The current pandemic will affect the way financial institutions lend and provide credit. Shawn Rife, Experian’s Director of Product Scoring, discusses the ways that financial institutions can navigate the COVID-19 crisis. Check out what he had to say: What implications does the global pandemic have on financial institutions’ analytical needs? SR: In the customer lifecycle, there are 4 different stages: prospecting, acquisitions, portfolio management, and collections. During times of economic uncertainty, lenders typically take additional actions to ensure that there’s a first line of defense against delinquencies and payment stress. Expanding their focus to incorporate account review/portfolio management becomes particularly important. During this time, clients will be looking for leadership, early warning signs, and ways to recession-proof their portfolios (account management), while growing and maintaining their approvals in a healthy way (originations). Lenders may be well advised to delay any focus on collections, since many consumers may be facing major payment stress through no mismanagement of their own doing. Another critical component is with the rollout of government stimulus packages, which lenders can use to identify people in stress who could benefit for second chance opportunities they may not have otherwise been able to receive. As more consumers seek credit, from an analytics perspective, what considerations should financial institutions be making during this time? SR: Financial institutions should be assessing and pre-identifying situations that might place consumers in positions of elevated financial stress. That way, organizations can implement solutions to identify and help at-risk consumers before they fall delinquent. The recent Coronavirus Aid, Relief, and Economic Security Act (CARES Act) – coupled with Experian’s score treatment, are designed to protect consumers against score declines during times of crisis. Furthermore, lenders can provide forbearance and loan deferment programs to help consumers. For lenders, credit risk scores, models, and attributes are the best ways to identify – and even predict - delinquency risk. The FICO® Resilience Index can also identify consumers who are particularly susceptible to delinquency risk directly due to macroeconomic uncertainty. This gives lenders the opportunity to evaluate their portfolios for loss and connect with consumers who may be in need of further support. What is the smartest next play for financial institutions? SR: For financial institutions, the smart play is to add alternative data into their data-driven decisioning strategies as much as possible. Alternative data works to enhance your ability to see a consumer’s entire credit portfolio, which gives lenders the confidence to continue to lend – as well as the ability to track and monitor a consumer’s historical performance (which is a good indicator of whether or not a consumer has both the intention and ability to repay a loan). How will the new attribute subset list benefit financial institutions during this time? SR: Experian’s series of crisis attributes is an example of attributes that can be predictive in times of a crisis. These lists were designed to follow the 3 E’s – Expand, Enhance, and provide Ease of use. Enhance – With these attributes, lenders aren’t limited to traditional data. These attributes allow lenders to look at the entirety of a consumer’s credit or repayment behavior and use more data to make better lending decisions. This becomes crucial in a challenging environment. Expand – This data can also help lenders identify consumers who are in the market for products and services, even if there the lending criteria becomes more stringent. This can open doors and new opportunities for 40-50 million new customers, particularly ones that may not fit initial lending criteria. Ease of Use – Experian has put together the most predictive elements that can identify consumer resilience and potential financial stress in this challenging economy. Experian is committed to helping your organization during times of uncertainty. For more resources, visit our Look Ahead 2020 Hub. Learn more Shawn M. Rife, Director of Risk Scoring, Experian Consumer Information Services, North America Shawn Rife manages Experian’s credit risk scoring models, focused on empowering clients to maximize the scope and influence of their lending universe - while minimizing risk - and complying with ever-changing regulatory standards. Shawn also leads the implementation of Alternative Data within the lending environment, as well as key product implementation initiatives. Prior to Experian, Shawn held key consumer insights and predictive analytics roles for Consumer Packaged Goods and internet companies. Over his career, Shawn has focused on market segmentation, competitive research, new product development and consumer advocacy. He also holds a Master’s degree from Harvard University and a Bachelor’s degree in Political Science and Economics.

When running a credit report on a new applicant, you must ensure Fair Credit Reporting Act (FCRA) compliance before accessing, using and sharing the collected data. The Coronavirus Aid, Relief, and Economic Security (CARES) Act has impacted credit reporting under the FCRA, as has new guidance from the Consumer Financial Protection Bureau (CFPB). Recent updates include: The CARES Act amended the FCRA to require furnishers who agree to an “accommodation,”1 to report the account as current, although it is permitted to continue to report the account as delinquent if the account was delinquent before the accommodation was made. Although not legally obligated, data furnishers should continue furnishing information to the credit reporting agencies (CRAs) during the COVID-19 crisis, and make sure that information reported is complete and accurate. Below is a brief FCRA-related compliance overview2 covering various FCRA requirements3 when requesting and using consumer credit reports for an extension of credit permissible purpose. For more information regarding your responsibilities under the FCRA as a user of consumer reports, please consult your Legal Counsel and the Notice to Users of Consumer Reports: Obligations of Users Under the FCRA handbook located on our website. Before obtaining a consumer report you have… Reviewed your federal and state regulations and laws related to consumer reports, scores, decisions, etc. Made sure you have a valid permissible purpose for pulling the consumer report. Certified compliance to the CRA from which you are getting the consumer report. You have certified that you complied with all the federal and state requirements. After you take an adverse action based on a consumer report you… Provide the consumer with an oral, written or electronic notice of the adverse action. Provide written or electronic disclosure of the numerical credit score used to take the adverse action, or when providing a “risk-based pricing” notice. Provide the consumer with an oral, written or electronic notice, which includes the below information: Name, address and telephone number of CRA that supplied the report, if nationwide. A statement that the CRA did not make the adverse decision and therefore can’t explain why the decision was made. Notice of the consumer’s right to a free copy of their report from the CRA, if requested within 60 days. Notice of the consumer’s right to dispute with the CRA the accuracy or completeness of any information in a consumer report provided by the CRA. Provide the consumer with a “risk-based pricing” notice if credit was granted but on less favorable terms based on information in their consumer report. We understand how challenging it is to understand and meet all your obligations as a data furnisher – we’re here to make it a little easier. Click below to speak with a representative and gain more insight on how the CARES Act impacts FCRA reporting. Download overview Speak with a representative 1An “accommodation” is defined as “an agreement to defer one or more payments, make a partial payment, forbear any delinquent amounts, modify a loan or contract, or any other assistance or relief” granted to a consumer affected by COVID-19 during the covered period. 2This FCRA overview is not legal guidance and does not enumerate all your requirements under the FCRA as a user of consumer reports. Additionally, this FCRA Overview is not intended to provide legal advice or counsel you regarding your obligations under the FCRA or any other federal or state law or regulation. Should you have any questions about your institution’s specific obligations under the FCRA or any other federal or state law or regulation, you should consult with your Legal Counsel. 3This FCRA overview is intended to be used solely by financial service providers when extending credit to consumers and does not include all FCRA regulatory obligations. You are responsible for regulatory compliance when requesting and using consumer reports, which includes adhering to all applicable federal and state statutes and regulations and ensuring that you have the correct policies and procedures in place.

This week, Experian released a new version of our CrossCore® digital identity and fraud risk platform, adding new tools and functionality to help businesses quickly respond to today’s emerging fraud threats. The ability to confidently recognize your customers and safeguard their digital transactions is becoming an increasing challenge for businesses. Fraud threats are already rising across the globe as fraudsters take advantage of the global health crisis and rapidly shifting economic conditions. CrossCore combines risk-based authentication, identity proofing and fraud detection into a single cloud platform, which means businesses can more quickly respond to an ever-changing environment. And with flexible decisioning orchestration and advanced analytics, businesses can make real-time risk decisions throughout the customer lifecycle. “Now more than ever, businesses need to lean on capabilities and technology that will allow them to rapidly respond in these challenging times, increase identity confidence in every transaction, and provide a safe and convenient experience for customers,” said E.K. Koh, Experian’s Senior Vice President of Global Identity & Fraud Solutions in a recent press release. “This new CrossCore release enables businesses to easily leverage best-in-class, pre-integrated identity and fraud services through simple self-service.” This new version of CrossCore features a cloud architecture, modern user interface, progressive risk assessments, faster response times, self-service workflow configuration, and a transactional volume reporting dashboard. These enhancements give you a simpler way to manage how backing applications are utilized, allow you to analyze key performance indicators in near real-time, and empower you to catch more fraud faster - without impacting the customer experience. “Recent Aite Group research shows that many banks have seen digital channel usage increase 250% in the wake of the pandemic, so ensuring a seamless and safe customer experience is more important than ever,” said Julie Conroy, Research Director at Aite Group. “Platforms such as CrossCore that can enable businesses to nimbly respond to changing patterns of customer behavior as well as rapidly evolving attack tactics are more important than ever, as financial services firms work to balance fraud mitigation with the customer experience.” CrossCore is the first identity and fraud platform that enables you to connect, access, and orchestrate decisions across multiple solutions. With the newest version, Experian enhances your ability to consolidate numerous fraud risk signals into a single, holistic assessment to improve operational processes, stay ahead of fraudsters, and protect your customers. Read Press Release Learn More About CrossCore

Last week, the unemployment rate soared past 20%, with over 30 million job losses attributed to the COVID-19 pandemic. As a result, many consumers are facing financial stress, which has raised many questions and discussions around how credit history and reporting should be treated at this time. Since the initial start of the pandemic, credit reporting companies and data furnishers have been put under the spotlight to ensure that consumers are able to get the assistance that they need. Numerous questions and concerns have also been raised around the extent of which consumers have access to fair and affordable credit. On March 27th, 2020, Congress signed the Coronavirus Aid, Relief, and Economic Security (CARES) Act into law, which was a bill created to provide support and relief for American workers, families, and small businesses. This newly proposed Act also provides guidelines on how creditors and data furnishers should report information to credit bureaus, to ensure that lenders remain flexible as consumers navigate the current pandemic. The Act requires that creditors must provide “accommodations” to consumers affected by COVID-19 during “covered periods.” According to the National Credit Union Administration, “The CARES Act requires credit reporting agency data providers, including credit unions, to report loan modifications resulting from the COVID-19 pandemic as ‘current’ or as the status reported before the accommodation unless the consumer becomes current,” as stated in Section 4021. Section 4021 of the CARES Act also provides other guidelines for accurate data reporting. During this time, lenders can use attributes to determine risk during COVID-19. Attributes within custom scores can also capture consumer behavior and help lenders determine the best treatments. Payment attributes, debt burden attributes, inquiry attributes, credit extensions and originations are all key indicators to keep an eye on at this time as lenders monitor risk in their portfolios. Listen in as our panel of experts explore the areas related to data reporting that impact you the most. In addition to a regulatory update and discussions around programs to help support consumers and businesses, we’ll also review what other lenders are doing and early indicators of credit trends. You’ll also be able to walk away with key strategies around what your organization can do right now. Discover the latest information on: Data reporting and CDIA regulations Regulatory updates, including the CARES Act, a breakdown of Section 4021, and guidelines to remember Credit attribute trends and highlights, treatment of scores and attributes, as well as recommended attributes Watch the webinar

Today’s lending market has seen a significant increase in alternative business lending, with companies utilizing new data assets and technology. As the lending landscape becomes increasingly competitive, consumers have more choices than ever when it comes to lending products. To drive profitable growth, lenders must find new ways to help applicants gain access to the loans they need. How Spring EQ is leveraging Experian BoostTM Home equity lender Spring EQ turned to Experian’s first-of-its-kind financial tool that empowers consumers to add positive payments directly into their credit file to assist applicants with attaining the best loan opportunities and rates. By using Experian BoostTM, which captures the value of consumer’s utility and telecom trade lines, in their current lending process, Spring EQ can help applicants near approval or risk thresholds move to higher risk tiers and qualify for better loan terms and conditions. Driving growth with consumer-permissioned data Over 40 million consumers in the U.S. either have no credit file or have insufficient information in their files to generate a traditional credit score. Consumer-permissioned data empowers these individuals to leverage their online financial data and payment histories to gain better access to loans and other financial services while providing lenders with a more comprehensive view of their creditworthiness. According to Experian research, 70% of consumers see the benefits of sharing additional financial information and contributing positive payment history to their credit file if it increases their odds of approval and helps them access more favorable credit terms. Read our case study for more insight on using Experian Boost to: Make better lending decisions Offer or underwrite credit to more people Promote the right credit products Increase conversion and utilization rates Read case study Learn more about Experian Boost

This is the next article in our series about how to handle the economic downturn – this time focusing on how to prevent fraud in the new economic environment. We tapped two new experts—Chris Ryan, Market Lead, Fraud and Identity and Tischa Agnessi, Go-to-Market Lead, Decisioning Software—to share their thoughts on how to keep fraud out of your portfolio while continuing to lend. Q: What new fraud trends do you expect during the economic downturn? CR: Perhaps unsurprisingly, we tend to see high volumes of fraud during economic downturn periods. First, we anticipate an uptick in third-party fraud, specifically account takeover or ATO. It’ll be driven by the need for first-time users to be forced online. In particular, the less tech-savvy crowd is vulnerable to phishing attacks, social engineering schemes, using out-of-date software, or landing on a spoofed page. Resources to investigate these types of fraud are already strained as more and more requests come through the top of the funnel to approve new accounts. In fact, according to Javelin Strategy & Research’s 2020 Identity Fraud Study, account takeover fraud and scams will increase at a time when consumers are feeling financial stress from the global health and economic crisis. It is too early to predict how much higher the fraud rates will go; however, criminals become more active during times of economic hardships. We also expect that first party fraud (including synthetic identity fraud) will trend upwards as a result of the deliberate abuse of credit extensions and additional financing options offered by financial services companies. Forced to rely on credit for everyday expenses, some legitimate borrowers may take out loans without any intention of repaying them – which will impact businesses’ bottom lines. Additionally, some individuals may opportunistically look to escape personal credit issues that arise during an economic downturn. The line between behaviors of stressed consumers and fraudsters will blur, making it more difficult to tell who is a criminal and who is an otherwise good consumer that is dealing with financial pressure. Businesses should anticipate an increase in synthetic identity fraud from opportunistic fraudsters looking to take advantage initial financing offers and the cushions offered to consumers as part of the stimulus package. These criminals will use the economic upset as a way to disguise the fact that they’re building up funds before busting out. Q: With payment stress on the rise for consumers, how can lenders manage credit risk and prevent fraud? TA: Businesses wrestle daily with problems created by the coronavirus pandemic and are proactively reaching out to consumers and other businesses with fresh ideas on initial credit relief, and federal credit aid. These efforts are just a start – now is the time to put your recession readiness plan and digital transformation strategies into place and find solutions that will help your organization and your customers beyond immediate needs. The faceless consumer is no longer a fraction of the volume of how organizations interact with their customers, it is now part of the new normal. Businesses need to seek out top-of-line fraud and identity solutions help protect themselves as they are forced to manage higher digital traffic volumes and address the tough questions around: How to identify and authenticate faceless consumers and their devices How to best prevent an overwhelming number of fraud tactics, including first party fraud, account takeover, synthetic identity, bust out, and more. As time passes and the economic crisis evolves, we will all adapt to yet another new normal. Organizations should be data-driven in their approach to this rapidly changing credit crisis and leverage modern technology to identify financially stressed consumers with early-warning indicators, predict future customer behavior, and respond quickly to change as they deliver the best treatment at the right time based on customer-specific activities. Whether it’s preparing portfolio risk assessment, reviewing debt management, collections, and recovery processes, or ramping up your fraud and identity verification services, Experian can help your organization prepare for another new normal. Experian is continuing to monitor the updates around the coronavirus outbreak and its widespread impact on both consumers and businesses. We will continue to share industry-leading insights to help financial institutions differentiate legitimate consumers from fraudsters and protect their business and customers. Learn more About Our Experts [avatar user="ChrisRyan" /] Chris Ryan, Market Lead, Fraud and Identity Chris has over 20 years of experience in fraud prevention and uses this knowledge to identify the most critical fraud issues facing individuals and businesses in North America, and he guides Experian’s application of technology to mitigate fraud risk. [avatar user="tischa.agnessi" /] Tischa Agnessi, Go-to-Market Lead, Decisioning Software Tischa joined Experian in June of 2018 and is responsible for the go to market strategy for North America’s decisioning software solutions. Her responsibilities include delivering compelling propositions that are unique and aligned to markets, market problems, and buyer and user personas. She is also responsible for use cases that span the PowerCurve® software suite as well as application platforms, such as Decisioning as a ServiceSM and Experian®One.

The coronavirus (COVID-19) outbreak is causing widespread concern and economic hardship for consumers and businesses across the globe – including financial institutions, who have had to refine their lending and downturn response strategies while keeping up with compliance regulations and market changes. As part of our recently launched Q&A perspective series, Shannon Lois, Experian’s Head of DA Analytics and Consulting and Bryan Collins, Senior Product Manager, tackled some of the tough questions for lenders. Here’s what they had to say: Q: What trends and triggers should lenders be prepared to react to? BC: Lenders are still trying to figure out how to assess risk between the broader, longer-term impacts of the pandemic and the near-term Coronavirus Aid, Relief, and Economic Security (CARES) Act that extends relief funds and deferment to consumers and small businesses. Traditional lending processes are not possible, lenders will have to adjust underwriting strategies and workflows as they deploy hardship programs while complying with the Act. From a utilization perspective, lenders need to look for near-term trends on payments, balances and skipped payments. From an extension standpoint, they should review limits extended or reduced by other lenders. Critical trends to look for would be missed or late auto payments, non-traditional credit shopping and rental payment delinquencies. Q: What should lenders be doing to plan for an uptick in delinquencies? SL: First, lenders should make sure they have a complete picture of how credit risk and losses are evolving, as well as any changes to their consumers’ affordability status. This will allow a pointed refinement of their customer management strategies (I.e. payment holidays, changing customer to cheaper product, offering additional services, re-pricing, term amendment and forbearance management.) Second, given the increased stress on collection processes and regulations guidelines, they should ensure proper and prepared staffing to handle increased call volumes and that agency outsourcing and automation is enabled. Additionally, lenders should migrate to self-service and interactive communication channels whenever possible while adopting new segmentation schemas/scores/attributes based on fresh data triggers to queue lower risk accounts entering collections. Q: How can lenders best help their customers? SL: Lenders should understand customers’ profiles with vulnerability and affordability metrics allowing changes in both treatment and payment. Payment Holidays are common in credit card management, consider offering payment freezes on different types of credit like mortgage and secured loans, as well as short term workout programs with lower interest rates and fee suppression. Additionally, lenders should offer self-service and FAQ portals with information about programs that can help customers in times of need. BC: Lenders can help by complying with aspects of the CARES Act guidance; they must understand how to deploy payment relief and hardship programs effectively and efficiently. Data integrity and accuracy of loan reporting will be critical. Financial institutions should adjust their collection and risk strategies and processes. Additionally, lenders must determine a way to address the unbanked population with relief checks. We understand how challenging it is to navigate the changing economic tides and will continue to offer support to both businesses and consumers alike. Our advanced data and analytics can help you refine your lending processes and better understand regulatory changes. Learn more About Our Experts: Shannon Lois, Head of DA Analytics and Consulting, Experian Data Analytics, North America Shannon and her team of analysts, scientists, credit, fraud and marketing risk management experts provide results-driven consulting services and state-of-the-art advanced analytics, science and data products to clients in a wide range of businesses, including banking, auto, credit, utility, marketing and finance. Shannon has been a presenter at many credit scoring and risk management conferences and is currently leading the Experian Decision Analytics advisory board. Bryan Collins, Senior Product Manager, Experian Consumer Information Services, North America Bryan is a member of Experian's CIS product management team, focusing on the Acquisitions suite and our evolving Ascend Identity Services Platform. With more than 20 years of experience in the financial services and credit industries, Bryan has established strong partnerships and a thorough understanding of client needs. He was instrumental in the launch of CIS's segmentation suite and led product management for lender and credit-related initiatives in Auto. Prior to joining Experian, Bryan held marketing and consumer experience roles in consumer finance, business lending and card services.