Debt & Collections

School’s out, and graduation brings excitement, anticipation and bills. Oh, boy, here come the student loans. Are graduates ready for the bills? Even before they have a job lined up? With lots of attention from the media, I was interested in analyzing student loan debt to see if this is a true issue or just a headline grab. There’s no shortage of headlines alluding to a student loan crisis: “How student loans are crushing millennial entrepreneurialism” “Student loan debt in 2017: A $1.3 trillion crisis” “Why the student loan crisis is even worse than people think” Certainly sounds like a crisis. However, I’m a data guy, so let’s look at the data. Pulling from our data, I analyzed student loan trades for the last four years starting with outstanding debt — which grew 21 percent since 2013 to reach a high of $1.49 trillion in the fourth quarter of 2016. I then drilled down and looked at just student loan trades. Created with Highstock 5.0.7Total Number of Student Loans TradesStudent Loan Total TradesNumber of trades in millions174,961,380174,961,380182,125,450182,125,450184,229,650184,229,650181,228,130181,228,130Q4 2013Q4 2014Q4 2015Q4 2016025M50M75M100M125M150M175M200MSource: Experian (function(){ function include(script, next) {var sc=document.createElement("script");sc.src = script;sc.type="text/javascript";sc.onload=function() {if (++next < incl.length) include(incl[next], next);};document.head.appendChild(sc);}function each(a, fn){if (typeof a.forEach !== "undefined"){a.forEach(fn);}else{for (var i = 0; i < a.length; i++){if (fn) {fn(a[i]);}}}}var inc = {},incl=[]; each(document.querySelectorAll("script"), function(t) {inc[t.src.substr(0, t.src.indexOf("?"))] = 1;});each(Object.keys({"https://code.highcharts.com/stock/highstock.js":1,"https://code.highcharts.com/adapters/standalone-framework.js":1,"https://code.highcharts.com/highcharts-more.js":1,"https://code.highcharts.com/highcharts-3d.js":1,"https://code.highcharts.com/modules/data.js":1,"https://code.highcharts.com/modules/exporting.js":1,"http://code.highcharts.com/modules/funnel.js":1,"http://code.highcharts.com/modules/solid-gauge.js":1}),function (k){if (!inc[k]) {incl.push(k)}});if (incl.length > 0) { include(incl[0], 0); } function cl() {if(typeof window["Highcharts"] !== "undefined"){new Highcharts.Chart("highcharts-79eb8e0a-4aa9-404c-bc5f-7da876c38b0f", {"chart":{"type":"column","inverted":true,"polar":false,"style":{"fontFamily":"Arial","color":"#333","fontSize":"12px","fontWeight":"normal","fontStyle":"normal"}},"plotOptions":{"series":{"dataLabels":{"enabled":true},"animation":true}},"title":{"text":"Student Loan Total Trades","style":{"fontFamily":"Arial","color":"#333333","fontSize":"18px","fontWeight":"bold","fontStyle":"normal","fill":"#333333","width":"792px"}},"subtitle":{"text":"","style":{"fontFamily":"Arial","color":"#666666","fontSize":"16px","fontWeight":"normal","fontStyle":"normal","fill":"#666666","width":"792px"}},"exporting":{},"yAxis":[{"title":{"text":"Number of trades in millions","style":{"fontFamily":"Arial","color":"#666666","fontSize":"16px","fontWeight":"normal","fontStyle":"normal"}},"labels":{"format":""},"type":"linear"}],"xAxis":[{"title":{"style":{"fontFamily":"Arial","color":"#666666","fontSize":"16px","fontWeight":"normal","fontStyle":"normal"},"text":""},"reversed":true,"labels":{"format":"{value:}"},"type":"linear"}],"series":[{"data":[["Total Student Loans",174961380]],"name":"Q4 2013","turboThreshold":0,"_colorIndex":0,"_symbolIndex":0},{"data":[["Total Student Loans",182125450]],"name":"Q4 2014","turboThreshold":0,"_colorIndex":1,"_symbolIndex":1},{"data":[["Total Student Loans",184229650]],"name":"Q4 2015","turboThreshold":0,"_colorIndex":2,"_symbolIndex":2},{"data":[["Total Student Loans",181228130]],"name":"Q4 2016","turboThreshold":0,"_colorIndex":3,"_symbolIndex":3}],"colors":["#26478d","#406eb3","#632678","#982881"],"legend":{"itemStyle":{"fontFamily":"Arial","color":"#333333","fontSize":"12px","fontWeight":"normal","fontStyle":"normal","cursor":"pointer"},"itemHiddenStyle":{"fontFamily":"Arial","color":"#cccccc","fontSize":"18px","fontWeight":"normal","fontStyle":"normal"},"layout":"horizontal","floating":false,"verticalAlign":"bottom","x":0,"align":"center","y":0},"credits":{"text":"Source: Experian"}});}else window.setTimeout(cl, 20);}cl();})(); Over the past four years, student loan trades grew 4 percent, but saw a slight decline between 2015 and 2016. The number of trades isn’t growing as fast as the amount of money that people need. The average balance per trade grew 17 percent to $8,210. Either people are not saving enough for college or the price of school is outpacing the amount people are saving. I shifted the data and looked at the individual consumer rather than the trade level. Created with Highstock 5.0.7Student Loan Average Balance per Trade4.044.043.933.933.893.893.853.85Q4 2013Q4 2014Q4 2015Q4 201600.511.522.533.544.5Source: Experian (function(){ function include(script, next) {var sc=document.createElement("script");sc.src = script;sc.type="text/javascript";sc.onload=function() {if (++next < incl.length) include(incl[next], next);};document.head.appendChild(sc);}function each(a, fn){if (typeof a.forEach !== "undefined"){a.forEach(fn);}else{for (var i = 0; i < a.length; i++){if (fn) {fn(a[i]);}}}}var inc = {},incl=[]; each(document.querySelectorAll("script"), function(t) {inc[t.src.substr(0, t.src.indexOf("?"))] = 1;});each(Object.keys({"https://code.highcharts.com/stock/highstock.js":1,"https://code.highcharts.com/adapters/standalone-framework.js":1,"https://code.highcharts.com/highcharts-more.js":1,"https://code.highcharts.com/highcharts-3d.js":1,"https://code.highcharts.com/modules/data.js":1,"https://code.highcharts.com/modules/exporting.js":1,"http://code.highcharts.com/modules/funnel.js":1,"http://code.highcharts.com/modules/solid-gauge.js":1}),function (k){if (!inc[k]) {incl.push(k)}});if (incl.length > 0) { include(incl[0], 0); } function cl() {if(typeof window["Highcharts"] !== "undefined"){new Highcharts.Chart("highcharts-66c10c16-1925-40d2-918f-51214e2150cf", {"chart":{"type":"column","polar":false,"style":{"fontFamily":"Arial","color":"#333","fontSize":"12px","fontWeight":"normal","fontStyle":"normal"},"inverted":true},"plotOptions":{"series":{"dataLabels":{"enabled":true},"animation":true}},"title":{"text":"Student Loan Average Number of Trades per Consumer","style":{"fontFamily":"Arial","color":"#333333","fontSize":"18px","fontWeight":"bold","fontStyle":"normal","fill":"#333333","width":"356px"}},"subtitle":{"text":"","style":{"fontFamily":"Arial","color":"#666666","fontSize":"16px","fontWeight":"normal","fontStyle":"normal","fill":"#666666","width":"356px"}},"exporting":{},"yAxis":[{"title":{"text":"","style":{"fontFamily":"Arial","color":"#666666","fontSize":"14px","fontWeight":"normal","fontStyle":"normal"}},"type":"linear","labels":{"format":"{value}"}}],"xAxis":[{"title":{"style":{"fontFamily":"Arial","color":"#666666","fontSize":"14px","fontWeight":"normal","fontStyle":"normal"}},"type":"linear","labels":{"format":"{}"}}],"colors":["#26478d","#406eb3","#632678","#982881","#ba2f7d"],"series":[{"data":[["Average Trades per Consumer",4.04]],"name":"Q4 2013","turboThreshold":0,"_colorIndex":0},{"data":[["Average Trade per Consumer",3.93]],"name":"Q4 2014","turboThreshold":0,"_colorIndex":1},{"data":[["Average Trade per Consumer",3.89]],"name":"Q4 2015","turboThreshold":0,"_colorIndex":2},{"data":[["Average Trades per Consumer",3.85]],"name":"Q4 2016","turboThreshold":0,"_colorIndex":3}],"legend":{"floating":false,"itemStyle":{"fontFamily":"Arial","color":"#333333","fontSize":"12px","fontWeight":"bold","fontStyle":"normal","cursor":"pointer"},"itemHiddenStyle":{"fontFamily":"Arial","color":"#cccccc","fontSize":"18px","fontWeight":"normal","fontStyle":"normal"},"layout":"horizontal"},"credits":{"text":"Source: Experian"}});}else window.setTimeout(cl, 20);}cl();})(); The number of overall student loan trades per consumer is down to 3.85, a decrease of 5 percent over the last four years. This is explained by an increase in loan consolidations as well as the better planning by students so that they don’t have to take more student loans in the same year. Lastly, I looked at the average balance per consumer. This is the amount that consumers, on average, owe for their student loan trades. Created with Highstock 5.0.7Balance in thousands ($)Quarterly $USD Debt per ConsumerQ4 Student Loan TrendsAverage Student Loan Debt Balance per Consumer27,93427,93429,22629,22630,52330,52332,06132,061Q4 2013Q4 2014Q4 2015Q4 201605,00010,00015,00020,00025,00030,00035,000Source: Experian (function(){ function include(script, next) {var sc=document.createElement("script");sc.src = script;sc.type="text/javascript";sc.onload=function() {if (++next < incl.length) include(incl[next], next);};document.head.appendChild(sc);}function each(a, fn){if (typeof a.forEach !== "undefined"){a.forEach(fn);}else{for (var i = 0; i < a.length; i++){if (fn) {fn(a[i]);}}}}var inc = {},incl=[]; each(document.querySelectorAll("script"), function(t) {inc[t.src.substr(0, t.src.indexOf("?"))] = 1;});each(Object.keys({"https://code.highcharts.com/stock/highstock.js":1,"https://code.highcharts.com/adapters/standalone-framework.js":1,"https://code.highcharts.com/highcharts-more.js":1,"https://code.highcharts.com/highcharts-3d.js":1,"https://code.highcharts.com/modules/data.js":1,"https://code.highcharts.com/modules/exporting.js":1,"http://code.highcharts.com/modules/funnel.js":1,"http://code.highcharts.com/modules/solid-gauge.js":1}),function (k){if (!inc[k]) {incl.push(k)}});if (incl.length > 0) { include(incl[0], 0); } function cl() {if(typeof window["Highcharts"] !== "undefined"){Highcharts.setOptions({lang:{"thousandsSep":","}});new Highcharts.Chart("highcharts-0b893a55-8019-4f1a-9ae1-70962e668355", {"chart":{"type":"column","inverted":true,"polar":false,"style":{"fontFamily":"Arial","color":"#333","fontSize":"12px","fontWeight":"normal","fontStyle":"normal"}},"plotOptions":{"series":{"dataLabels":{"enabled":true},"animation":true}},"title":{"text":"Average Student Loan Balance per Consumer","style":{"fontFamily":"Arial","color":"#333333","fontSize":"18px","fontWeight":"bold","fontStyle":"normal","fill":"#333333","width":"308px"}},"subtitle":{"text":"","style":{"fontFamily":"Arial","color":"#666666","fontSize":"16px","fontWeight":"normal","fontStyle":"normal","fill":"#666666","width":"792px"}},"exporting":{},"yAxis":[{"title":{"text":"Balance numbers are in thousands ($)","style":{"fontFamily":"Arial","color":"#666666","fontSize":"16px","fontWeight":"normal","fontStyle":"normal"}},"labels":{"format":"{value:,1f}"},"reversed":false}],"xAxis":[{"title":{"style":{"fontFamily":"Arial","color":"#666666","fontSize":"16px","fontWeight":"normal","fontStyle":"normal"},"text":"Balance in thousands ($)"},"labels":{"format":"{value:}"},"type":"linear","reversed":true,"opposite":false}],"series":[{"data":[["Average Balance per Consumer",27934]],"name":"Q4 2013","turboThreshold":0,"_colorIndex":0},{"data":[["Average Balance per Consumer",29226]],"name":"Q4 2014","turboThreshold":0,"_colorIndex":1},{"data":[["Average Balance per Consumer",30523]],"name":"Q4 2015","turboThreshold":0,"_colorIndex":2},{"data":[["Average Balance per Consumer",32061]],"name":"Q4 2016","turboThreshold":0,"_colorIndex":3}],"colors":["#26478d","#406eb3","#632678","#982881"],"legend":{"itemStyle":{"fontFamily":"Arial","color":"#333333","fontSize":"12px","fontWeight":"bold","fontStyle":"normal","cursor":"pointer"},"itemHiddenStyle":{"fontFamily":"Arial","color":"#cccccc","fontSize":"18px","fontWeight":"normal","fontStyle":"normal"}},"lang":{"thousandsSep":","},"credits":{"text":"Source: Experian"}});}else window.setTimeout(cl, 20);}cl();})(); Here we see a growth of 15 percent over the last four years. At the end of 2016, the average person with a student loan balance had just over $32,000 outstanding. While this is a large increase, we should compare it with other purchases: This balance is no more than a person purchasing a brand-new car without a down payment. While we’re seeing an increase in overall outstanding debt and individual loan balances, I’m not yet agreeing that this is the crisis the media portrays. If students are educated about the debt that they’re taking out and making sure that they’re able to repay it, the student loan market is performing as it should. It’s our job to help educate students and their families about making good financial decisions. These discussions need to be had before debt is taken out, so it’s not a shock to the student upon graduation.

Experian’s ID Fraud Tracker, a quarterly analysis of fraud rates across consumer financial products, found that British families who are struggling financially — about 4 million people — are increasingly becoming prime targets of financial fraud. The research performed on data from 2014 to 2016 in the United Kingdom also revealed: There has been a 203% increase in the total number of fraudulent credit applications over the past two years. Current account, credit card and loan fraud were the most common types of credit products fraudsters applied for in other people’s names, making up 94% of the total. 35% of all third-party fraud came from households with high salaries and large disposable incomes. Fraud’s increasing around the world. We all have a responsibility to be vigilant and take measures to protect our business and customers, online and offline. Protect your customers >

In just a few short hours, Vision attendees immersed themselves into the depths of the economy, risk models, specialty finance data, credit invisibles, student loan data, online marketplace lending and more. The morning kicked off with one of the most respected and trusted macroeconomists in the U.S., Diane Swonk. With a rap sheet filled with advising central banks and multinational companies, Swonk treated a packed house to a look back on what has transpired in the U.S. economy since the Great Recession, as well as launching into current state and speculating on the months ahead. She described the past decade not as “lost, but rather lagging.” She went onto to say this past year was transitional, and while markets slowed slightly during the months leading up the U.S. presidential election, good things are happening: We’ve finally broken out of the 2% wage rut Recruiting on college campuses has picked up The labor force is growing Debt-to-income levels have returned to where they were prerecession and Investment is coming back. “I believe we’ll see growth over 2% this year,” said Swonk. Still, change is underway. She commented on how the way U.S. consumer spending is changing, and of course we’re seeing a restructuring in the retail space. While JC Penney announces store closings, you simultaneously see Amazon moving from “click to brick,” dabbling in the opening of some actual storefronts. Globally, she said the economy is the strongest it has been in eight years. She closed by noting there is a great deal of political change and unrest in the world today, but says, “Never underestimate our abilities when we tap our human capital.” -- More than 100 attendees filled a room to hear about the current trends and the future of online lending with featured guests from Oliver Wyman, Marlette Funding and Lending USA. While speakers commented on the “hiccup” in the space last year with some layoffs and mergers, volume has continued to double every year for the past several years with roughly $40 billion in cumulative originations today. Panelists discussed the use of alternative data to decision, channel bias, the importance of partnerships and how the market will see fewer and fewer players offering just one product specialty. “It is expensive to acquire customers, so you don’t just want to have one product to sell, but rather a range,” said Sharat Shankar of Lending USA. -- The numbers in the student lending universe are astounding. In a session focused on the U.S. student loan market, new Experian data reveals there is $1.49 billion in total student loan outstandings. In fact, total outstandings have grown 21% over the past four years, while the number of trades have only grown 4%. Costs are skyrocketing. The average balance per trade has grown 17% over the past four years. “We don’t ration education in this country,” said Joe DePaulo of College Ave. Student Loans. “We give everyone access to liquidity when it comes to federal student loans – and it’s not like that in other countries.” While DePaulo notes the access is great, offering many students the opportunity to obtain higher education, he says the problem is with disclosures. Guardians are often the individuals filling out the FAFSA, but the students inherit the loans. Students, he says, rarely understand how much their monthly payment will ultimately be after graduation. For every $10,000 in student loans, he says that will generally equate to a $100 monthly payment. -- Tomorrow, Vision attendees will be treated to more breakout sessions and a concluding keynote with legendary quarterback Tom Brady.

During our recent webinar, Detect and Prevent: The current state of e-commerce fraud, Julie Conroy, Aite Group research director, shared 5 key trends relating to online fraud: Rising account takeover fraud. Targeting of loyalty points. Growing global transactions. Frustrating false declines. Increasingly mobile consumers. Fraud is increasing. Be prepared. Protect your business and customers with a multilayered approach to fraud prevention. For more trends and predictions, watch the webinar recording.
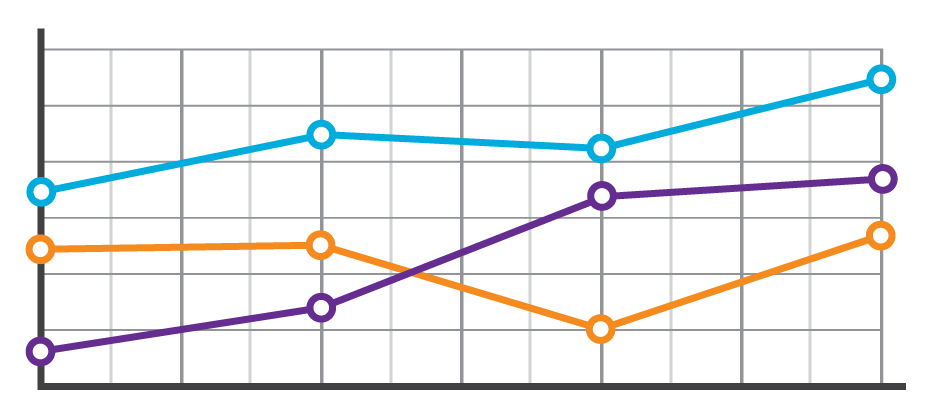
Sometimes life throws you a curve ball. The unexpected medical bill. The catastrophic car repair. The busted home appliance. It happens, and the killer is that consumers don’t always have the savings or resources to cover an additional cost. They must make a choice. Which bills do they pay? Which bills go to the pile? Suddenly, a consumer’s steady payment behavior changes, and in some cases they lose control of their ability to fulfill their obligations altogether. These shifts in payment patterns aren’t always reflected in consumer credit scores. At a single point in time, consumers may look identical. However, when analyzing their past payment behaviors, differences emerge. With these insights, lenders can now determine the appropriate risk or marketing decisions. In the example below, we see that based on the trade-level data, Consumer A and Consumer B have the same credit score and balance. But once we see their payment pattern within their trended data, we can clearly see Consumer A is paying well over the minimum payments due and has a demonstrated ability to pay. A closer look at Consumer B, on the other hand, reveals that the payment amount as compared to the minimum payment amount is decreasing over time. In fact, over the last three months only the minimum payment has been made. So while Consumer B may be well within the portfolio risk tolerance, they are trending down. This could indicate payment stress. With this knowledge, the lender could decide to hold off on offering Consumer B any new products until an improvement is seen in their payment pattern. Alternatively, Consumer A may be ripe for a new product offering. In another example, three consumers may appear identical when looking at their credit score and average monthly balance. But when you look at the trend of their historical bankcard balances as compared to their payments, you start to see very different behaviors. Consumer A is carrying their balances and only making the minimum payments. Consumer B is a hybrid of revolving and transacting, and Consumer C is paying off their balances each month. When we look at the total annual payments and their average percent of balance paid, we can see the biggest differences emerge. Having this deeper level of insight can assist lenders with determining which consumer is the best prospect for particular offerings. Consumer A would likely be most interested in a low- interest rate card, whereas Consumer C may be more interested in a rewards card. The combination of the credit score and trended data provides significant insight into predicting consumer credit behavior, ultimately leading to more profitable lending decisions across the customer lifecycle: Response – match the right offer with the right prospect to maximize response rates and improve campaign performance Risk – understand direction and velocity of payment performance to adequately manage risk exposure Retention – anticipate consumer preferences to build long-term loyalty All financial institutions can benefit from the value of trended data, whether you are a financial institution with significant analytical capabilities looking to develop custom models from the trended data or looking for proven pre-built solutions for immediate implementation.

It should come as no surprise that reaching consumers on past-due accounts by traditional dialing methods is increasingly ineffective. The new alternative, of course, is to leverage digital channels to reach and collect on debts. The Past: Dialing for dollars. Let’s take a walk down memory lane, shall we? The collection approach used for many years was to initially send the consumer a collection letter recapping the obligation and requesting payment, usually when an account was 30 days late. If the consumer failed to respond, a series of dialing attempts were then made, trying to reach the consumer and resolve the debt. Unfortunately, this approach has become less effective through the years due to several reasons: The use of traditional landlines continues to drop as consumers shift to cell and Voice Over Internet Protocol (VOIP) services. The cost of reaching consumers by cell is more costly since predictive dialers can’t be used without prior consent, and the obtaining and maintaining consent presents its own set of tricky challenges. Consumers simply aren’t answering their phones. If they think a bill collector is calling, they don’t pick up. It’s that simple. In fact, here is a breakdown by age group that Gallup published in 2015, highlighting the weakness of traditional phone-dialing. The Present: Hello payment portal. With the ability to get the consumer on the phone to negotiate a payment on the wane, the logical next step is to go digital and use the Internet or text messaging to reach the consumer. With 71 percent of consumers now using smartphones and virtually everyone having an Internet connection, this can be a cost-effective approach. Some companies have already implemented an electronic payment portal whereby a consumer can make a payment using his or her PC or smartphone. Usually this is prompted by a collection letter, or if permitted by consumer consent, a text message to their smartphone. The Future: Virtual negotiation. But what if the consumer wants to negotiate different terms or payment plans? What if they want to try and settle for less than the full amount? In the past – and for most companies operating today – this translates into a series of emails or letters being exchanged, or the consumer must actually speak to a debt collector on the phone. And let’s be honest, the consumer generally does not want to speak to a collector on the phone. Fortunately, there is a new technology involving a virtual negotiator approach coming into the market now. It works like this: The credit grantor or agency contacts the consumer by letter, email, or text reminding them of their debt and offering them a link to visit a website to negotiate their debt without a human being involved. The consumer logs onto the site, negotiates with the site and hopefully comes to terms with what is an acceptable payment plan and amount. In advance, the site would have been fed the terms by which the virtual negotiator would have been allowed to use. Finally, the consumer provides his payment information, receives back a recap of what he has agreed to and the process is complete. This is the future of collections, especially when you consider the younger generations rarely wanting to talk on the phone. They want to handle the majority of their matters digitally, on their own terms and at their own preferred times. The collections process can obviously be uncomfortable, but the thought is the virtual negotiator approach will make it less burdensome and more consumer-friendly. Learn more about virtual negotiation.

With the recent switch to EMV and more than 4.2 billion records exposed by data breaches last year*, attackers are migrating their fraud attempts to the card-not-present channel. Our recent analysis found the following states to be the riskiest for e-commerce fraud in 2016. Delaware Oregon Florida New York Nevada Attackers are extremely creative, motivated, and often connected. Prevent e-commerce fraud by protecting all of your customer contact points. Fraud Heat Map>

The adoption of EMV terminals has pressured attackers to migrate their fraud attempts to the card-not-present channel. This is a major driver to the increase in e-commerce fraud attacks – more than 30% over last year. Here’s how this fraud victimization has increased across the country: 16% in North Central states. 25% in Northeastern states. 32% in Southern states. 25% in Western states. Attackers are extremely creative, motivated, and often connected. Protect all points of connection with your customers to prevent e-commerce fraud with a comprehensive, multilayered approach. Where does your state rank?

Legitimate address discrepancies are common, which surprises most people. And handling every address discrepancy as a high fraud risk is operationally expensive and inhibits the customer experience. You can avoid this type of fraud by employing these best practices: Use a distinct Know Your Customer and underlying Customer Identification Program process. Avoid verifications based on self-reported data. Maintain hotlist addresses. Fraud always will find the path of least resistance, and organized criminals will test you daily to isolate the weakest link. Be sure to regularly revisit your own policies and procedures for handling this type of fraud. Address manipulation fraud

Knowing a consumer’s credit information at a single point in time only tells part of the story. I often hear one of our Experian leaders share the example of two horses, running neck-in-neck, at the races. Who will win? Well, if you had multiple insights into those two horses – and could see the race in segments – you might notice one horse losing steam, and the other making great strides. In the world of credit consumers, the same metaphor can ring true. You might have two consumers with identical credit scores, but Consumer A has been making minimum payments for months and showing some payment stress, while Consumer B has been aggressively making larger pay-offs. Trended data adds that color to the story, and suddenly there is more intel on who to market to for future offers. To understand the whole story, lenders need the ability to assess a consumer’s credit behavior over time. Understanding how a consumer uses credit or pays back debt over time can help lenders: Offer the right products & terms to increase response rates Determine up sell and cross sell opportunities Prevent attrition Identify profitable customers Avoid consumers with payment stress Limit loss exposure The challenge with trended data, however, is finding a way to sort through the payment patterns in the midst of huge datasets. At the singular level, one consumer might have 10 trades. Trended data in turn reveals five historical payment fields and then you multiple all of this by 24 months and you suddenly have 1,200 data points. But let’s be real … a lender is not going to look at just one consumer as they consider their marketing or retention campaigns. They may look at 100,000 consumers. And on that scale you are now looking at sorting through 120M data points. So while a lender may think they need trended data – and there is definitely value in accessing it – they likely also need a solution to help them wade through it all, assessing and decisioning on those 120M data points. Tapping into something like Credit3D, which bundles in propensity scores, profitability models and trended attributes, is the solution that truly unveils the value of trended data insights. By layering in these solutions, lenders can clearly answer questions like: Who is likely to respond to an offer? How does a consumer use credit? How can I identify revolvers, transactors and consolidators? Is there a better way to understand risk or to conduct swap set analysis? How can I acquire profitable consumers? How do I increase wallet share and usage? Trended data sounds like a “no-brainer” and it definitely has the ability to shed light on that consumer credit horse race. Lenders, however, also need to have the appropriate analytics and systems to assess on the huge volume of data points. Need more information on Trended Data and Credit 3D? Contact Us

Fraud and address manipulation (Part 1) Identifying an address as incorrect seems simple enough. But in reality, address mismatches between an application and credit bureau data aren’t uncommon. Here are several legitimate reasons why this may occur: Change of residence. Credit bureau’s unique logic for determining which address is the "best." New/Emerging consumers often have fluctuating address data. Issuers that employ risk-based approaches allowing incorrect addresses to pass and those that use self-reported data for verification face the highest level of risk for this type of fraud. Next week, we’ll let you know how you can avoid these types of losses. Or you can get ahead and read our latest paper. Address manipulation fraud>

Internet-connected devices provide endless possibilities, but they rely on technology and collected data to deliver on their promises. This can compromise your network security. Follow these tips to enjoy the conveniences provided by Internet of Things devices while keeping your network safe. Look for devices that use end-to-end encryption. Change default passwords before connecting devices to your network. Enable two-factor authentication, when available. Leverage all security options, such as passwords, encryption, firewalls and firmware. The Internet of Things is only as strong as its weakest link. That's why it’s so important to understand and treat each connected device as part of a broader network. More security tips

Fraud and cybersecurity are two of the biggest risks challenging organizations and the economy today. Fraud has become its own industry, to the tune of $500 billion in estimated losses annually. To strengthen your fraud risk strategies, you need: A multilayered authentication and risk-based approach to prevent fraud. A comprehensive approach to identity with true customer intelligence. To avoid silos and recognize the value of combining your solutions into one platform. The rapid growth of fraud-related activity only reinforces the need for aggressive fraud prevention strategies and the adoption of new technology to prepare for the latest emerging cybersecurity threats. Want to know more?

As we approach the one-year anniversary of the EMV liability shift, we have seen an increase in e-commerce fraud — to the tune of 15% higher than last year. Additional insights from Experian’s biannual analysis on e-commerce fraud include: 44% of e-commerce billing fraud came from Florida, California and New York* 52% of e-commerce shipping fraud came from Florida, New York and California* Miami, Fla., is the most dangerous city in the United States for e-commerce merchants* As fraudsters continue to perpetrate card-not-present fraud, ensure you are prepared. You’ll be thankful if fraudsters come calling. >> E-commerce Attack Rates

Historically, the introduction of EMV chip technology has resulted in a significant drop in card-present fraud, but a spike in card-not-present (CNP) fraud. CNP fraud accounts for 60% to 70% of all card fraud in many countries and is increasing. Merchants and card issuers in the United States likely will see a rise in CNP fraud as EMV migration occurs — although it may be more gradual as issuers and merchants upgrade to chip-based cards. As fraud continues to evolve, so too should your fraud-prevention strategies. Make a commitment to stay abreast of the latest fraud trends and implement sophisticated, cross-channel fraud-prevention strategies. >>Protecting Growth Ambitions Against Rising Fraud Threats