Debt & Collections
A recent Experian survey found that while consumers are getting better about protecting their information on a regular basis, many do not take the same precautions when traveling. According to the survey, 1 in 5 consumers has had an item with sensitive information lost or stolen while traveling, and 39% have experienced identity theft while traveling or know someone who has. Organizations can protect themselves and customers by using innovative fraud-detection tools designed to reduce potential losses while preserving the customer experience. >> Video: The reputational impact of fraud and identity theft

With more than one-third of customers interacting with a single business in five or more channels and more than 85 percent of consumers using online or mobile to conduct business, omnichannel fraud prevention has become a necessity. Implementing a layered approach to authentication and integrating device intelligence into the process to associate a consumer with a known device are critical components of a fraud mitigation strategy. In addition to providing another layer of validation, verifying a customer through his or her device makes it easier for the customer to interact with the business and is a huge benefit to the overall customer experience. Perspective paper: Protecting the customer experience - The impact of fraud on the customer relationship
Gift cards are the most requested gift item and have been for the last eight years. Merchants love gift cards because they take up very little space and the recipient often ends up spending more than the value of the gift card.
The experience of being a victim of data breaches has created a shift in consumer behavior and attitude over the past year. A recent Ponemon Institute study found that more than one-third of consumers ignored data breach notification letters, taking no action to protect themselves against fraud. To combat data breach fatigue, companies should communicate with customers sincerely and avoid treating the notification process as a compliance issue. Notification letters should include an apology, a clear explanation of what happened and why, and steps consumers can take to protect themselves from fraud. 2015 Data Breach Industry Forecast
While marketers typically spend vast amounts of money to increase customer acquisitions, fraud prevention can undercut those efforts. According to a recent 41st Parameter® study, average card-not-present declines represent 15 percent of all transactions; however, one to three percent of those declined transactions turn out to be false positives, equating to 1.2 billion dollars in lost revenue annually. Marketers can avoid unnecessary declines and create a seamless customer experience by communicating campaign plans to the fraud-risk team early on and coordinating marketing and fraud-prevention efforts. Download Experian’s latest fraud prevention report. Report: Holiday Marketing & Fraud
This is the third post in a three-part series. Experian® is not a doctor. We don’t even play one on TV. However, because of our unique business model and experience with a large number of data providers, we do know data governance. It is a part of our corporate DNA. Our experiences across our many client relationships give us unique insight into client needs and appropriate best practices. Note the qualifier — appropriate. Just as every patient is different in his or her genetic predispositions and lifestyle influences, every institution is somewhat unique and does not have a similar business model or history. Nor does every institution have the same issues with data governance. Some institutions have stabile growth in a defined footprint and a history of conservative audit procedures. Others have grown quickly through aggressive acquisition marketing plans and unique channels and via institution acquisition/merger, leading to multiple receivable systems and data acquisition and retention platforms. Experian has provided valuable services to both environments many times throughout the years. As the regulatory landscape has evolved, lenders/service providers demand a higher level of hands-on experience and regulatory-facing credibility. Most recently, lenders have required assistance on the issues driven by mandates coming from the Comprehensive Capital Analysis and Review (CCAR), Office of the Comptroller of the Currency (OCC) and the Consumer Financial Protection Bureau (CFPB) bulletins and guidelines. Lenders are best served to begin their internal review of their data governance controls with a detailed individual attribute audit and documentation of findings. We have seen these reviews covering fewer than 200 attributes to as many as more than 1,000 attributes. Again, the lender/provider size, analytic sophistication and legacy growth and IT issues will influence this scope. The source and definition of the attribute and any calculation routines should be fully documented. The life cycle stage of attribute acquisition and usage also is identified, and the fair lending implication regarding the use of the attribute across the life cycle needs to be considered and documented. As part of this comprehensive documentation, variances in intended definition and subsequent design and deployment are to be identified and corrective action guidance must be considered and documented for follow-up. Simultaneously, an assessment of the current risk governance policies, processes and documentation typically is undertaken. A third party frequently is leveraged in this review to ensure an objective perspective is maintained. This initiative usually is a series of exploratory reviews and a process and procedures assessment with the appropriate management team, risk teams, attribute design and development personnel, and finally business and end-user teams, as necessary. From these interviews and the review of available attribute-level documentation, documents depicting findings and best practices gap analysis are produced to clarify the findings and provide a hierarchy of need to guide the organization’s next steps: A more recent evolution in this data integrity ecosystem is the implication of leveraging a third party to house and manipulate data within client specifications. When data is collected or processed in “the cloud,” consistent data definitions are needed to maintain data integrity and to limit operational costs related to data cleansing and cloud resource consumption. Maintaining the quality of customer personal data is a critical compliance and privacy principle. Another challenge is that of maintaining cloud-stored data in synchronization with on-premises copies of the same data. Delegation to a third party does not discharge the organization from managing risk and compliance or from having to prove compliance to the appropriate authorities. In summary, a lender/service provider must ensure it has developed a rigorous data governance ecosystem for all internal and external processes supporting data acquisition, retention, manipulation and utilization: A secure infrastructure includes both physical and system-level access and control. Systemic audit and reporting are a must for basic compliance standards. If data becomes corrupted, alternative storage, backup or other mechanisms should be available to protect the information. Comprehensive documentation must be developed to reveal the event, the causes and the corrective actions. Data persistence may have multiple meanings. It is imperative that the institution documents the data definition. Changes to the data must be documented and frequently will lead to the creation of a new data attribute meeting the newer definition to ensure that usage in models and analytics is communicated clearly. Issues of data persistence also include making backups and maintaining multiple archive copies. Periodic audits must validate that data and usage conform to relevant laws, regulations, standards and industry best practices. Full audit details, files used and reports generated must be maintained for inspection. Periodic reporting of audit results up to the board level is recommended. Documentation of action plans and follow-up results is necessary to disclose implementation of adequate controls. In the event of lost or stolen data, appropriate response plans and escalation paths should be in place for critical incidents. Throughout this blog series, we have discussed the issues of risk and benefits from an institution’s data governance ecosystem. The external demands show no sign of abating. The regulators are not looking for areas to reduce their oversight. The institutional benefits of an effective data governance program are significant. Discover how a proven partner with rich experience in data governance, such as Experian, can provide the support your company needs to ensure a rigorous data governance ecosystem. Do more than comply. Succeed with an effective data governance program.
According to a recent 41st Parameter® study, 85 percent of consumers use online or mobile channels to conduct business.
As data breaches continue to attract publicity, consumers are expecting more from impacted organizations.
A recent survey reveals that 30 percent of travelers have experienced identity theft while traveling or know someone who has.
A recent study conducted by the Ponemon Institute found that a data breach is among the top three occurrences that affect brand reputation, along with poor customer service and an environmental incident.
By: Maria Moynihan Crime prevention and awareness techniques are changing and data, analytics and use of technology is making a difference. While law enforcement departments continue to face issues related to data - ranging from working with outdated information, inability to share data across departments, and difficulty in collapsing data for analysis - a new trend is emerging where agencies are leveraging outside data sources and analytic expertise to better report on crimes, collapse information, predict patterns of behavior and ultimately locate criminals. One best practice being implemented by law enforcement agencies is to skip trace an individual much like a debt collector would. Techniques involve using historic address information and individual connections to better track to a person’s current location. See the full write up from CollectionsandCreditRisk.com to see how this works. Another great example of effective use of data in investigations can be seen in this video, where one Experian client, Intellaegis of El Dorado Hills, CA, recently worked with local law enforcement to follow the digital data footprints of a particular suspect, finding her in in just five minutes of searching. p> And, yet another representation of improved data gathering, handling and sharing of information for crime prevention and awareness can be found on a site I was just made aware of by one of my neighbors - www.crimemapping.com. Information is collapsed across departments for greater insight into the crimes that are happening within a neighborhood, offering a more comprehensive option for the general public to turn to on local area crime activity. Clearly, data, analytics and technology are making a positive impact to law enforcement processes and investigations. What is your public safety organization doing to evolve and better protect and serve the public?
The growing cost and number of data breaches has spurred more interest in cyber insurance. While companies often increase investments in technology and training programs to reduce the likelihood of a breach, a recent Ponemon Institute survey of risk-management professionals found that 31 percent of companies surveyed have cyber insurance and 39 percent plan to purchase cyber insurance in the future. Learn how to outline your response plan with our data breach response guide. Source: Managing Cyber Security as a Business Risk: Cyber Insurance in the Digital Age
By: Maria Moynihan Government organizations that handle debt collection have similar business challenges regardless of agency focus and mission. Let’s face it, debtors can be elusive. They are often hard to find and even more difficult to collect from when information and processes are lacking. To accelerate debt recovery, governments must focus on optimization--particularly, streamlining how resources get used in the debt collection process. While the perception may be that it’s difficult to implement change given limited budgets, staffing constraints or archaic systems, minimal investment in improved data, tools and technology can make a big difference. Governments most often express the below as their top concerns in debt collection: Difficulty in finding debtors to collect on late tax submissions, fines or fees. Prioritizing collection activities--outbound letters, phone calls, and added steps in decisioning. Difficulty in incorporating new tools or technology to reduce backlogs or accelerate current processes. By simply utilizing right party contact data and tools for improved decisioning, agencies can immediately expose areas of greater possible ROI over others. Credit and demographic data elements like address, income models, assets, and past payment behavior can all be brought together to create a holistic view of an individual or business at a point in time or over time. Collections tools for improved monitoring, segmentation and scoring could be incorporated into current systems to improve resource allotment. Staffing can then be better allocated to not only focus on which accounts to pursue by size, but by likelihood to make contact and payment. Find additional best practices to optimize debt recovery in this guide to Maximizing Revenue Potential in the Public Sector. Be sure to check out our other blog posts on debt collection.
A recent survey of government benefit agencies shows an increased need for fraud detection technology to prevent eligibility fraud. Only 26 percent of respondents currently use fraud detection technology, and 57 percent cite false income reporting as the leading cause of fraud. Insufficient resources and difficulty integrating multiple data sources were the greatest challenges in preventing eligibility fraud.
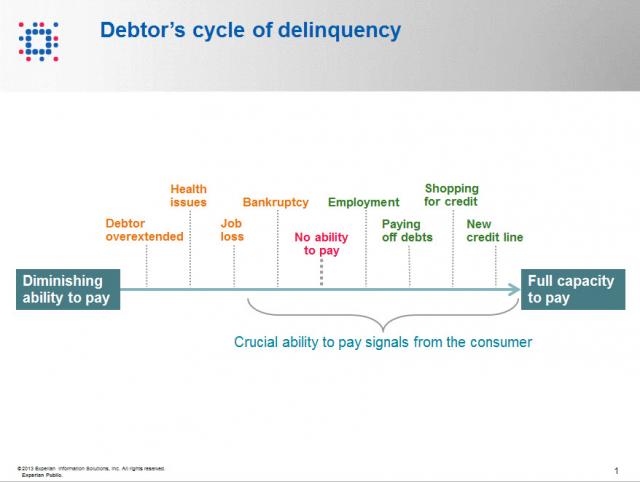
Contact information such as phone numbers and addresses are fundamental to being able to reach a debtor, but knowing when to reach out to the debtor is also a crucial factor impacting success or failure in getting payment. As referenced in the chart below, when a consumer enters the debtor life cycle, they often avoid talking with you about the debt because they do not have the ability to pay. When the debtor begins to recover financially, you want to be sure you are among the first to reach out to them so you can be the first to be paid. According to Don Taylor, President of Automated Collection Services, they have seen a lift of more than 12% of consumers with trigger hits entering repayment, and this on an aged portfolio that has already been actively worked by debt collection staff. Monitoring for a few key changes on the credit profiles of debtors provides the passive monitoring that is needed to tell you the optimal time to reach back to the consumer for payment. Experian compiled several recent collection studies and found that a debtor paying off an account that was previously past due provided a 710% increase in the average payment. Positive improvement on a consumers’ credit profile is one of those vital indicators that the consumer is beginning to recover financially and could have the will—and ability—to pay bad debts. The collection industry is not like the big warehouse stores—quantity and value do not always work hand in hand for the debt collection industry. Targeting the high value credit events that are proven to increase collection amounts is the key to value, and Experian has the expertise, analytics and data to help you collect in the most effective manner. Be sure to check out our other debt collection blog posts to learn how to recover debt more quickly and efficiently.