Vehicle Data

Lemon vehicle history is a serious issue that can have a significant impact on the automotive industry. Buying a vehicle that is branded as a lemon may harm a dealership or the OEM's reputation. Customers may be less likely to buy automobiles from that manufacturer or dealership in the future if they learn the vehicle they bought was branded a lemon. Used vehicles with lemon vehicle history has implications Furthermore, automakers may incur higher costs as the expense of buying back and fixing lemon vehicles is frequently the responsibility of the auto manufacturers. Finally, the used automobile market may be impacted by a vehicle's lemon history. Used cars with lemon vehicle history events are frequently worth less than equivalent autos without such activity. New lemon-reported events analysis infographic available View our most recent Vehicle Insights Infographic Report: Lemon Reported Events Data Analysis. You’ll learn more about lemon-reported activity for vehicles, what percentage of owners repurchase a different vehicle after the initial reported activity, and how many vehicles with the lemon event history are still on the road. We have a series of vehicle insight infographic reports you may also be interested in: Water and Flood Reported Events Vehicle Accident and Damage Insights

Experian Automotive has updated our Electric Vehicles 2022 Year-in-Review Infographic Report with new 2023 Half-Year insights. In the previous report, we shared that over 6% of new, retail registrations were for electric vehicles. As we evaluated the current state of the Electric Vehicle Market for the first half of 2023 (January-June registrations), the percentage of new, retail registrations for electric vehicles has increased to over 7.5%. There are several factors driving consumer adoption of electric vehicles in the United States, including: Environmental concerns: Consumers are increasingly concerned about the environmental impact of transportation, and EVs produce zero emissions at the tailpipe. Government incentives: Many state and federal governments offer incentives for the purchase of electric vehicles, such as tax credits and rebates. Falling battery costs: The cost of lithium-ion batteries, the key component of EVs, has fallen in recent years, making EVs more affordable for consumers. Increasing availability of EV models: Automakers are releasing a growing number of EV models, giving consumers more choices to fit their needs and budgets. Despite the progress that has been made, there are still some challenges that need to be addressed to accelerate EV adoption in the United States. These challenges include: Lack of charging infrastructure: There is a need for more public charging stations, especially in rural areas and along major highways. High upfront cost: EVs can still be more expensive to purchase than gasoline-powered vehicles, even after factoring in government incentives. Range anxiety: Some consumers are concerned about the range of EVs, which can be limited compared to gasoline-powered vehicles. Despite the challenges, the future of electric vehicles in the United States is bright. Automakers are investing heavily in EV development, and the number of EV models available to consumers is expected to continue to grow. Additionally, state and federal governments are taking steps to support EV adoption, such as investing in charging infrastructure and offering incentives for consumers and businesses to purchase If you’d like to learn more about the current state of the Electric Vehicle market and buyer and how that market is growing and changing, check out our Updated Electric Vehicles Year in Review Infographic.

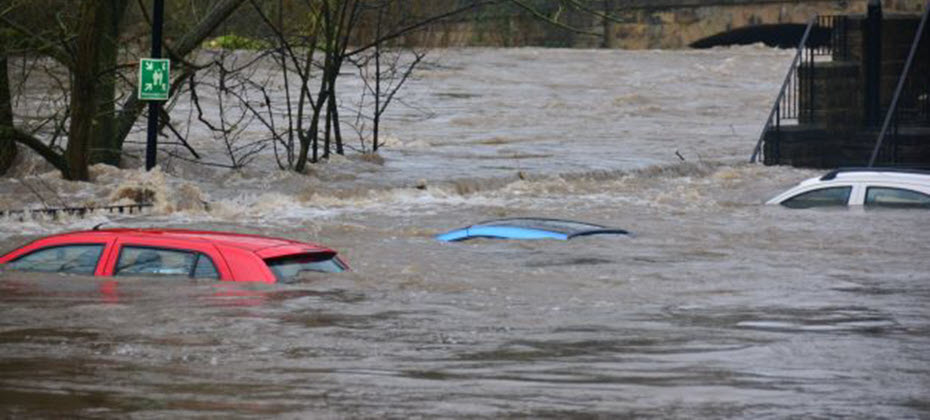
The 2023 hurricane season is upon us. This year, over 21 named storms were predicted for this year, and we have already seen storms make landfall. One of the biggest dangers that hurricanes pose to the automobile industry is vehicle water and/or flood damage. In 2022, FEMA paid out over $1 billion for flood damage to automobiles in the United States. This damage can have a significant impact on businesses in the automobile industry, including: New car dealerships: Flood damage can destroy new cars and trucks, forcing dealerships to replace them. This can be a costly proposition, especially in a time when supply chains are already disrupted. Used car dealerships: Flood damage can also damage used cars, making them less valuable or even unsalable. This can lead to lost revenue for used car dealerships. Auto repair shops: Auto repair shops may be called upon to repair flood-damaged vehicles. However, some flood-damaged vehicles may be beyond repair. This can lead to lost revenue for auto repair shops. Auto parts suppliers: Auto parts suppliers may also be impacted by flood damage. If factories that produce auto parts are flooded, it can disrupt the supply of auto parts to dealerships and repair shops. In addition, it is important to note that flooded cars may still be on the road. And these vehicles may not be in operation in the geography where the reported water and/or flood damage occurred. To help you stay up to date on the latest insights into flood damaged vehicles we’ve put together a complimentary Vehicle Insights: Water and Flood Reported Events Infographic. You’ll learn: • What percentage of owners repurchase a different vehicle after water or flood damage for their current vehicle • Where was the damage originally reported? • Where are vehicles with water or flood damage currently located? Download the Vehicle Insights: Water and Flood Reported Events Infographic Now! Here is another resource you may find useful to help mitigate the risk of purchasing flood damaged vehicles. Check out our Free AutoCheck Flood Risk Check.

Experian Automotive has just released electric vehicle data insights in our 2022 Electric Vehicle Year In Review infographic.

In our continued efforts to make vehicle information and insights quick and easy to read for auto dealers, we’ve redesigned our AutoCheck vehicle history report. As competition for used vehicles remains high, dealers must make quick decisions on whether to acquire a potential vehicle. Whether you need to evaluate a trade-in or want to make a flat-out offer on a vehicle, quickly accessing the vehicle’s history is only the first step. We’ve made it even easier for you to get key information in our newly designed report. We are confident that the newly designed report will continue to help dealers better manage risk and confidently buy and sell the right vehicles.Did you know?• AutoCheck has data from over 95% of U.S. auction houses with 99.82% manufacturer coverage of open recall data for vehicles on the road • Experian aggregates and analyzes tens of thousands of distinct accident sources; many provided only to AutoCheck • AutoCheck has exclusive Auction Announcement data for up to 2.7% of vehicles in operation (that have been to an auction)• We’re the only VHR provider integrated on all the top consumer vehicle shopping sitesHow AutoCheck can help improve your business You may also be interested in learning how AutoCheck VHRs can improve your business by reading Vehicle Detail Pages with a Free VHR Have Higher Lead and Sale Conversion Rates or how we helped a large insurance company better manage risk in our case study, LexisNexis Helps Manage Risk for National Insurance Company. Learn more about the benefits of becoming an AutoCheck subscriber.

When your marketing strategies don’t go as planned, don’t you wish you could have taken a “mulligan?” In today’s marketing world, it’s normal and critical to measure marketing effectiveness.

Did you know that GenX had the most Hybrid owners migrate to Electric Vehicles in 2021? And believe it or not, the next group behind GenXers were Boomers! That’s right, not millennials or GenZ…Boomers! We have many more details to share on the Electric Vehicle segment and the consumers in that segment who buy them in our newly released Experian Automotive Consumer Trend Report: Q2 2022. Every quarter, Experian’s Automotive Consumer Trends Report provides insights into specific vehicle segments and the associated consumers within that segment. This quarter focuses on the Electric Vehicle (EV) market. The report answers these questions: How many EVs are on the road? Where are they located? How have recent EV registrations shifted the geographic distribution? Which manufacturers are selling those vehicles? Who is taking market share from whom? Who are the consumers who registered those vehicles? What are the demographic and psychographic insights for those consumers? There are two ways to receive the report information: Watch the on-demand presentation of the report while our analyst provides critical insight & analysis OR Download a PDF version of the report At Experian Automotive, we understand that marketers need to deeply understand consumers to develop targeted, effective marketing strategies. Whether you are an OEM marketer, an agency, or an auto dealer, our presentation will transform complex market data into actionable insights that you can begin using immediately.
The AutoCheck FREE Flood Risk Check site has been updated with data from Kentucky, Colorado, Texas, and Missouri floods New cars continue to be in short supply due to the microchip shortage, so consumers quickly turned their attention to used cars. Unfortunately, dealers continue to struggle with obtaining enough used car inventory to meet demand. To add to an already challenging time, Mother Nature has brought record flooding in multiple areas of the United States. It’s more important than ever that dealers be careful about obtaining pre-owned cars that could potentially have flood damage. The best way to mitigate the risk of purchasing a flood damaged vehicle is to start by running an AutoCheck Free Flood Risk Check. Visitors simply enter any vehicle's 17-digit VIN and the tool will check for flood brands and provide information if the vehicle was registered in a region impacted by a FEMA disaster declaration. Two levels of reporting available The first level of reporting determines whether the vehicle has been titled/registered 12 months prior in a county that has been identified as requiring public and individual assistance (FEMA categories A and B) for a FEMA-declared major disaster. This would yield a “Yes” result. For instance, you would get a “Yes” result if the vehicle was registered in an impacted area during the time of a FEMA-declared major Hurricane disaster. The “Yes” result should not be interpreted as confirmation of flood damage or even possible flood damage. The data is provided merely as information regarding the location of the vehicle’s registration/title history so users can be aware of risk exposure. For example, the Hurricane Ida region had thousands of damaged cars, but some cars in the region may not have been damaged by the hurricane — the owner could have driven the car when they evacuated, or a child or other family member may have been out of town with the car when the hurricane hit. The second level of reporting is based on search results from Experian data such as flood title and problem records, including flood State title brands, auction flood announcements, salvage auction flood designations, and other vehicle records determined by Experian to relate to or suggest an increased likelihood of flood damage or risk exposure. It takes time for claims and updates to vehicle title information to appear on a vehicle’s history and although the DMV requires that title brands be issued for vehicles damaged by floods, not every vehicle flood event is reported by car owners. Unreported flood events may not appear on an AutoCheck Flood Risk Check or AutoCheck Vehicle History Report. Although Experian provides flood related records from available data sources, we cannot provide assurance that an AutoCheck Flood Risk Check that does not produce any records means that the subject vehicle has not experienced flood damage. That’s why it’s important to review a full AutoCheck Vehicle History Report, which—in addition to potential flood damage—includes reported accidents, branded titles, recalls, number of owners and more. Once you run the full Vehicle History Report we recommend an independent evaluation and inspection of the vehicle to determine and confirm a vehicle’s condition prior to purchase. Try the AutoCheck Flood Risk Check today to help mitigate the risk of purchasing flood damaged vehicles. Not an AutoCheck subscriber? Contact us to become an AutoCheck client.

According to Experian’s Automotive Market Trends Report: Q1 2022, new vehicle registrations were down 19% from the prior year—declining to 3.4 million. Used registrations went from 11.4 million to 9.9 million year-over-year, decreasing 13.2%.

Whether a consumer has a brand-new or used vehicle, it’s inevitably going to need regular maintenance and require repairs. Fortunately for aftermarket professionals, the aftermarket “sweet spot” is continuously growing—a trend that should be watched closely. Vehicles in the sweet spot are typically between six- to 12-model-years-old and have aged out of general OEM manufacturer warranties for any repairs. Knowing the model year and type of vehicles that are in operation will be important for aftermarket professionals to determine what parts may be needed, and anticipate potential consumer needs. According to Experian’s Automotive Market Trends Report: Q1 2022, 35.8% of vehicles in operation (VIO) now fall within the aftermarket sweet spot, a 6.5% year-over-year increase. It is important to note that the aftermarket sweet spot max volume record of 104 million is expected to be broken over the next 12-18 months, considering the sweet spot volume was 100.3 million through Q1 2022 and the last time it exceeded that number was nine years ago. The increase will create more opportunities for aftermarket professionals as more vehicles will potentially need maintenance. Aftermarket “sweet spot” will continue to grow Right now, the aftermarket sweet spot consists of model years between 2011 and 2017. There were 10.5 million 2011 model year vehicles on the road through Q1 2022, this low volume will transition into the post-sweet spot next year. At the same time, there will be 16.5 million 2018 model year vehicles entering the sweet spot. Furthermore, an estimated 16.7 million vehicles in operation with a 2019 model year and almost 14.3 million vehicles in operation with a 2020 model year will be transitioning into the sweet spot in the next two years. When these model year vehicles enter the sweet spot, the current 12 million vehicles with a 2012 model year and an estimated 13.7 million 2013 model year vehicles will transition into the post-sweet spot, resulting in a notable increase. Watching this data closely will allow aftermarket professionals to continue assisting with maintenance and repairs for these vehicles that are currently on the road, as well as prepare for what’s to come to the aftermarket industry in approaching years. To learn more about other vehicle registration trends, watch the full Automotive Market Trends Report: Q1 2022 presentation on demand.

As competition for used vehicles remains fierce, dealers must make quick decisions on whether to acquire a potential vehicle—or someone else will. Whether you need to evaluate a trade-in or want to make a flat-out offer on a vehicle, quickly accessing the vehicle’s history is only the first step. What if you could determine the likelihood that a vehicle will be on the road in five years and compare it to other similar vehicles? Would this help in your decision-making? Use the AutoCheck Score to evaluate vehicles for your lot The patented AutoCheck ScoreSM was developed to help dealers determine the likelihood that a vehicle will be on the road in five years. The AutoCheck Score summarizes vehicle history data into an easy-to-understand “score” and provides an equivalent score range. Understanding the likelihood that a unit will still be on the road in five years gives dealers more perspective on a vehicle’s desirability and can help you accurately price it. Use the AutoCheck Score to more accurately merchandise vehicles The AutoCheck Score range will give you similarly aged and classed vehicles for comparison that you can use to help merchandise the vehicle for market and help manage consumer conversations regarding the vehicle’s price. How does the AutoCheck Score work? The AutoCheck Score analyzes various characteristics, including age, segment, mileage, number of owners, vehicle use, vehicle events, accidents, theft, and title brands. Essentially, this score summarizes the AutoCheck Vehicle History Report fields and delivers a “score range” that allows you to compare the actual vehicle (score) to other similarly aged and classed vehicles. The score is based on a scale of 1 to 100, but reading the score in conjunction with the score range is essential since looking at the score without knowing the range will reveal only half the story. Check out the example below. Car #1 has a lower score than Car #2. However, look at the score ranges (73-86). For Car #1, other comparable vehicles should fall into a range from 73 to 86, and this car scored an 84. That means the vehicle is within the AutoCheck Score range compared to other similar cars of the same age and class. Car #2 has a score of 89. Because this is higher than Car #1’s score, you might assume this car has a more favorable vehicle history, but that’s not entirely accurate. Comparable vehicles should score in a range from 90 to 95, and this car falls short. That means the car’s history is slightly less favorable compared to similar vehicles of the same age and class. In today’s competitive environment though, dealers may decide to take in both trades, and the AutoCheck Score can also help make decisions on how to price the vehicles for market. Become an AutoCheck member today As an AutoCheck subscriber, you’ll have access to the AutoCheck Score. Between the large graphic display and the simple number comparison, the AutoCheck Score can help you make decisions on vehicle acquisition much quicker and easier!

Last month my blog discussed how Building the Perfect Audience is Like Building the Perfect Burger! It was National Hamburger Month, so it seemed apropos! We offered marketers insight into building better audiences to help run more strategic marketing campaigns. This month, I am keeping with the monthly ‘holiday’ theme. June 20th was National American Eagle Day and being so close to our 4th of July holiday, I thought this was a perfect tie-in this month! You are probably wondering how I am going to tie in National American Eagle Day with another marketing strategy, but I promise you, I can! It’s all about having strategic insight into your customers and using an “eagle eye” to learn what you can about them to obtain better results from your marketing efforts. An eagle's-eye approach to finding and reaching the right consumers Here are a few fun facts about the great American Bald Eagle. Bald Eagles were placed at the center of the Great Seal of the United States in 1782! “Bald” in Bald Eagle refers to an old English word that means “white-headed.” We’ve all heard people talk about having an “eagle eye.” It’s true—this comes from the eagle’s astonishing eyesight. Eagles can see clearly and about eight times as far as humans can, allowing them to spot and focus on a rabbit or other prey at a distance of about two miles. Can you imagine? They can also look ahead and to the side simultaneously with a 340-degree visual field! Imagine if you had an eagle-eye, 340-degree view of your customers or prospects before running a marketing campaign. Well, you can. Experian data insights offers an eagle-eye approach to finding and reaching the right consumers at the right time in the buying journey to help you eliminate marketing waste and deliver a more significant return on your marketing spend. Understanding your customers is key With Experian’s Insights solution, as part of our comprehensive Experian Marketing Engine, we offer OEM marketers, agencies, and larger dealer groups access to multiple Insight categories to learn more about your customers. Understanding your current customers or the segment of prospects you would like to target allows for a more strategic approach to marketing campaigns. Our brand, model, registration, title, finance, market analysis, lifestyle, and household insights can help you take a 360-degree view of your customer (that's right, 360 degrees, 20 degrees more than an eagles eye!) There’s a lot of discuss here, so we’ve put together a complimentary resource, Understand Your Customer Before Choosing Your Audience that explains all the ways you can use Insights to learn more about your customers. What is the Experian Marketing Engine? Insights is part of the Experian Marketing Engine marketing solution that helps automotive marketers, manufacturers, advertisers, agencies, and platforms identify the right audience, uncover the most appropriate communication channels, develop messages that resonate, and measure the effectiveness of marketing activities.

When acquiring inventory for your used lot, using AutoCheck Vehicle History Reports is like an ‘insurance’ policy! As the industrial-strength vehicle history report, AutoCheck helps dealers manage risk and confidently buy and sell more of the right vehicles. We’re so confident in our solution that we offer buyback protection. When is AutoCheck Buyback Protection available? AutoCheck Buyback Protection is available for vehicles with an AutoCheck vehicle history report if a certain title brand is found after the vehicle is reported to be free of the brand. AutoCheck Buyback Protection provides: A full year of coverage to protect consumers from major title problems that the Department of Motor Vehicles may have missed Coverage for the purchase price of the vehicle (up to 110% of the NADAguides.com published retail value) PLUS up to $500 in aftermarket accessories Title brands covered by the Buyback Protection plan include: Junk or salvage Dismantled, rebuilt, or reconstructed Flood damage Hail damage Fire damage Bought back by the manufacturer (“lemon law”) Odometer exceeds mechanical limits Odometer was not actual mileage How do consumers take advantage of AutoCheck Buyback protection? Consumers must register for AutoCheck Buyback protection within 90 days of the vehicle purchase date The AutoCheck report must have been run before purchasing the vehicle Consumers must provide a copy of the front and back of the branded title certified by the issuing state. The branded title must have been issued at least 60 days before the AutoCheck vehicle history report was run. Consumers must complete and submit a claim form and provide a complete copy of the AutoCheck vehicle history report Consumers have one year from the vehicle history run date to file a claim Don’t forget to remind your customers to register for the protection plan! Manage risk and protect your business with AutoCheck AutoCheck vehicle history reports can help you make the most informed decisions and minimize risk when purchasing a used vehicle! With tens of thousands of distinct accident sources, AutoCheck has more accident data than other providers. AutoCheck has data from over 95% of U.S. auction houses with 82% manufacturer coverage of open recall data for vehicles on the road We aggregate and analyze tens of thousands of distinct accident sources; many provided only to AutoCheck The only VHR integrated on all the top consumer vehicle shopping sites Become an AutoCheck Member Today!

We are thrilled to introduce a new quarterly series, Automotive Consumer Trends & Analysis. For years, Experian has been delivering automotive insights in our State of the Automotive Finance Market and Automotive Market and Registration Trends quarterly presentations. We are now bringing similar insights and analyses to the automotive consumer market. At Experian, we understand that marketers need to have a deep understanding of consumers in order to develop targeted, effective marketing strategies. Whether you are an OEM marketer, an agency or large dealer group our presentations will transform complex market data into actionable insights that you can begin using immediately. Learn more about vehicle segments and consumers Would you like to understand which people are buying what vehicles with a clear view of what these consumers look like? The Automotive Consumer Trends & Analysis presentations will provide updated quarterly insights on specific vehicle segments and the associated consumers within that segment. We’ll answer questions like: How many vehicles are on the road? Where are they located? How have recent registrations shifted the geographic distribution? Which manufacturers are selling those vehicles? Who is taking market share from whom? Who are the consumers who registered those vehicles? What are the demographic and psychographic insights for those consumers? We’ll also cover industry news and provide a special market analysis Inaugural Presentation! Release Date: June 23rd Segment: Crossover Utility Vehicles (CUV) You’ll leave the presentation with insights you need to make more strategic marketing decisions and better connect with consumers. Register now for the Automotive Consumer Trends & Analysis quarterly series. Once you register, you’ll receive an email when the presentation has been released.

Today’s OEM marketers, agencies and large dealer groups are under tremendous pressure to connect with consumers across multiple marketing channels. Finding a wide variety of relevant audiences is critical to campaign success. Because May is National Hamburger Month (yep, it’s a real thing), I will compare building the perfect burger to building the ideal automotive audience. Here we go. First, imagine your favorite burger joint (or gourmet burger eatery). You start by opening the menu and likely seeing some of the house “standards.” These are the traditional favorites available “off the menu” with little fuss. Burger with American cheese, Burger with lettuce, onion and tomato. Easy peasy. These types of offerings are similar to what we call our Syndicated audiences. Experian has more than 600 syndicated audiences that are readily available and on the shelf of most trusted platforms. More Choices and Options After that, things get interesting with lots of options to make your burger exactly how you want it. Do you want beef, veggie, portobello mushroom or maybe even bison as your “burger” choice? Cheese? Sure, but what kind? American, cheddar, swiss, blue, pepper jack? And what about toppings? Fried onion strings, raw, cooked? Mushrooms? Jalapenos? Ketchup, mustard, hot sauce, chipotle? Don’t even get me started about your bun choices! You see where I am going with this. With Experian’s Audiences, we have four more levels after our Syndicated Audiences that can help you create the targeted audiences you need based on your specific strategy. From Syndicated to Premium to Custom: Build the Perfect Audience For example, do you need to target in-market customers for a new or used vehicle? Equity positioning? End of term? Alternate fuels? A specific make and/or model? Do you need to target consumers by a particular price range? We can also build custom audiences based on your first-party data coupled with our data resources to help with vehicle launches, services campaigns and any unique audience need you have. We don’t expect you to understand all of this in a short blog, so we’ve written a complimentary resource, Automotive Audience Choices are Key to Ever-Changing Strategies, explaining each of the five categories of audiences. Download it to learn how to build the perfect burger—I mean audience. By the way, as a Midwestern girl, my favorite burger is a traditional cheeseburger with all the fixins—so bring on the sharp cheddar, lettuce, tomatoes, pickles and fried onions. What’s yours? Feel free to email me about burgers or audiences! Audiences is part of the Experian Marketing Engine marketing solution that helps automotive marketers, manufacturers, advertisers, agencies, and platforms identify the right audience, uncover the most appropriate communication channels, develop messages that resonate, and measure the effectiveness of marketing activities.