Loading...

While EV Registrations Grow Through the First Half Of 2021, Non-Electric Remains Dominant

Published: October 18, 2021 by Guest Contributor

You can’t open an automotive magazine or listen to a podcast without some sort of reference to electric vehicles (EVs). As the industry looks to move toward more sustainable fuels, EVs are making quite a splash.

But how does that hype compare with the numbers? In Experian’s Automotive Market Trends Review: Q2 2021, we looked at the data to better understand EV and internal combustion engine (ICE) registration trends.

EV registration sees significant growth

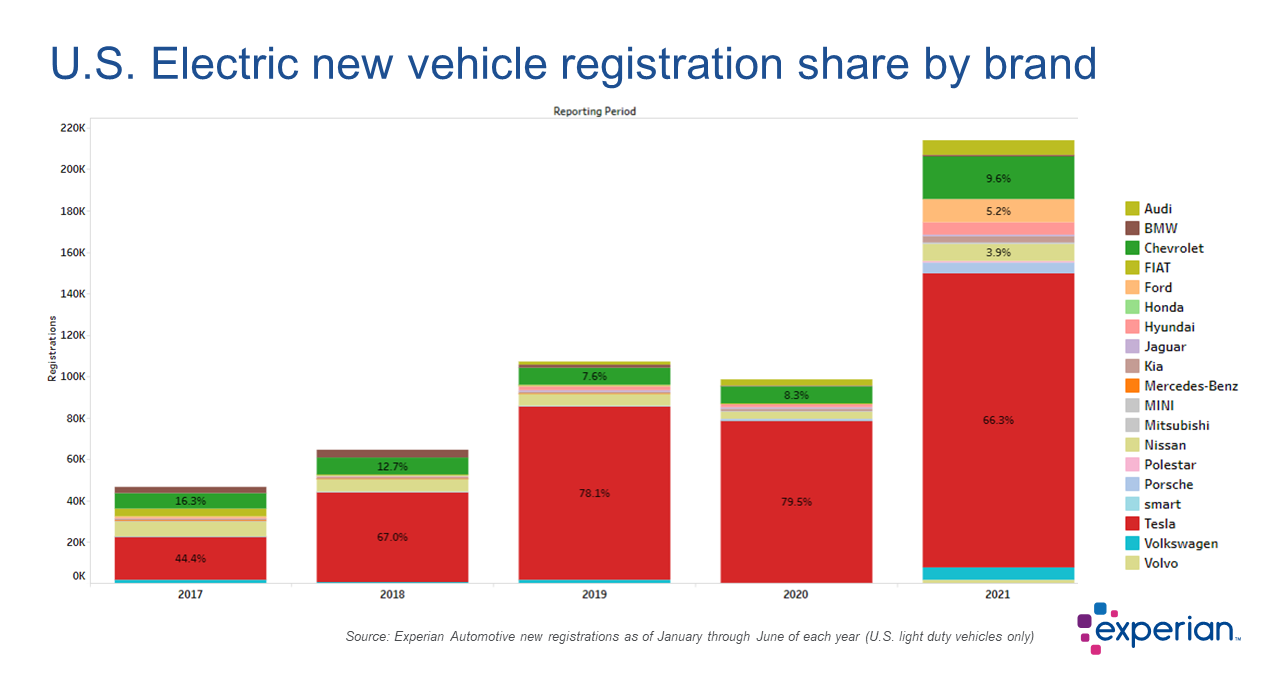
Through the first half of 2021, electric vehicles comprise just 0.43% of all of vehicles in operation. But that small number has seen significant growth year-over-year. From January – June 2021, EVs made up 2.4% of all new vehicle registrations—which is 117.4% growth year-over-year.

While it will come as no surprise to anyone that Tesla was the dominant brand of all registered EVs, what may be surprising is that its share is decreasing. Through Q2 2020, Tesla held 79.5% of EV registrations, but that has dropped to 66.3% a year later. The difference is due to gains by brands like Chevrolet, which grew from 8.3% to 9.6% year-over-year, along with growth from Ford (5.2%), Nissan (3.9%) and Audi (3.3%).

A graph showing the percentage of electric vehicle registration by brand

With numerous brands promising new EV models in the coming years, market share will be an interesting trend to monitor.

ICE registration trends

Despite significant growth in the EV market, the reality is, ICEs still made up 97.63% of new vehicle registrations in Q2 2021 and will continue to take up the lion’s share for some time, even as more EV models are introduced.

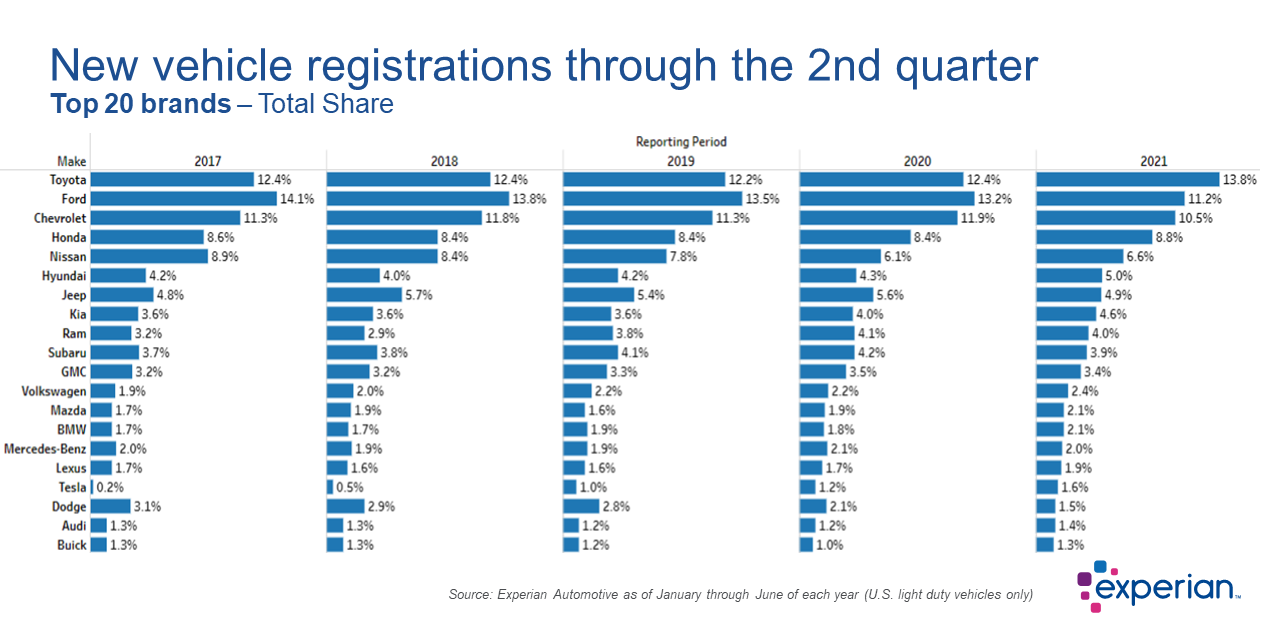
Taking a closer look at the data, we see that Toyota makes up the largest share of new vehicle registrations through the second quarter, making up 13.8% of new vehicle registrations, followed by Ford (11.2%) and Chevrolet (10.5%).

Graph showing new vehicle registration by brand

Crossover vehicles (CUVs) and SUVs continue to be the most popular vehicle segment, growing from 49.5% in Q2 2020 to 53.4% in Q2 2021. The other two most popular segments, sedans and pickups, saw year-over-year decreases. Sedans decreased from 19.4% of new vehicles registered in Q2 2020 to 18.5% in Q2 2021, while trucks declined from 19.9% to 17.3% in the same time frame.

Understanding audiences to market more effectively

Since EVs will remain a small percent of the mix, it’s even more important to understand what’s unique about the consumers who are inclined to purchase them. Leveraging data-based solutions that help identify propensities toward specific vehicle types, such as EVs, can help marketers create messaging that resonates with these consumers, ultimately resulting in a higher return on ad spend.

To learn more about EV and other vehicle registration trends watch the full Automotive Market Trends Review: Q2 2021 webinar.

Related Posts

Lorem ipsum dolor sit amet, consectetur adipiscing elit. Phasellus at nisl nunc. Sed et nunc a erat vestibulum faucibus. Sed fermentum placerat mi aliquet vulputate. In hac habitasse platea dictumst. Maecenas ante dolor, venenatis vitae neque pulvinar, gravida gravida quam. Phasellus tempor rhoncus ante, ac viverra justo scelerisque at. Sed sollicitudin elit vitae est lobortis luctus. Mauris vel ex at metus cursus vestibulum lobortis cursus quam. Donec egestas cursus ex quis molestie. Mauris vel porttitor sapien. Curabitur tempor velit nulla, in tempor enim lacinia vitae. Sed cursus nunc nec auctor aliquam. Morbi fermentum, nisl nec pulvinar dapibus, lectus justo commodo lectus, eu interdum dolor metus et risus. Vivamus bibendum dolor tellus, ut efficitur nibh porttitor nec. Pellentesque habitant morbi tristique senectus et netus et malesuada fames ac turpis egestas. Maecenas facilisis pellentesque urna, et porta risus ornare id. Morbi augue sem, finibus quis turpis vitae, lobortis malesuada erat. Nullam vehicula rutrum urna et rutrum. Mauris convallis ac quam eget ornare. Nunc pellentesque risus dapibus nibh auctor tempor. Nulla neque tortor, feugiat in aliquet eget, tempus eget justo. Praesent vehicula aliquet tellus, ac bibendum tortor ullamcorper sit amet. Pellentesque tempus lacus eget aliquet euismod. Nam quis sapien metus. Nam eu interdum orci. Sed consequat, lectus quis interdum placerat, purus leo venenatis mi, ut ullamcorper dui lorem sit amet nunc. Donec semper suscipit quam eu blandit. Sed quis maximus metus. Nullam efficitur efficitur viverra. Curabitur egestas eu arcu in cursus. H1 asdf asdf H2 H3 H4 Lorem ipsum dolor sit amet, consectetur adipiscing elit. Vestibulum dapibus ullamcorper ex, sed congue massa. Duis at fringilla nisi. Aenean eu nibh vitae quam auctor ultrices. Donec consequat mattis viverra. Morbi sed egestas ante. Vivamus ornare nulla sapien. Integer mollis semper egestas. Cras vehicula erat eu ligula commodo vestibulum. Fusce at pulvinar urna, ut iaculis eros. Pellentesque volutpat leo non dui aliquet, sagittis auctor tellus accumsan. Curabitur nibh mauris, placerat sed pulvinar in, ullamcorper non nunc. Praesent id imperdiet lorem. H5 Curabitur id purus est. Fusce porttitor tortor ut ante volutpat egestas. Quisque imperdiet lobortis justo, ac vulputate eros imperdiet ut. Phasellus erat urna, pulvinar id turpis sit amet, aliquet dictum metus. Fusce et dapibus ipsum, at lacinia purus. Vestibulum euismod lectus quis ex porta, eget elementum elit fermentum. Sed semper convallis urna, at ultrices nibh euismod eu. Cras ultrices sem quis arcu fermentum viverra. Nullam hendrerit venenatis orci, id dictum leo elementum et. Sed mattis facilisis lectus ac laoreet. Nam a turpis mattis, egestas augue eu, faucibus ex. Integer pulvinar ut risus id auctor. Sed in mauris convallis, interdum mi non, sodales lorem. Praesent dignissim libero ligula, eu mattis nibh convallis a. Nunc pulvinar venenatis leo, ac rhoncus eros euismod sed. Quisque vulputate faucibus elit, vitae varius arcu congue et. Ut maximus felis quis diam accumsan suscipit. Etiam tellus erat, ultrices vitae molestie ut, bibendum id ipsum. Aenean eu dolor posuere, tincidunt libero vel, mattis mauris. Aliquam erat volutpat. Sed sit amet placerat nulla. Mauris diam leo, iaculis eget turpis a, condimentum laoreet ligula. Nunc in odio imperdiet, tincidunt velit in, lacinia urna. Aenean ultricies urna tempor, condimentum sem eget, aliquet sapien. Ut convallis cursus dictum. In hac habitasse platea dictumst. Ut eleifend eget erat vitae tempor. Nam tempus pulvinar dui, ac auctor augue pharetra nec. Sed magna augue, interdum a gravida ac, lacinia quis erat. Pellentesque fermentum in enim at tempor. Proin suscipit, odio ut lobortis semper, est dolor maximus elit, ac fringilla lorem ex eu mauris. Phasellus vitae elit et dui fermentum ornare. Vestibulum non odio nec nulla accumsan feugiat nec eu nibh. Cras tincidunt sem sed lacinia mollis. Vivamus augue justo, placerat vel euismod vitae, feugiat at sapien. Maecenas sed blandit dolor. Maecenas vel mauris arcu. Morbi id ligula congue, feugiat nisl nec, vulputate purus. Nunc nec aliquet tortor. Maecenas interdum lectus a hendrerit tristique. Ut sit amet feugiat velit. Test Yes asedtsdfd asdf asdf adsf Related Posts

Published: March 1, 2025 by Jon Mostajo, test user

With the National Automobile Dealers Association (NADA) Show set to kickoff later this week, it seemed fitting to explore how the shifting dynamics of the used vehicle market might impact dealers and buyers over the coming year. Shedding light on some of the registration and finance trends, as well as purchasing behaviors, can help dealers and manufacturers stay ahead of the curve. And just like that, the Special Report: Automotive Consumer Trends Report was born. As I was sifting through the data, one of the trends that stood out to me was the neck-and-neck race between Millennials and Gen X for supremacy in the used vehicle market. Five years ago, in 2019, Millennials were responsible for 33.3% of used retail registrations, followed by Gen X (29.5%) and Baby Boomers (26.8%). Since then, Baby Boomers have gradually fallen off, and Gen X continues to close the already minuscule gap. Through October 2024, Millennials accounted for 31.6%, while Gen X accounted for 30.4%. But trends can turn on a dime if the last year offers any indication. Over the last rolling 12 months (October 2023-October 2024), Gen X (31.4%) accounted for the majority of used vehicle registrations compared to Millennials (30.9%). Of course, the data is still close, and what 2025 holds is anyone’s guess, but understanding even the smallest changes in market share and consumer purchasing behaviors can help dealers and manufacturers adapt and navigate the road ahead. Although there are similarities between Millennials and Gen X, there are drastic differences, including motivations and preferences. Dealers and manufacturers should engage them on a generational level. What are they buying? Some of the data might not come as a surprise but it’s a good reminder that consumers are in different phases of life, meaning priorities change. Over the last rolling 12 months, Millennials over-indexed on used vans, accounting for more than one-third of registrations. Meanwhile, Gen X over-indexed on used trucks, making up nearly one-third of registrations, and Gen Z over-indexed on cars (accounting for 17.1% of used car registrations compared to 14.6% of overall used vehicle registrations). This isn’t surprising. Many Millennials have young families and may need extra space and functionality, while Gen Xers might prefer the versatility of the pickup truck—the ability to use it for work and personal use. On the other hand, Gen Zers are still early in their careers and gravitate towards the affordability and efficiency of smaller cars. Interestingly, although used electric vehicles only make up a small portion of used retail registrations (less than 1%), Millennials made up nearly 40% over the last rolling 12 months, followed by Gen X (32.2%) and Baby Boomers (15.8%). The market at a bird’s eye view Pulling back a bit on the used vehicle landscape, over the last rolling 12 months, CUVs/SUVs (38.9%) and cars (36.6%) accounted for the majority of used retail registrations. And nearly nine-in-ten used registrations were non-luxury vehicles. What’s more, ICE vehicles made up 88.5% of used retail registrations over the same period, while alternative-fuel vehicles (not including BEVs) made up 10.7% and electric vehicles made up 0.8%. At the finance level, we’re seeing the market shift ever so slightly. Since the beginning of the pandemic, one of the constant narratives in the industry has been the rising cost of owning a vehicle, both new and used. And while the average loan amount for a used non-luxury vehicle has gone up over the past five years, we’re seeing a gradual decline since 2022. In 2019, the average loan amount was $22,636 and spiked $29,983 in 2022. In 2024, the average loan amount reached $28,895. Much of the decline in average loan amounts can be attributed to the resurgence of new vehicle inventory, which has resulted in lower used values. With new leasing climbing over the past several quarters, we may see more late-model used inventory hit the market in the next few years, which will most certainly impact used financing. The used market moving forward Relying on historical data and trends can help dealers and manufacturers prepare and navigate the road ahead. Used vehicles will always fit the need for shoppers looking for their next vehicle; understanding some market trends will help ensure dealers and manufacturers can be at the forefront of helping those shoppers. For more information on the Special Report: Automotive Consumer Trends Report, visit Experian booth #627 at the NADA Show in New Orleans, January 23-26.

Published: January 21, 2025 by Kirsten Von Busch

Electric vehicles (EVs) are the topic of conversation in the automotive industry, but we’re continuing to see another fuel type pick up speed. With consumer demand shifting and drivers exploring more fuel-efficient options, the automotive market is leaning back into hybrids. In fact, new retail hybrid registrations grew to 11.5% through Q3 2024, from 9.5% through Q3 2023, according to Experian’s Automotive Market Trends Report: Q3 2024. Meanwhile, EVs increased from 7.7% to 8.2% year-over-year and gasoline vehicles declined to 70.4% this year, from 72.7% last year. Despite EVs gaining notable attention over recent years, some consumers may be factoring in the benefits of opting for a hybrid, such as the convenience of driving a longer distance without facing challenges as charging stations remain limited. As more manufacturers adapt to consumer needs and roll out additional vehicles, data shows 9.1% of 2024 model year vehicles in operation were attributed to hybrids, while 6.2% of 2024 model years were EVs through Q3 2024. Having more models enter the market has shifted the hybrid and plug-in hybrid electric vehicle (PHEV) market share, with the Toyota Camry making up 12.5% of the market share this quarter, a notable increase from 2.4% last year. On the other hand, the Jeep Wrangler 4xe went from having 4.5% of market share last year to 2.4% through Q3 2024. With many consumers continuing to have some concerns around EVs such as range anxiety and charging times, they’re seeking a more practical solution for their daily driving needs. The balance of fuel options provides more convenience—making hybrids an appealing choice for those wanting an EV alternative. It’s important for manufacturers to stay ahead of the competitive market as it’s constantly evolving. Leveraging the most current data can provide solutions that address both feasibility and consumer preference. To learn more about vehicle market trends, view the full Automotive Market Trends Report: Q3 2024 presentation on demand.

Published: January 10, 2025 by John Howard