At A Glance
It was popularised in the 1960s with the release of Letraset sheets containing Lorem Ipsum passages, and more recently with desktop publishing software like Aldus PageMaker including versions of Lorem Ipsum.Paragraph Block- is simply dummy text of the printing and typesetting industry. Lorem Ipsum has been the industry’s standard dummy text ever since the 1500s, when an unknown printer took a galley of type and scrambled it to make a type specimen book. It has survived not only five centuries, but also the leap into electronic typesetting, remaining essentially unchanged. It was popularised in the 1960s with the release of Letraset sheets containing Lorem Ipsum passages, and more recently with desktop publishing software like Aldus PageMaker including versions of Lorem Ipsum.
New Text!

Heading 2
Heading 3
Heading 4
Heading 5
- This is a list
- Item 1
- Item 2
- Sub list
- Sub list 2
- Sub list 3
- More list
- More list 2
- More list 3
- More more
- More more
This is the pull quote block Lorem Ipsumis simply dummy text of the printing and typesetting industry. Lorem Ipsum has been the industry’s standard dummy text ever since the 1500s,
ExperianThis is the citation

This is the pull quote block Lorem Ipsumis simply dummy text of the printing and typesetting industry. Lorem Ipsum has been the industry’s standard dummy text ever since the 1500s,
ExperianThis is the citation
| Table element | Table element | Table element |
| my table | my table | my table |
| Table element | Table element | Table element |

Media Text Block
of the printing and typesetting industry. Lorem Ipsum has been the industry’s standard dummy text ever since the 1500s, when an unknown printer took a galley of type and scrambled it to make a type specimen book. It has survived not only five centuries, but also the leap into electronic typesetting, remaining essentially unchanged. It was popularised in the 1960s with the release of Letraset sheets containing Lorem Ipsum passages, and more recently with desktop publishing software like Aldus PageMaker including versions of Lorem Ipsum
My Small H5 Title

My first column title
Many desktop publishing packages and web page editors now use Lorem Ipsum as their default model text, and a search for ‘lorem ipsum’ will uncover many web sites still in their infancy.

My second column title
Many desktop publishing packages and web page editors now use Lorem Ipsum as their default model text, and a search for ‘lorem ipsum’ will uncover many web sites still in their infancy.
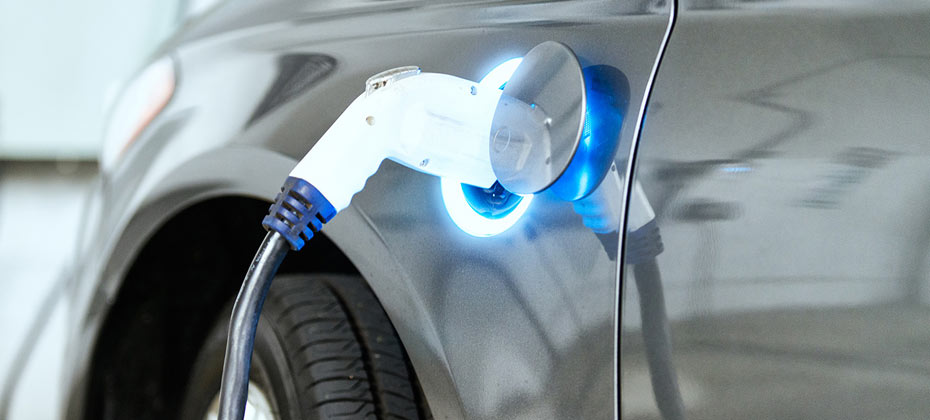
In late September, California announced a new requirement for the sale of all new passenger vehicles to be zero-emission by 2035. While that’s still 15 years away, the executive order created quite a buzz in the automotive industry, reigniting conversations about electric vehicles (EVs) and the current market penetration of the most common zero-emission vehicles. With that in mind, we wanted to take a closer look at the state of EVs—across the country and more specifically, in California—to better understand the EV market and how it’s grown over the past few years. As of Q2 2020, electric vehicles comprised just 0.312% of vehicles in operation (VIO). While EV market share seems small, there has been significant growth since Q2 2015, when they only held 0.0678% of the VIO market—meaning the growth of EVs has more than tripled (3.6x) in the last five years. But even still, other segments, such as CUVs have seen faster growth in the same time period (10% market share in Q2 2020 compared to 6.2% in Q2 2015). California sees faster EV adoption California has seen growth in EV adoption in the last decade, but it has grown exponentially in the last five years. EVs comprised 1.79% of new vehicle registrations 2015, and the percentage grew to 5.32% as of Q2 2020. Much of the growth occurred between 2017 and 2018, when market share jumped from 2.62% to 5.04% year-over-year, with the introduction of the more cost-effective Tesla Model 3. Even with that growth, California new vehicle purchases have a long way to grow to move up to 100% EV. With the popularity of the Model 3, it’s somewhat unsurprising, Tesla holds the lion’s share of the EV market in California, making up 61.9% of EVs on the road within VIO, and nationally at 64.8% share. That could potentially change down the road though. Over the next two years, numerous manufacturers have plans to introduce electric versions of popular models or introduce new EV models altogether. This not only creates competition but could also help continue to drive down vehicle cost, making EVs a more viable option for consumers. Examining costs and other factors Cost is one of the key considerations that industry experts have routinely brought up over the years as a barrier to EV adoption. While some say that maintenance and fuel are cheaper in the long run, purchasing an EV today is typically a more expensive option at the dealership. The average loan amount for an EV in California in 2019 was $40,964, compared to an average vehicle loan amount of $32,373. That said, as EV adoption has seen exponential growth in the last five years, the average price has reduced. The average loan amount for an EV in 2016 was $78,646, dropping more than $35,000 in just five years as the technology continued to mature and vehicle costs lowered. Additionally, tax incentives, particularly in California, have also helped reduce affordability concerns. Though today’s tax incentives may not be in place through 2035, California will likely need to evaluate if economic incentives are required along the way to achieving the zero-emission vehicle deadline. However, even as costs lower, there are additional challenges to be overcome. For instance, infrastructure continues to be a barrier to adoption. In a 2019 AAA study, concern over being able to find a place to charge is the top reason listed as to why respondents are unlikely to purchase an EV in the future. In addition, according to Statisa, in March 2020, the U.S. had almost 25,000 charging stations for plug-in electric vehicles, and approximately 78,500 charging outlets. Of those charging stations, nearly 30% are in California. But with continued growth of EV sales, there will be a critical need for continued infrastructure nationwide—not just in California. In addition to these considerations, many impacts of the new mandate remain unknown. California will have to navigate increased electricity demand—especially during peak hours—and increases in battery scrappage, as EVs wear out. Gas stations will need to manage a loss of revenue, while changes in fuel taxes are likely, and vehicle technicians will require new training. If increased adoption of zero emission vehicles is California’s long-term goal, this could also impact the popularity of used vehicles, which could leave dealers looking for alternative locations to sell their gasoline-powered inventory. Looking toward the future of EVs Realistically, with 15 years until the mandate takes effect, the California mandate won’t have much of an immediate effect on the industry. But it does highlight key considerations for automakers and the aftermarket moving forward. To achieve better adoption rates, automakers need to understand the barriers to success and how they impact consumer behavior. An example of this is how California has seen higher EV adoption rates as the availability of plug-in stations has increased. Continuing to find ways to lower costs and focusing on savings over the lifetime of the vehicle is will help consumers see the value of an EV. At the end of the day, automakers play a large role in moving the country toward EV adoption, so having a clear understanding of the trends can help refine strategies as we move toward an electrified future.

While the automotive industry initially took a hit at the onset of COVID-19, things are beginning to rebound. New vehicle registrations are still down compared to 2019, however, the year-over-year comparisons by month are starting to level out. And, while most of the attention has been paid to new registration figures, we can’t lose sight of the vehicles on the road. Some consumers acted to take advantage of automaker incentives and low interest rates, and others purchased due to newfound needs, but the vast majority have stuck with their current vehicle. That means, despite some bumps over the past few months, opportunity for the aftermarket and dealer service departments to thrive by keeping these vehicles on the road still exists. It starts with understanding what’s on the road. Insight into these vehicles will better position aftermarket suppliers and repairs shops to perform scheduled maintenance and address the needs of drivers. According to Experian’s Q2 2020 Market Trends Review, there were 280.6 million vehicles in operation, up from 278.1 million a year ago. Of those vehicles on the road, light-duty trucks accounted for 56.5%, and passenger cars made up the remaining 43.5%. So, there’s little surprise that the top three segments on the road were full-sized pick-ups (16%), CUVs (10%) and mid-range cars (9.9%). And if we break it down even further, the top three brands were Ford (15.5%), Chevrolet (14.3%) and Toyota (12.1%). But we understand that not all 280.6 million vehicles will need aftermarket parts or service; it’s important for the industry to keep a close eye on the aftermarket “sweet spot”—those vehicles that are six- to 12-years old. Identifying these vehicles and anticipating their maintenance needs will help aftermarket suppliers navigate the recovery. In Q2 2020, 31.2% (87.6 million) of vehicles in operation fell within the “sweet spot”—with a mix nearly 46% domestic and 54% import brands. And while the opportunity today is significant, we expect the “sweet spot” to continue to grow for at least the next four years. To make the most of the opportunity, aftermarket suppliers need to understand where these vehicles are located, what types of vehicles fall within the sweet spot and the most common parts that are used. COVID-19 has shifted the industry for all parties involved. Some consumers may opt to hold onto their vehicles a little bit longer rather than purchase a vehicle; only time will tell. In any event, the more aftermarket suppliers and repair shops understand about the vehicles on the road, the better positioned they will be to address the needs of consumers and grow business. To view Experian’s full Q2 2020 Market Trends Review, click here.

For fintechs who were already challenging existing business models, COVID-19 suddenly accelerated financial services innovation into overdrive.
Lorem ipsum dolor sit amet, consectetur adipiscing elit. Phasellus at nisl nunc. Sed et nunc a erat vestibulum faucibus. Sed fermentum placerat mi aliquet vulputate. In hac habitasse platea dictumst. Maecenas ante dolor, venenatis vitae neque pulvinar, gravida gravida quam. Phasellus tempor rhoncus ante, ac viverra justo scelerisque at. Sed sollicitudin elit vitae est lobortis luctus. Mauris vel ex at metus cursus vestibulum lobortis cursus quam. Donec egestas cursus ex quis molestie. Mauris vel porttitor sapien. Curabitur tempor velit nulla, in tempor enim lacinia vitae. Sed cursus nunc nec auctor aliquam. Morbi fermentum, nisl nec pulvinar dapibus, lectus justo commodo lectus, eu interdum dolor metus et risus. Vivamus bibendum dolor tellus, ut efficitur nibh porttitor nec. Pellentesque habitant morbi tristique senectus et netus et malesuada fames ac turpis egestas. Maecenas facilisis pellentesque urna, et porta risus ornare id. Morbi augue sem, finibus quis turpis vitae, lobortis malesuada erat. Nullam vehicula rutrum urna et rutrum. Mauris convallis ac quam eget ornare. Nunc pellentesque risus dapibus nibh auctor tempor. Nulla neque tortor, feugiat in aliquet eget, tempus eget justo. Praesent vehicula aliquet tellus, ac bibendum tortor ullamcorper sit amet. Pellentesque tempus lacus eget aliquet euismod. Nam quis sapien metus. Nam eu interdum orci. Sed consequat, lectus quis interdum placerat, purus leo venenatis mi, ut ullamcorper dui lorem sit amet nunc. Donec semper suscipit quam eu blandit. Sed quis maximus metus. Nullam efficitur efficitur viverra. Curabitur egestas eu arcu in cursus. H1 asdf asdf H2 H3 H4 Lorem ipsum dolor sit amet, consectetur adipiscing elit. Vestibulum dapibus ullamcorper ex, sed congue massa. Duis at fringilla nisi. Aenean eu nibh vitae quam auctor ultrices. Donec consequat mattis viverra. Morbi sed egestas ante. Vivamus ornare nulla sapien. Integer mollis semper egestas. Cras vehicula erat eu ligula commodo vestibulum. Fusce at pulvinar urna, ut iaculis eros. Pellentesque volutpat leo non dui aliquet, sagittis auctor tellus accumsan. Curabitur nibh mauris, placerat sed pulvinar in, ullamcorper non nunc. Praesent id imperdiet lorem. H5 Curabitur id purus est. Fusce porttitor tortor ut ante volutpat egestas. Quisque imperdiet lobortis justo, ac vulputate eros imperdiet ut. Phasellus erat urna, pulvinar id turpis sit amet, aliquet dictum metus. Fusce et dapibus ipsum, at lacinia purus. Vestibulum euismod lectus quis ex porta, eget elementum elit fermentum. Sed semper convallis urna, at ultrices nibh euismod eu. Cras ultrices sem quis arcu fermentum viverra. Nullam hendrerit venenatis orci, id dictum leo elementum et. Sed mattis facilisis lectus ac laoreet. Nam a turpis mattis, egestas augue eu, faucibus ex. Integer pulvinar ut risus id auctor. Sed in mauris convallis, interdum mi non, sodales lorem. Praesent dignissim libero ligula, eu mattis nibh convallis a. Nunc pulvinar venenatis leo, ac rhoncus eros euismod sed. Quisque vulputate faucibus elit, vitae varius arcu congue et. Ut maximus felis quis diam accumsan suscipit. Etiam tellus erat, ultrices vitae molestie ut, bibendum id ipsum. Aenean eu dolor posuere, tincidunt libero vel, mattis mauris. Aliquam erat volutpat. Sed sit amet placerat nulla. Mauris diam leo, iaculis eget turpis a, condimentum laoreet ligula. Nunc in odio imperdiet, tincidunt velit in, lacinia urna. Aenean ultricies urna tempor, condimentum sem eget, aliquet sapien. Ut convallis cursus dictum. In hac habitasse platea dictumst. Ut eleifend eget erat vitae tempor. Nam tempus pulvinar dui, ac auctor augue pharetra nec. Sed magna augue, interdum a gravida ac, lacinia quis erat. Pellentesque fermentum in enim at tempor. Proin suscipit, odio ut lobortis semper, est dolor maximus elit, ac fringilla lorem ex eu mauris. Phasellus vitae elit et dui fermentum ornare. Vestibulum non odio nec nulla accumsan feugiat nec eu nibh. Cras tincidunt sem sed lacinia mollis. Vivamus augue justo, placerat vel euismod vitae, feugiat at sapien. Maecenas sed blandit dolor. Maecenas vel mauris arcu. Morbi id ligula congue, feugiat nisl nec, vulputate purus. Nunc nec aliquet tortor. Maecenas interdum lectus a hendrerit tristique. Ut sit amet feugiat velit. Test Yes asedtsdfd asdf asdf adsf Related Posts

With the National Automobile Dealers Association (NADA) Show set to kickoff later this week, it seemed fitting to explore how the shifting dynamics of the used vehicle market might impact dealers and buyers over the coming year. Shedding light on some of the registration and finance trends, as well as purchasing behaviors, can help dealers and manufacturers stay ahead of the curve. And just like that, the Special Report: Automotive Consumer Trends Report was born. As I was sifting through the data, one of the trends that stood out to me was the neck-and-neck race between Millennials and Gen X for supremacy in the used vehicle market. Five years ago, in 2019, Millennials were responsible for 33.3% of used retail registrations, followed by Gen X (29.5%) and Baby Boomers (26.8%). Since then, Baby Boomers have gradually fallen off, and Gen X continues to close the already minuscule gap. Through October 2024, Millennials accounted for 31.6%, while Gen X accounted for 30.4%. But trends can turn on a dime if the last year offers any indication. Over the last rolling 12 months (October 2023-October 2024), Gen X (31.4%) accounted for the majority of used vehicle registrations compared to Millennials (30.9%). Of course, the data is still close, and what 2025 holds is anyone’s guess, but understanding even the smallest changes in market share and consumer purchasing behaviors can help dealers and manufacturers adapt and navigate the road ahead. Although there are similarities between Millennials and Gen X, there are drastic differences, including motivations and preferences. Dealers and manufacturers should engage them on a generational level. What are they buying? Some of the data might not come as a surprise but it’s a good reminder that consumers are in different phases of life, meaning priorities change. Over the last rolling 12 months, Millennials over-indexed on used vans, accounting for more than one-third of registrations. Meanwhile, Gen X over-indexed on used trucks, making up nearly one-third of registrations, and Gen Z over-indexed on cars (accounting for 17.1% of used car registrations compared to 14.6% of overall used vehicle registrations). This isn’t surprising. Many Millennials have young families and may need extra space and functionality, while Gen Xers might prefer the versatility of the pickup truck—the ability to use it for work and personal use. On the other hand, Gen Zers are still early in their careers and gravitate towards the affordability and efficiency of smaller cars. Interestingly, although used electric vehicles only make up a small portion of used retail registrations (less than 1%), Millennials made up nearly 40% over the last rolling 12 months, followed by Gen X (32.2%) and Baby Boomers (15.8%). The market at a bird’s eye view Pulling back a bit on the used vehicle landscape, over the last rolling 12 months, CUVs/SUVs (38.9%) and cars (36.6%) accounted for the majority of used retail registrations. And nearly nine-in-ten used registrations were non-luxury vehicles. What’s more, ICE vehicles made up 88.5% of used retail registrations over the same period, while alternative-fuel vehicles (not including BEVs) made up 10.7% and electric vehicles made up 0.8%. At the finance level, we’re seeing the market shift ever so slightly. Since the beginning of the pandemic, one of the constant narratives in the industry has been the rising cost of owning a vehicle, both new and used. And while the average loan amount for a used non-luxury vehicle has gone up over the past five years, we’re seeing a gradual decline since 2022. In 2019, the average loan amount was $22,636 and spiked $29,983 in 2022. In 2024, the average loan amount reached $28,895. Much of the decline in average loan amounts can be attributed to the resurgence of new vehicle inventory, which has resulted in lower used values. With new leasing climbing over the past several quarters, we may see more late-model used inventory hit the market in the next few years, which will most certainly impact used financing. The used market moving forward Relying on historical data and trends can help dealers and manufacturers prepare and navigate the road ahead. Used vehicles will always fit the need for shoppers looking for their next vehicle; understanding some market trends will help ensure dealers and manufacturers can be at the forefront of helping those shoppers. For more information on the Special Report: Automotive Consumer Trends Report, visit Experian booth #627 at the NADA Show in New Orleans, January 23-26.
The automotive industry is constantly changing. Shifting consumer demands and preferences, as well as dynamic economic factors, make the need for data-driven insights more important than ever. As we head into the National Automobile Dealers Association (NADA) Show this week, we wanted to explore some of the trends in the used vehicle market in our Special Report: State of the Automotive Finance Market Report. Packed with valuable insights and the latest trends, we’ll take a deep dive into the multi-faceted used vehicle market and better understand how consumers are financing used vehicles. 9+ model years grow Although late-model vehicles tend to represent much of the used vehicle finance market, we were surprised by the gradual growth of 9+ model year (MY) vehicles. In 2019, 9+MY vehicles accounted for 26.6% of the used vehicle sales. Since then, we’ve seen year-over-year growth, culminating with 9+MY vehicles making up a little more than 30% of used vehicle sales in 2024. Perhaps more interesting though, is who is financing these vehicles. Five years ago, prime and super prime borrowers represented 42.5% of 9+MY vehicles, however, in 2024, those consumers accounted for nearly 54% of 9+MY originations. Among the more popular 9+MY segments, CUVs and SUVs comprised 36.9% of sales in 2024, up from 35.2% in 2023, while cars went from 44.3% to 42.9% year-over-year and pickup trucks decreased from 15.9% to 15.6%. 2024 highlights by used vehicle age group To get a better sense of the overall used market, the segments were broken down into three age groups—9+MY, 4-8MY, and current +3MY—and to no surprise, the finance attributes vary widely. While we’ve seen the return of new vehicle inventory drive used vehicle values lower, it could be a sign that consumers are continuing to seek out affordable options that fit their lifestyle. In fact, the average loan amount for a 9+MY vehicle was $19,376 in 2024, compared to $24,198 for a vehicle between 4-8 years old and $32,381 for +3MY vehicle. Plus, more than 55% of 9+MY vehicles have monthly payments under $400. That’s not an insignificant number for people shopping with the monthly payment in mind. In 2024, the average monthly payment for a used vehicle that falls under current+3MY was $608. Meanwhile, 4-8MY vehicles came in at an average monthly payment of $498, and 9+MY vehicles had a $431 monthly payment. Taking a deeper dive into average loan amounts based on specific vehicle types—as of 2024, current +3MY cars came in at $28,721, followed by CUVs/SUVs ($31,589) and pickup trucks ($40,618). As for 4-8MY vehicles, cars came in with a loan amount of $22,013, CUVs/SUVs were at $23,133, and pickup trucks at $31,114. Used 9+MY cars had a loan amount of $19,506, CUVs/SUVs came in at $17,350, and pickup trucks at $22,369. With interest rates remaining top of mind for most consumers as we’ve seen them increase in recent years, understanding the growth from 2019-2024 can give a holistic picture of how the market has shifted over time. For instance, the average interest rate for a used current+3MY vehicle was 8.0% in 2019 and grew to 10.2% in 2024, the average rate for a 4-8MY vehicle went from 10.3% to 12.9%, and the average rate for a 9+MY vehicle increased from 11.4% to 13.8% in the same time frame. Looking ahead to the used vehicle market It’s important for automotive professionals to understand and leverage the data of the used market as it can provide valuable insights into trending consumer behavior and pricing patterns. While we don’t exactly know where the market will stand in a few years—adapting strategies based on historical data and anticipating shifts can help professionals better prepare for both challenges and opportunities in the future. As used vehicles remain a staple piece of the automotive industry, making informed decisions and optimizing inventory management will ensure agility as the market continues to shift. For more information, visit us at the Experian booth (#627) during the NADA Show in New Orleans from January 23-26.
In this article…
typesetting, remaining essentially unchanged. It was popularised in the 1960s with the release of Letraset sheets containing Lorem Ipsum passages, and more recently with desktop publishing software like Aldus PageMaker including versions of Lorem Ipsum.