At A Glance
It was popularised in the 1960s with the release of Letraset sheets containing Lorem Ipsum passages, and more recently with desktop publishing software like Aldus PageMaker including versions of Lorem Ipsum.Paragraph Block- is simply dummy text of the printing and typesetting industry. Lorem Ipsum has been the industry’s standard dummy text ever since the 1500s, when an unknown printer took a galley of type and scrambled it to make a type specimen book. It has survived not only five centuries, but also the leap into electronic typesetting, remaining essentially unchanged. It was popularised in the 1960s with the release of Letraset sheets containing Lorem Ipsum passages, and more recently with desktop publishing software like Aldus PageMaker including versions of Lorem Ipsum.
New Text!

Heading 2
Heading 3
Heading 4
Heading 5
- This is a list
- Item 1
- Item 2
- Sub list
- Sub list 2
- Sub list 3
- More list
- More list 2
- More list 3
- More more
- More more
This is the pull quote block Lorem Ipsumis simply dummy text of the printing and typesetting industry. Lorem Ipsum has been the industry’s standard dummy text ever since the 1500s,
ExperianThis is the citation

This is the pull quote block Lorem Ipsumis simply dummy text of the printing and typesetting industry. Lorem Ipsum has been the industry’s standard dummy text ever since the 1500s,
ExperianThis is the citation
| Table element | Table element | Table element |
| my table | my table | my table |
| Table element | Table element | Table element |

Media Text Block
of the printing and typesetting industry. Lorem Ipsum has been the industry’s standard dummy text ever since the 1500s, when an unknown printer took a galley of type and scrambled it to make a type specimen book. It has survived not only five centuries, but also the leap into electronic typesetting, remaining essentially unchanged. It was popularised in the 1960s with the release of Letraset sheets containing Lorem Ipsum passages, and more recently with desktop publishing software like Aldus PageMaker including versions of Lorem Ipsum
My Small H5 Title

My first column title
Many desktop publishing packages and web page editors now use Lorem Ipsum as their default model text, and a search for ‘lorem ipsum’ will uncover many web sites still in their infancy.

My second column title
Many desktop publishing packages and web page editors now use Lorem Ipsum as their default model text, and a search for ‘lorem ipsum’ will uncover many web sites still in their infancy.
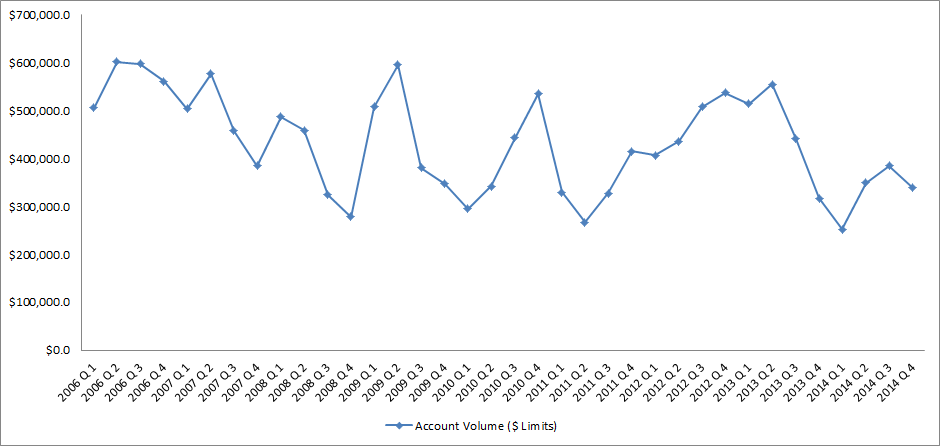
Source: IntelliViewsm powered by Experian Sales of existing homes dropped 50% from the peak in August 2005 to the low point in July 2010. The spike in home sales in late 2009 and early 2010 was due to the large number of foreclosure sales as well as very low prices. Since 2010, sales have increased to almost to the level they were in 2000, before the financial crisis. However, the homeownership rate has steadily gone down. How could sales have picked up while the homeownership rate declined? Investors have entered the market snapping up single family homes and renting them. Therefore, the recent good news in the existing home market has been driven by investors, not homeowners. But as I point out below, this is changing. Looking at the homeownership rate by age, shown in the table below, it is clear that since the crisis the rate has declined most for people under 45. The potential for marketing is greatest in this cohort as the numbers indicate a likely demand for housing. Homeownership Rate by Age Source: U.S. Census Bureau and Haver Analytics as reported on the Federal Reserve Bank of St. Louis Fred database The factors that have impeded growth, described above, are beginning to reverse which, along with pent-up demand, will present an opportunity for mortgage originators in 2015. Home prices have risen in 246 of the 277 cities tracked by Clear Capital.With prices going up, investors have begun to back away from the market, resulting in prices increasing at a slower rate in some cities but they are still increasing.Therefore the perception that homeownership is risky will likely change.In fact, in some areas, such as California’s coastal cities, sales are strong and prices are going up rapidly. Lenders and regulators are recognizing that the stringent guidelines put in place in reaction to the crisis have overly constrained the market.Fannie Mae and Freddie Mac are reducing down payment requirements to as low as 3%.FHA is lowering their guarantee fee, reducing the amount of cash buyers need to close transactions.Private securitizations, which dried up completely, are beginning to reappear, especially in the jumbo market. As unemployment continues to go down, consumer confidence will rise and household formation will return to more normal levels which result in more sales to first time homebuyers, who drive the market.According to Lawrence Yun, chief economist for the National Association of Realtors, “…it’s all about consistent job growth for a prolonged period, and we’re entering that stage.” The number of houses in foreclosure, according to RealtyTrac, has fallen to pre-crisis levels.This drag on the market has, for the most part, cleared and as prices continue to inflate, potential buyers will be motivated to buy before homes become unaffordable.Despite the recent increases, home prices are still, on average, 23% lower than they were at the peak. Focusing marketing dollars on those people with the highest propensity to buy has always been a challenge but in this market there are identifiable targets. “Boomerangs” are people who owned real estate in the past but are currently renting and likely to come back into the market.Marketing to qualified former homeowners would provide a solid return on investment. People renting single family houses are indicating a lifestyle preference that can be marketed to. Newly-formed households are also profitable targets. The housing market, at long last, appears to be finally turning the corner and normalizing. Experian’s expertise in identifying the right consumers can help lenders to pinpoint the right people on whom marketing dollars should be invested to realize the highest level of return. Click here to learn more.

Cont. Understanding Gift Card Fraud By: Angie Montoya In part one, we spoke about what an amazing deal gift cards (GCs) are, and why they are incredibly popular among consumers. Today we are going to dive deeper and see why fraudsters love gift cards and how they are taking advantage of them. We previously mentioned that it’s unlikely a fraudster is the actual person that redeems a gift card for merchandise. Although it is true that some fraudsters may occasionally enjoy a latte or new pair of shoes on us, it is much more lucrative for them to turn these forms of currency into cold hard cash. Doing this also shifts the risk onto an unsuspecting victim and off of the fraudster. For the record, it’s also incredibly easy to do. All of the innovation that was used to help streamline the customer experience has also helped to streamline the fraudster experience. The websites that are used to trade unredeemed cards for other cards or cash are the same websites used by fraudsters. Although there are some protections for the customer on the trading sites, the website host is usually left holding the bag when they have paid out for a GC that has been revoked because it was purchased with stolen credit card information. Others sites, like Craigslist and social media yard sale groups, do not offer any sort of consumer protection, so there is no recourse for the purchaser. What seems like a great deal— buying a GC at a discounted rate— could turn out to be a devalued Gift card with no balance, because the merchant caught on to the original scheme. There are ten states in the US that have passed laws surrounding the cashing out of gift cards. * These laws enable consumers to go to a physical store location and receive, in cash, the remaining balance of a gift card. Most states impose a limit of $5, but California has decided to be a little more generous and extend that limit to $10. As a consumer, it’s a great benefit to be able to receive the small remaining balance in cash, a balance that you will likely forget about and might never use, and the laws were passed with this in mind. Unfortunately, fraudsters have zeroed in on this benefit and are fully taking advantage of it. We have seen a host of merchants experiencing a problem with fraudulently obtained GCs being cashed out in California locations, specifically because they have a higher threshold. While five dollars here and ten dollars there does not seem like it is very much, it adds up when you realize that this could be someone’s full time job. Cashing out three ten dollar cards would take on average 15 minutes. Over the course of a 40-hour workweek it can turn into a six-figure salary. At this point, you might be asking yourself how fraudsters obtain these GCs in the first place. That part is also fairly easy. User credentials and account information is widely available for purchase in underground forums, due in part to the recent increase in large-scale data breaches. Once these credentials have been obtained, they can do one of several things: Put card data onto a dummy card and use it in a physical store Use credit card data to purchase on any website Use existing credentials to log in to a site and purchase with stored payment information Use existing credentials to log in to an app and trigger auto-reloading of accounts, then transfer to a GC With all of these daunting threats, what can a merchant do to protect their business? First, you want to make sure your online business is screening for both the purchase and redemption of gift cards, both electronic and physical. When you screen for the purchase of GCs, you want to look for things like the quantity of cards purchased, the velocity of orders going to a specific shipping address or email, and velocity of devices being used to place multiple orders. You also want to monitor the redemption of loyalty rewards, and any traffic that goes into these accounts. Loyalty fraud is a newer type of fraud that has exploded because these channels are not normally monitored for fraud— there is no actual financial loss, so priority has been placed elsewhere in the business. However, loyalty points can be redeemed for gift cards, or sold on the black market, and the downstream affect is that it can inconvenience your customer and harm your brand’s image. Additionally, if you offer physical GCs, you want to have a scratch off PIN on the back of the card. If a GC is offered with no PIN, fraudsters can walk into a store, take a picture of the different card numbers, and then redeem online once the cards have been activated. Fraudsters will also tumble card numbers once they have figured out the numerical sequence of the cards. Using a PIN prevents both of these problems. The use of GCs is going to continue to increase in the coming years— this is no surprise. Mobile will continue to be incorporated with these offerings, and answering security challenges will be paramount to their success. Although we are in the age of the data breach, there is no reason that the experience of purchasing or redeeming a gift card should be hampered by overly cautious fraud checks. It’s possible to strike the right balance— grow your business securely by implementing a fraud solution that is fraud minded AND customer centric. *The use of GC/eGC is used interchangeably
End-of-draw approaching for many home equity lines of credit (HELOCs) originated during the U.S. housing boom period of 2006 – 2008
Lorem ipsum dolor sit amet, consectetur adipiscing elit. Phasellus at nisl nunc. Sed et nunc a erat vestibulum faucibus. Sed fermentum placerat mi aliquet vulputate. In hac habitasse platea dictumst. Maecenas ante dolor, venenatis vitae neque pulvinar, gravida gravida quam. Phasellus tempor rhoncus ante, ac viverra justo scelerisque at. Sed sollicitudin elit vitae est lobortis luctus. Mauris vel ex at metus cursus vestibulum lobortis cursus quam. Donec egestas cursus ex quis molestie. Mauris vel porttitor sapien. Curabitur tempor velit nulla, in tempor enim lacinia vitae. Sed cursus nunc nec auctor aliquam. Morbi fermentum, nisl nec pulvinar dapibus, lectus justo commodo lectus, eu interdum dolor metus et risus. Vivamus bibendum dolor tellus, ut efficitur nibh porttitor nec. Pellentesque habitant morbi tristique senectus et netus et malesuada fames ac turpis egestas. Maecenas facilisis pellentesque urna, et porta risus ornare id. Morbi augue sem, finibus quis turpis vitae, lobortis malesuada erat. Nullam vehicula rutrum urna et rutrum. Mauris convallis ac quam eget ornare. Nunc pellentesque risus dapibus nibh auctor tempor. Nulla neque tortor, feugiat in aliquet eget, tempus eget justo. Praesent vehicula aliquet tellus, ac bibendum tortor ullamcorper sit amet. Pellentesque tempus lacus eget aliquet euismod. Nam quis sapien metus. Nam eu interdum orci. Sed consequat, lectus quis interdum placerat, purus leo venenatis mi, ut ullamcorper dui lorem sit amet nunc. Donec semper suscipit quam eu blandit. Sed quis maximus metus. Nullam efficitur efficitur viverra. Curabitur egestas eu arcu in cursus. H1 asdf asdf H2 H3 H4 Lorem ipsum dolor sit amet, consectetur adipiscing elit. Vestibulum dapibus ullamcorper ex, sed congue massa. Duis at fringilla nisi. Aenean eu nibh vitae quam auctor ultrices. Donec consequat mattis viverra. Morbi sed egestas ante. Vivamus ornare nulla sapien. Integer mollis semper egestas. Cras vehicula erat eu ligula commodo vestibulum. Fusce at pulvinar urna, ut iaculis eros. Pellentesque volutpat leo non dui aliquet, sagittis auctor tellus accumsan. Curabitur nibh mauris, placerat sed pulvinar in, ullamcorper non nunc. Praesent id imperdiet lorem. H5 Curabitur id purus est. Fusce porttitor tortor ut ante volutpat egestas. Quisque imperdiet lobortis justo, ac vulputate eros imperdiet ut. Phasellus erat urna, pulvinar id turpis sit amet, aliquet dictum metus. Fusce et dapibus ipsum, at lacinia purus. Vestibulum euismod lectus quis ex porta, eget elementum elit fermentum. Sed semper convallis urna, at ultrices nibh euismod eu. Cras ultrices sem quis arcu fermentum viverra. Nullam hendrerit venenatis orci, id dictum leo elementum et. Sed mattis facilisis lectus ac laoreet. Nam a turpis mattis, egestas augue eu, faucibus ex. Integer pulvinar ut risus id auctor. Sed in mauris convallis, interdum mi non, sodales lorem. Praesent dignissim libero ligula, eu mattis nibh convallis a. Nunc pulvinar venenatis leo, ac rhoncus eros euismod sed. Quisque vulputate faucibus elit, vitae varius arcu congue et. Ut maximus felis quis diam accumsan suscipit. Etiam tellus erat, ultrices vitae molestie ut, bibendum id ipsum. Aenean eu dolor posuere, tincidunt libero vel, mattis mauris. Aliquam erat volutpat. Sed sit amet placerat nulla. Mauris diam leo, iaculis eget turpis a, condimentum laoreet ligula. Nunc in odio imperdiet, tincidunt velit in, lacinia urna. Aenean ultricies urna tempor, condimentum sem eget, aliquet sapien. Ut convallis cursus dictum. In hac habitasse platea dictumst. Ut eleifend eget erat vitae tempor. Nam tempus pulvinar dui, ac auctor augue pharetra nec. Sed magna augue, interdum a gravida ac, lacinia quis erat. Pellentesque fermentum in enim at tempor. Proin suscipit, odio ut lobortis semper, est dolor maximus elit, ac fringilla lorem ex eu mauris. Phasellus vitae elit et dui fermentum ornare. Vestibulum non odio nec nulla accumsan feugiat nec eu nibh. Cras tincidunt sem sed lacinia mollis. Vivamus augue justo, placerat vel euismod vitae, feugiat at sapien. Maecenas sed blandit dolor. Maecenas vel mauris arcu. Morbi id ligula congue, feugiat nisl nec, vulputate purus. Nunc nec aliquet tortor. Maecenas interdum lectus a hendrerit tristique. Ut sit amet feugiat velit. Test Yes asedtsdfd asdf asdf adsf Related Posts

With the National Automobile Dealers Association (NADA) Show set to kickoff later this week, it seemed fitting to explore how the shifting dynamics of the used vehicle market might impact dealers and buyers over the coming year. Shedding light on some of the registration and finance trends, as well as purchasing behaviors, can help dealers and manufacturers stay ahead of the curve. And just like that, the Special Report: Automotive Consumer Trends Report was born. As I was sifting through the data, one of the trends that stood out to me was the neck-and-neck race between Millennials and Gen X for supremacy in the used vehicle market. Five years ago, in 2019, Millennials were responsible for 33.3% of used retail registrations, followed by Gen X (29.5%) and Baby Boomers (26.8%). Since then, Baby Boomers have gradually fallen off, and Gen X continues to close the already minuscule gap. Through October 2024, Millennials accounted for 31.6%, while Gen X accounted for 30.4%. But trends can turn on a dime if the last year offers any indication. Over the last rolling 12 months (October 2023-October 2024), Gen X (31.4%) accounted for the majority of used vehicle registrations compared to Millennials (30.9%). Of course, the data is still close, and what 2025 holds is anyone’s guess, but understanding even the smallest changes in market share and consumer purchasing behaviors can help dealers and manufacturers adapt and navigate the road ahead. Although there are similarities between Millennials and Gen X, there are drastic differences, including motivations and preferences. Dealers and manufacturers should engage them on a generational level. What are they buying? Some of the data might not come as a surprise but it’s a good reminder that consumers are in different phases of life, meaning priorities change. Over the last rolling 12 months, Millennials over-indexed on used vans, accounting for more than one-third of registrations. Meanwhile, Gen X over-indexed on used trucks, making up nearly one-third of registrations, and Gen Z over-indexed on cars (accounting for 17.1% of used car registrations compared to 14.6% of overall used vehicle registrations). This isn’t surprising. Many Millennials have young families and may need extra space and functionality, while Gen Xers might prefer the versatility of the pickup truck—the ability to use it for work and personal use. On the other hand, Gen Zers are still early in their careers and gravitate towards the affordability and efficiency of smaller cars. Interestingly, although used electric vehicles only make up a small portion of used retail registrations (less than 1%), Millennials made up nearly 40% over the last rolling 12 months, followed by Gen X (32.2%) and Baby Boomers (15.8%). The market at a bird’s eye view Pulling back a bit on the used vehicle landscape, over the last rolling 12 months, CUVs/SUVs (38.9%) and cars (36.6%) accounted for the majority of used retail registrations. And nearly nine-in-ten used registrations were non-luxury vehicles. What’s more, ICE vehicles made up 88.5% of used retail registrations over the same period, while alternative-fuel vehicles (not including BEVs) made up 10.7% and electric vehicles made up 0.8%. At the finance level, we’re seeing the market shift ever so slightly. Since the beginning of the pandemic, one of the constant narratives in the industry has been the rising cost of owning a vehicle, both new and used. And while the average loan amount for a used non-luxury vehicle has gone up over the past five years, we’re seeing a gradual decline since 2022. In 2019, the average loan amount was $22,636 and spiked $29,983 in 2022. In 2024, the average loan amount reached $28,895. Much of the decline in average loan amounts can be attributed to the resurgence of new vehicle inventory, which has resulted in lower used values. With new leasing climbing over the past several quarters, we may see more late-model used inventory hit the market in the next few years, which will most certainly impact used financing. The used market moving forward Relying on historical data and trends can help dealers and manufacturers prepare and navigate the road ahead. Used vehicles will always fit the need for shoppers looking for their next vehicle; understanding some market trends will help ensure dealers and manufacturers can be at the forefront of helping those shoppers. For more information on the Special Report: Automotive Consumer Trends Report, visit Experian booth #627 at the NADA Show in New Orleans, January 23-26.
The automotive industry is constantly changing. Shifting consumer demands and preferences, as well as dynamic economic factors, make the need for data-driven insights more important than ever. As we head into the National Automobile Dealers Association (NADA) Show this week, we wanted to explore some of the trends in the used vehicle market in our Special Report: State of the Automotive Finance Market Report. Packed with valuable insights and the latest trends, we’ll take a deep dive into the multi-faceted used vehicle market and better understand how consumers are financing used vehicles. 9+ model years grow Although late-model vehicles tend to represent much of the used vehicle finance market, we were surprised by the gradual growth of 9+ model year (MY) vehicles. In 2019, 9+MY vehicles accounted for 26.6% of the used vehicle sales. Since then, we’ve seen year-over-year growth, culminating with 9+MY vehicles making up a little more than 30% of used vehicle sales in 2024. Perhaps more interesting though, is who is financing these vehicles. Five years ago, prime and super prime borrowers represented 42.5% of 9+MY vehicles, however, in 2024, those consumers accounted for nearly 54% of 9+MY originations. Among the more popular 9+MY segments, CUVs and SUVs comprised 36.9% of sales in 2024, up from 35.2% in 2023, while cars went from 44.3% to 42.9% year-over-year and pickup trucks decreased from 15.9% to 15.6%. 2024 highlights by used vehicle age group To get a better sense of the overall used market, the segments were broken down into three age groups—9+MY, 4-8MY, and current +3MY—and to no surprise, the finance attributes vary widely. While we’ve seen the return of new vehicle inventory drive used vehicle values lower, it could be a sign that consumers are continuing to seek out affordable options that fit their lifestyle. In fact, the average loan amount for a 9+MY vehicle was $19,376 in 2024, compared to $24,198 for a vehicle between 4-8 years old and $32,381 for +3MY vehicle. Plus, more than 55% of 9+MY vehicles have monthly payments under $400. That’s not an insignificant number for people shopping with the monthly payment in mind. In 2024, the average monthly payment for a used vehicle that falls under current+3MY was $608. Meanwhile, 4-8MY vehicles came in at an average monthly payment of $498, and 9+MY vehicles had a $431 monthly payment. Taking a deeper dive into average loan amounts based on specific vehicle types—as of 2024, current +3MY cars came in at $28,721, followed by CUVs/SUVs ($31,589) and pickup trucks ($40,618). As for 4-8MY vehicles, cars came in with a loan amount of $22,013, CUVs/SUVs were at $23,133, and pickup trucks at $31,114. Used 9+MY cars had a loan amount of $19,506, CUVs/SUVs came in at $17,350, and pickup trucks at $22,369. With interest rates remaining top of mind for most consumers as we’ve seen them increase in recent years, understanding the growth from 2019-2024 can give a holistic picture of how the market has shifted over time. For instance, the average interest rate for a used current+3MY vehicle was 8.0% in 2019 and grew to 10.2% in 2024, the average rate for a 4-8MY vehicle went from 10.3% to 12.9%, and the average rate for a 9+MY vehicle increased from 11.4% to 13.8% in the same time frame. Looking ahead to the used vehicle market It’s important for automotive professionals to understand and leverage the data of the used market as it can provide valuable insights into trending consumer behavior and pricing patterns. While we don’t exactly know where the market will stand in a few years—adapting strategies based on historical data and anticipating shifts can help professionals better prepare for both challenges and opportunities in the future. As used vehicles remain a staple piece of the automotive industry, making informed decisions and optimizing inventory management will ensure agility as the market continues to shift. For more information, visit us at the Experian booth (#627) during the NADA Show in New Orleans from January 23-26.
In this article…
typesetting, remaining essentially unchanged. It was popularised in the 1960s with the release of Letraset sheets containing Lorem Ipsum passages, and more recently with desktop publishing software like Aldus PageMaker including versions of Lorem Ipsum.