Loading...

Tailoring Your Lending Strategy for Gen Y and Gen Z First-time Homebuyers

Published: April 17, 2024 by Scott Hamlin

Click here to watch our recent webinar on first-time homebuyers.

The younger generations comprise nearly 70% of first-time homebuyers, according to recent Experian Mortgage research. Understanding the generational traits of first-time homebuyers, particularly motivated younger generations, is critical to building highly targeted marketing strategies. Gen Z and Gen Y are essential in the first-time homebuyer market and represent close to 40% of repeat buyers, indicating they consider homeownership important beyond just their first purchase.

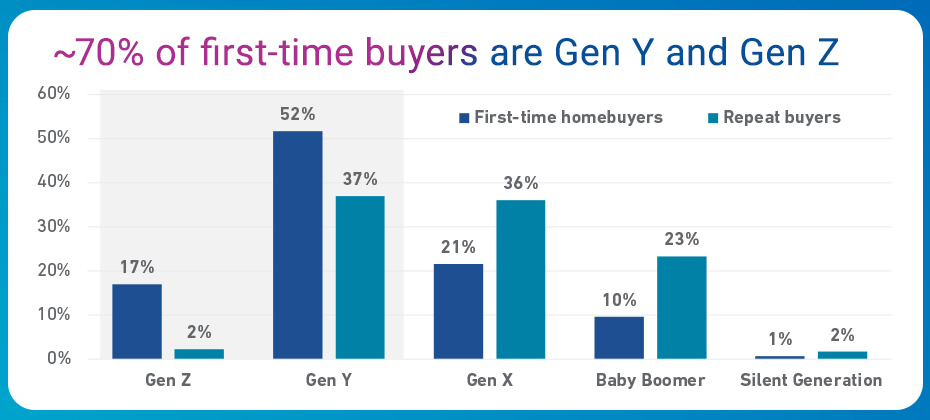
Generation Y borrowers lead the pack

Generation Y borrowers see homeownership as part of the American Dream but have waited longer than previous generations to purchase their first home.1 Additionally, as digital natives, they have grown up in a world with online resources and digital tools, making the home buying process more convenient for them. They can effortlessly research homes, compare mortgage rates, and even complete paperwork without leaving their home – a time and cost-saving advantage.

With their desire for stability and their technological proficiency, it comes as no surprise that Gen Y borrowers are at the forefront of the homebuying market, accounting for 52% of all first-time buyers.

Keep your eye on the next wave: Generation Z borrowers

Although Generation Z is the youngest group with both young adults and those entering adulthood, they should not be overlooked in the real estate market. Despite their age, Gen Z possesses characteristics and tendencies that make them legitimate potential first-time homebuyers.

Having grown up in an era characterized by technical advancements and economic instability, Gen Z has observed various challenges, such as the impact of the 2008 financial crisis on their families. They have also witnessed their parents and older siblings navigating student loan debt and a volatile job market. As a result, Gen Z individuals tend to approach life decisions with a cautious mindset.

However, it is important to note that Gen Z is a generation known for their ambition and determination. They have an entrepreneurial spirit. A strong desire for stability. According to a recent survey conducted by Chase2, homeownership holds an important place in the dreams of nearly 90% of Generation Z individuals. This unwavering aspiration for owning a home and increasing purchasing power establishes Generation Z as a significant influence in the real estate market.

Market to each generation where they are most comfortable, for Y and Z it is online and on the go

To get the attention of these younger generations, mortgage lenders must understand that for these groups, digital technology is the norm, integrated into all aspects of their lives. They rely heavily on social media, online reviews, and mobile apps for research and communication. Therefore, it is crucial for lenders to implement a marketing strategy that encompasses social media platforms and personalized email, and, increasingly, text communications, to resonate with the tech savvy nature of these generations. That said, there is nuance in every population, and we see this when observing communication preferences across generations. We know, for example, that first-time homebuyers are considerably more likely than the general public to respond to e-mail offers. Understanding communication preferences for each prospect is important for tailoring your omni-channel marketing approach.

Growing up in a world where technology is constantly advancing, Generations Y and Z are accustomed to having immediate access to information and services at their fingertips. As a result, they expect an efficient mortgage lending process that uses online, smartphone-enabled tools and platforms. They count on the ability to complete applications and paperwork online, receive updates and notifications via email or text, and have access to resources and tools to track and manage their mortgage journey.

Lenders embracing these realities about Gen Y and Gen Z and connecting with them where they are, will be better positioned to serve this demographic and grow their own business.

For more information about the lending possibilities for first-time homebuyers, download our latest white paper.

Download white paper

1 “Bank of America’s 2023 Homebuyer Insights Report Explores How Hopeful Buyers are Forging Ahead,” bankofamerica.com. 

2 “Millennial and Gen Z Adults Still See American Dream Within Reach Despite Challenges,” chase.com.

Related Posts

With the National Automobile Dealers Association (NADA) Show set to kickoff later this week, it seemed fitting to explore how the shifting dynamics of the used vehicle market might impact dealers and buyers over the coming year. Shedding light on some of the registration and finance trends, as well as purchasing behaviors, can help dealers and manufacturers stay ahead of the curve. And just like that, the Special Report: Automotive Consumer Trends Report was born. As I was sifting through the data, one of the trends that stood out to me was the neck-and-neck race between Millennials and Gen X for supremacy in the used vehicle market. Five years ago, in 2019, Millennials were responsible for 33.3% of used retail registrations, followed by Gen X (29.5%) and Baby Boomers (26.8%). Since then, Baby Boomers have gradually fallen off, and Gen X continues to close the already minuscule gap. Through October 2024, Millennials accounted for 31.6%, while Gen X accounted for 30.4%. But trends can turn on a dime if the last year offers any indication. Over the last rolling 12 months (October 2023-October 2024), Gen X (31.4%) accounted for the majority of used vehicle registrations compared to Millennials (30.9%). Of course, the data is still close, and what 2025 holds is anyone’s guess, but understanding even the smallest changes in market share and consumer purchasing behaviors can help dealers and manufacturers adapt and navigate the road ahead. Although there are similarities between Millennials and Gen X, there are drastic differences, including motivations and preferences. Dealers and manufacturers should engage them on a generational level. What are they buying? Some of the data might not come as a surprise but it’s a good reminder that consumers are in different phases of life, meaning priorities change. Over the last rolling 12 months, Millennials over-indexed on used vans, accounting for more than one-third of registrations. Meanwhile, Gen X over-indexed on used trucks, making up nearly one-third of registrations, and Gen Z over-indexed on cars (accounting for 17.1% of used car registrations compared to 14.6% of overall used vehicle registrations). This isn’t surprising. Many Millennials have young families and may need extra space and functionality, while Gen Xers might prefer the versatility of the pickup truck—the ability to use it for work and personal use. On the other hand, Gen Zers are still early in their careers and gravitate towards the affordability and efficiency of smaller cars. Interestingly, although used electric vehicles only make up a small portion of used retail registrations (less than 1%), Millennials made up nearly 40% over the last rolling 12 months, followed by Gen X (32.2%) and Baby Boomers (15.8%). The market at a bird’s eye view Pulling back a bit on the used vehicle landscape, over the last rolling 12 months, CUVs/SUVs (38.9%) and cars (36.6%) accounted for the majority of used retail registrations. And nearly nine-in-ten used registrations were non-luxury vehicles. What’s more, ICE vehicles made up 88.5% of used retail registrations over the same period, while alternative-fuel vehicles (not including BEVs) made up 10.7% and electric vehicles made up 0.8%. At the finance level, we’re seeing the market shift ever so slightly. Since the beginning of the pandemic, one of the constant narratives in the industry has been the rising cost of owning a vehicle, both new and used. And while the average loan amount for a used non-luxury vehicle has gone up over the past five years, we’re seeing a gradual decline since 2022. In 2019, the average loan amount was $22,636 and spiked $29,983 in 2022. In 2024, the average loan amount reached $28,895. Much of the decline in average loan amounts can be attributed to the resurgence of new vehicle inventory, which has resulted in lower used values. With new leasing climbing over the past several quarters, we may see more late-model used inventory hit the market in the next few years, which will most certainly impact used financing. The used market moving forward Relying on historical data and trends can help dealers and manufacturers prepare and navigate the road ahead. Used vehicles will always fit the need for shoppers looking for their next vehicle; understanding some market trends will help ensure dealers and manufacturers can be at the forefront of helping those shoppers. For more information on the Special Report: Automotive Consumer Trends Report, visit Experian booth #627 at the NADA Show in New Orleans, January 23-26.

Published: January 21, 2025 by Kirsten Von Busch

In 2024, the housing market defied recession fears, with mortgage and home equity growth driven by briefly lower interest rates, strong equity positions, generally positive economic indicators, and stock market appreciation. This performance is notable because, in 2023, economists’ favorite hobby was predicting a recession in 2024. Following a period of elevated inflation, driven largely by loose monetary policy, expansionary fiscal policy, and supply chain disruptions brought on by COVID, economists were certain that the US economy would shrink. However, the economy continued outperforming expectations, even as unemployment rose modestly (Figure 2) and inflation cooled (Figure 3). Source: FRED (Figure 1, Figure 2, Figure 3). So, a good economy is good for the mortgage and home equity markets, right? Generally speaking, this statement was true. As monitored by Experian’s credit database, mortgage originations increased by approximately thirty percent year over year as of November 2024 (Figure 4), and Q3 ’24 pre-tax profit for Independent Mortgage Banks (IMBs) averaged $701 per loan.1 So, business in home lending is good — certainly better than it was during the period when the Fed was raising rates, origination volumes shrank as opposed to grew, and IMB profit per loan turned negative. Source: Experian Ascend Insights Dashboard. What constituted this growth in mortgage lending? As we all know, the Fed has lowered interest rates by 100bps since they started reducing rates in September. The market had priced in the September cut weeks prior to the actual announcement (Figure 5), and the market enjoyed a spike in refinance volume as a result (Figure 6). However, in the lead-up to and following the US presidential election, interest rates spiked back up due to the market’s expectations around future economic activity, which will dampen pressure on refinance volumes even after the recent additional rate drop. The impact of further rate drops on mortgage rates is unclear, and refinance volume still constitutes only around three percent of overall origination volume. Source: Figure 5, Figure 6 (Experian Ascend Insights Dashboard). The shift to a purchase-driven housing market What does this all mean? Our view is that pockets of refinance volume (rate and term, VA, FHA, cashout) are available to those lenders with a sophisticated targeting strategy. However, the data also very clearly indicates that this market is still very much a purchase market in terms of opportunity for originations growth. This position should not surprise long-time mortgage lenders, given that purchase volume has always constituted a significant majority of origination volume. However, this market is a different purchase market than lenders may be used to. This purchase market is different because of unprecedented statistics about the housing market itself. The average age of a first-time homebuyer recently reached a record high of 38. The average age of overall homebuyers in November of this year similarly jumped to a new record high of 56, with homes being “wildly unaffordable for young people.” Twenty-six percent of home purchases are all-cash, another record high, and homeowners have an aggregate net equity position of $17.6 trillion, fueling those all-cash purchases. The market is expensive both from an interest rate perspective and a housing price-level perspective, and those trends are driving who is buying homes and how they are buying them.2 Opportunities for lenders in 2025 What do these housing market dynamics mean for lenders? To begin with, lenders should not spend money marketing mortgages to consumers in their 50s and 60s with large equity positions. These consumers are likely to be in the 26 percent all-cash buyer cohort, and that money will be wasted since mortgages are no longer so cheap that even cash-rich buyers would take them. Further, this equity-rich generation has children, and nearly 40% of those children borrow from the bank of mom and dad to purchase their first home. Since roughly a quarter (albeit a shrinking quarter) of homebuyers are first-time homebuyers, and since 40% of those rely on help from parents to facilitate that purchase, it may make sense for lenders to identify those consumers with 1) children and 2) significant equity positions and to offer products like cash-out refinances or home equity loans/lines to help facilitate those first-time purchases. Data is critical to executing these kinds of novel marketing strategies. It is one thing to develop these marketing and growth strategies in principle and another entirely to efficiently find the consumers that meet the criteria and give them a compelling offer. Consider home equity originations. As Figure 7 illustrates, HELOC originations are strong but have completely stalled from a growth rate perspective. As Figure 8 illustrates, this is despite the market's continued growth in direct mail marketing investment. Although HELOC origination volumes are a fraction of mortgage—around $27b per month for HELOC versus $182b per month for mortgage—there are significantly more home equity direct mail offers being sent per month (39 million) for home equity products as there are for mortgage (31 million) as of October ’24.3 This all means that although many lenders have wised up to the home equity opportunity to the point of saturating the market with offers, few have successfully leveraged targeting data and analytics to craft sufficiently compelling offers to those consumers to convert those marketing leads into booked loans. Source: Figure 7 (Experian Ascend Insights Dashboard), Figure 8 (Mintel). Adapting to a resilient housing market In summary, the housing market, comprised of mortgage and home equity products, has experienced persistent growth over the past year. Many who are reading this note will have benefitted from that growth. However, as we have identified, in many respects housing market growth has 1) been concentrated to some key borrower demographics and 2) many lenders are investing in marketing campaigns that are not efficiently reaching or convincing that key housing demographic to book loans, whether it be a home equity or mortgage product. As such, as we move into 2025, Experian advises our clients to focus on the following three themes to ensure they benefit from this trend of growth into the new year: Ensure you effectively differentiate your marketing targeting, collateral, and offers for the various demographics in the market. Ensure your origination experiences for mortgage and home equity products are modern and efficient. Lenders who force all borrowers through a painful, manual legacy process will waste marketing dollars and experience pipeline fallout. Although the market is growing, other lenders are coming for your current customers. They could be coming for purchase activity, refinance opportunities, or they may be using home equity products to encroach on your existing mortgage relationship. As such, capitalizing on growth in 2025 is not merely about gaining new customers; it is also about retaining your existing book of business using high-quality data and analytics. Learn more 1 Although December numbers are available for year-over-year comparison, we excluded them due to the holiday period's strong seasonality patterns. 2 The Case-Shiller index recently topped out at record levels. 3 Mintel/Comperemedia data.

Published: December 30, 2024 by David Fay

Examine today’s renter population, current market trends, the state of housing development, and the market’s future.

Published: December 27, 2024 by Manjit Sohal

Subscribe to our blog

Enter your name and email for the latest updates.

This site is protected by reCAPTCHA and the Google Privacy Policy and Terms of Service apply.

Subscribe to our Experian Insights blog

Don't miss out on the latest industry trends and insights!
Subscribe