
By: Joel Pruis I am going to take some liberties here. Nowhere in the movie Moneyball does Peter Brand tell us how he got to the magic number of winning 99 games to get to the playoffs. My assumption is that given the way that he evaluates the Oakland A’s, he also evaluations the other teams in their conference. Assessing the competitive landscape provides Brand with the estimated runs their opponents will generate. Now we could take the approach that such analysis would correlate to assessing how your competition is going to perform but I am going to take a different approach. I would compare the conference assessment in Moneyball to be similar to an economic forecast/assessment. We need to assess what are the overall conditions in which we must operate that will allow us to generate the net yield on the assets of our financial institution. Some of the things we need to assess to determine what we will be able to generate related to the net yield on assets would be: Gross yield on assets Current interest rate environment (yield on treasuries, federal home loan bank, etc. Interest rate trends (increasing, declining, trends toward fixed rates, variable rates) Industry information General trend of businesses across the nation How are businesses faring? How well are they paying their creditors? Are they relying more or less on credit? Are new businesses being started? Are they succeeding? Are they failing? General trends (same as above) within your financial institution’s market footprint One such source of the industry information is the Small Business Credit Index generated by Experian & Moody’s Analytics. In the recent release of the Small Business Credit Index, small business is indicating stronger from the prior quarter moving from 104.3 to 109. But this is from a national perspective. Depending on your financial institution, it is important to always get an overall view of the economy but more importantly, what is happening in your particular market footprint. Just as the Oakland A’s in Moneyball maintained an overall perspective of Major League Baseball, their focus for success was targeting their specific conference to reach the playoffs. So as we look at information such as the Small Business Credit Index, we are able to see highlights of regional trends (certain states west of the Mississippi are doing better while certain states along the east coast are not) and specific industry trends. From such data we need to drill down into our specific footprint and current portfolio. We need to review such items as: What industry concentrations do we have that are doing well in the economy and how is our portfolio doing compared to the external data? What industries are we not engaging that may provide a good opportunity for our financial institution? What changes are taking place in the general economy that may impact our ability to achieve our expected results? What external factors must we be monitoring that may impact our strategy (such as the impact of Obamacare and how it will impact the hiring for businesses with more than 50 employees?) Just as in Moneyball, Brand continues to monitor the performance of the overall league (and the individual players for future trades), we need to continually monitor the national, state and local economies to determine what adjustments we will need to make to achieve our strategies. So we have assessed the general environment, on to strategies or “How do we win 99 games with a total payroll of $38 million?”
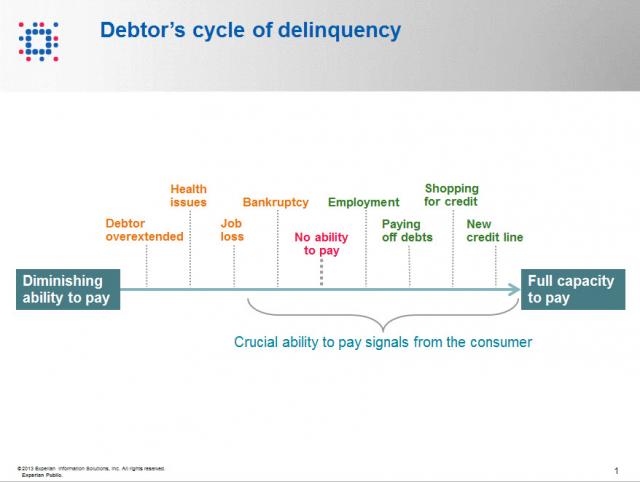
Contact information such as phone numbers and addresses are fundamental to being able to reach a debtor, but knowing when to reach out to the debtor is also a crucial factor impacting success or failure in getting payment. As referenced in the chart below, when a consumer enters the debtor life cycle, they often avoid talking with you about the debt because they do not have the ability to pay. When the debtor begins to recover financially, you want to be sure you are among the first to reach out to them so you can be the first to be paid. According to Don Taylor, President of Automated Collection Services, they have seen a lift of more than 12% of consumers with trigger hits entering repayment, and this on an aged portfolio that has already been actively worked by debt collection staff. Monitoring for a few key changes on the credit profiles of debtors provides the passive monitoring that is needed to tell you the optimal time to reach back to the consumer for payment. Experian compiled several recent collection studies and found that a debtor paying off an account that was previously past due provided a 710% increase in the average payment. Positive improvement on a consumers’ credit profile is one of those vital indicators that the consumer is beginning to recover financially and could have the will—and ability—to pay bad debts. The collection industry is not like the big warehouse stores—quantity and value do not always work hand in hand for the debt collection industry. Targeting the high value credit events that are proven to increase collection amounts is the key to value, and Experian has the expertise, analytics and data to help you collect in the most effective manner. Be sure to check out our other debt collection blog posts to learn how to recover debt more quickly and efficiently.
By: Joel Pruis What is it we as bankers are trying to accomplish? If you have been in the industry for 20+ years, this question may sound ridiculous! We do what we do! We are bankers! What do you mean define what are we trying to do? But that is the question, what is it we are trying to do? I am going to propose we boil it down to the basic/fundamental element – Banks aggregate money from various sources and redeploy these funds to earn a return for the shareholders. Ultimately, our objective is to generate an appropriate return for the shareholders Getting back to the movie Moneyball, Billy Beane and Peter Brand define the objective of the Oakland A’s for the season in terms of projecting the number of wins that are needed to assure, with all probability, that the team makes the playoffs (this would be similar to the objective of banking to generate an appropriate return for the shareholders). But Peter Brand quickly moves into very specific targets that are required for the A’s to make it to the playoffs, namely win 99 regular season games. In order to win 99 regular season games, the A’s offense will need to score 814 runs in the season and defensively only allow 645 runs. Plain and simple. Very objective, very measurable and it is all based upon data, data, data. Let’s break this down. Based upon their conference, the teams in their conference along with the overall schedule, Peter Brand projects that 99 wins are necessary to land a spot in the playoffs. No gut check, no darts or crystal ball but rather historical data that when analyzed provides the benchmark of 99 wins to statistically assure the Oakland A’s that they will make the playoffs. So let’s apply this to banking. Our objective is to generate the appropriate return for our shareholders or the old Return on Equity. So, for example, if our targeted return on equity is 20% (making the playoffs) we need to make sure we generate enough net income (99 wins) through producing the necessary gross yield on assets (814 runs generated by the Oakland A’s offense) less the expected charge offs (645 runs allowed by the Oakland A’s defense). For a quick dive into details, our data would provide for a margin of error on the variable to provide for statistical assurance of achieving the objective (Return on Equity). In the movie there is no guaranty that the 814 runs will win the conference but at the same time there is no guaranty that the Oakland A’s opponents will score 645 runs. Never in the movie does the coach, Billy Beane or Peter Brand tell the team, “You only have to score X number of runs this game, don’t score anymore.” Or even crazier, “You are not letting the other team score enough runs, they need to score 645!” No, the strategy is still to generate as many runs as possible while minimizing the number of runs scored by the opposition. Rather it is the review of the total amount of earning assets of the financial institution and the overall credit quality that we must understand and control to determine our ability to generate the net yield on assets required to generate the return on equity that is required. If we assume too much risk in the portfolio in order to generate the required yield it would be similar to having a poor pitching staff projected to allow 10 runs a game requiring the team to produce 11 runs a game in order to win. It just is not realistic. So basically we need to assess at the high level, are we appropriately structured to allow for the generation of enough profit to provide the appropriate return on equity. At this point, we do not need to complicate it any further than that. Now let’s take a look at the constraints. We know we have them in banking, let’s take a look at probably the single biggest constraint imposed on Billy Beane and the Oakland A’s. In the movie, before Billy Beane is even aware of the Moneyball concept, his is given his constraint by the owner. Beane asks for more money to ‘buy players’ and is flat out rejected by the owner. The owner, in fact, cuts Beane off by asking, “is there anything else I can do for you?”. Net result is that the Oakland A’s have $38 million dollars for payroll vs. the New York Yankees at $120 million. Seriously it does not seem fair. How can you attract the needed talent when you cannot pay the type of salary needed to get the necessary players to win a championship? Let’s rephrases this for banking… How can a bank be expected to deploy its assets when such a high rate of return is required? Boiling it down to a specific example, “How can I originate a commercial loan at this rate of interest when the competition is ½ to 1% lower than our rates?” Up next – Why will 99 games get us to the playoffs? How do we assess the environment?