Loading...

Leasing Decreased in Q3 2021, But Remains a Critical Option for Affordability

Published: January 11, 2022 by Melinda Zabritski

Young woman standing against glass window at car showroom

There is no doubt the automotive finance market continues to see impacts and shifts resulting from the pandemic. One of the changes we saw was a drop in leasing. While many trends have returned to pre-pandemic levels, leasing has not. In fact, it’s continued to decrease.

According to Experian’s State of Automotive Finance Market: Q3 2021 report, leasing comprised 24.03% of new vehicle financing in Q3 2021, compared to 27.62% in Q3 2020, and 30.51% in Q3 2019.

Some attribute the drop in leasing to consumers extending their current leases or purchasing their vehicles once the lease expires—a cost-effective way to purchase a vehicle, particularly amid rising prices. But while we don’t know the exact reasons driving the decrease in leasing, we do know that it continues to be a vital option for consumers looking for a lower monthly payment on a vehicle.

In Q3 2021, the average monthly lease payment was $506, compared to the average monthly loan payment for a new vehicle, which hit a record high of $617. With the average new vehicle monthly payment more than $100 higher, consumers shopping for a vehicle based on monthly payment may opt for a lease, rather than a loan.

For example, in Q3 2021, the Ford F150 had an average monthly lease payment of $542, while the average monthly loan payment was $768. Consumers also continue to opt for CUVs, such as the Jeep Grand Cherokee, which had an average monthly lease payment of $470, compared to the average loan payment of $608.

Consumers still choosing bigger vehicles

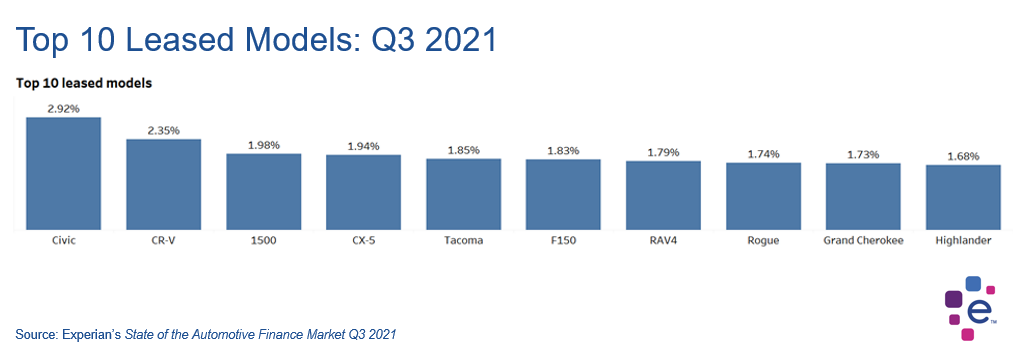
In recent years, consumers have been looking for larger, more expensive vehicles like SUVs, CUVs and full-size pickup trucks, and the pandemic has not altered these preferences at all, which is demonstrated by the top 10 vehicles leased in Q3 2021.

It is important to note that the Honda Civic was the top leased vehicle, accounting for 2.92% of leasing, but also the only sedan among the top ten—the rest being made up by SUVs, CUVs, and full-size pickups.

bar chart showing the top ten leased vehicles in Q3 2021

With consumers opting for larger and more expensive vehicles, leasing will continue to remain an important option for those looking to get a new vehicle with a lower monthly payment. It also has a large impact on the used vehicle market in the future—the leases of today are the used vehicles of tomorrow.

As we continue to see challenges like the inventory shortages, data can help dealers and lenders properly navigate their way through this evolving trend and help consumers choose the vehicle that best fits their budget and needs.

To learn more about leasing and other automotive finance trends, watch the entire State of the Automotive Finance Market: Q3 2021 webinar.

Related Posts

Lorem ipsum dolor sit amet, consectetur adipiscing elit. Phasellus at nisl nunc. Sed et nunc a erat vestibulum faucibus. Sed fermentum placerat mi aliquet vulputate. In hac habitasse platea dictumst. Maecenas ante dolor, venenatis vitae neque pulvinar, gravida gravida quam. Phasellus tempor rhoncus ante, ac viverra justo scelerisque at. Sed sollicitudin elit vitae est lobortis luctus. Mauris vel ex at metus cursus vestibulum lobortis cursus quam. Donec egestas cursus ex quis molestie. Mauris vel porttitor sapien. Curabitur tempor velit nulla, in tempor enim lacinia vitae. Sed cursus nunc nec auctor aliquam. Morbi fermentum, nisl nec pulvinar dapibus, lectus justo commodo lectus, eu interdum dolor metus et risus. Vivamus bibendum dolor tellus, ut efficitur nibh porttitor nec. Pellentesque habitant morbi tristique senectus et netus et malesuada fames ac turpis egestas. Maecenas facilisis pellentesque urna, et porta risus ornare id. Morbi augue sem, finibus quis turpis vitae, lobortis malesuada erat. Nullam vehicula rutrum urna et rutrum. Mauris convallis ac quam eget ornare. Nunc pellentesque risus dapibus nibh auctor tempor. Nulla neque tortor, feugiat in aliquet eget, tempus eget justo. Praesent vehicula aliquet tellus, ac bibendum tortor ullamcorper sit amet. Pellentesque tempus lacus eget aliquet euismod. Nam quis sapien metus. Nam eu interdum orci. Sed consequat, lectus quis interdum placerat, purus leo venenatis mi, ut ullamcorper dui lorem sit amet nunc. Donec semper suscipit quam eu blandit. Sed quis maximus metus. Nullam efficitur efficitur viverra. Curabitur egestas eu arcu in cursus. H1 asdf asdf H2 H3 H4 Lorem ipsum dolor sit amet, consectetur adipiscing elit. Vestibulum dapibus ullamcorper ex, sed congue massa. Duis at fringilla nisi. Aenean eu nibh vitae quam auctor ultrices. Donec consequat mattis viverra. Morbi sed egestas ante. Vivamus ornare nulla sapien. Integer mollis semper egestas. Cras vehicula erat eu ligula commodo vestibulum. Fusce at pulvinar urna, ut iaculis eros. Pellentesque volutpat leo non dui aliquet, sagittis auctor tellus accumsan. Curabitur nibh mauris, placerat sed pulvinar in, ullamcorper non nunc. Praesent id imperdiet lorem. H5 Curabitur id purus est. Fusce porttitor tortor ut ante volutpat egestas. Quisque imperdiet lobortis justo, ac vulputate eros imperdiet ut. Phasellus erat urna, pulvinar id turpis sit amet, aliquet dictum metus. Fusce et dapibus ipsum, at lacinia purus. Vestibulum euismod lectus quis ex porta, eget elementum elit fermentum. Sed semper convallis urna, at ultrices nibh euismod eu. Cras ultrices sem quis arcu fermentum viverra. Nullam hendrerit venenatis orci, id dictum leo elementum et. Sed mattis facilisis lectus ac laoreet. Nam a turpis mattis, egestas augue eu, faucibus ex. Integer pulvinar ut risus id auctor. Sed in mauris convallis, interdum mi non, sodales lorem. Praesent dignissim libero ligula, eu mattis nibh convallis a. Nunc pulvinar venenatis leo, ac rhoncus eros euismod sed. Quisque vulputate faucibus elit, vitae varius arcu congue et. Ut maximus felis quis diam accumsan suscipit. Etiam tellus erat, ultrices vitae molestie ut, bibendum id ipsum. Aenean eu dolor posuere, tincidunt libero vel, mattis mauris. Aliquam erat volutpat. Sed sit amet placerat nulla. Mauris diam leo, iaculis eget turpis a, condimentum laoreet ligula. Nunc in odio imperdiet, tincidunt velit in, lacinia urna. Aenean ultricies urna tempor, condimentum sem eget, aliquet sapien. Ut convallis cursus dictum. In hac habitasse platea dictumst. Ut eleifend eget erat vitae tempor. Nam tempus pulvinar dui, ac auctor augue pharetra nec. Sed magna augue, interdum a gravida ac, lacinia quis erat. Pellentesque fermentum in enim at tempor. Proin suscipit, odio ut lobortis semper, est dolor maximus elit, ac fringilla lorem ex eu mauris. Phasellus vitae elit et dui fermentum ornare. Vestibulum non odio nec nulla accumsan feugiat nec eu nibh. Cras tincidunt sem sed lacinia mollis. Vivamus augue justo, placerat vel euismod vitae, feugiat at sapien. Maecenas sed blandit dolor. Maecenas vel mauris arcu. Morbi id ligula congue, feugiat nisl nec, vulputate purus. Nunc nec aliquet tortor. Maecenas interdum lectus a hendrerit tristique. Ut sit amet feugiat velit. Test Yes asedtsdfd asdf asdf adsf Related Posts

Published: March 1, 2025 by Jon Mostajo, test user

The automotive industry is constantly changing. Shifting consumer demands and preferences, as well as dynamic economic factors, make the need for data-driven insights more important than ever. As we head into the National Automobile Dealers Association (NADA) Show this week, we wanted to explore some of the trends in the used vehicle market in our Special Report: State of the Automotive Finance Market Report. Packed with valuable insights and the latest trends, we’ll take a deep dive into the multi-faceted used vehicle market and better understand how consumers are financing used vehicles. 9+ model years grow Although late-model vehicles tend to represent much of the used vehicle finance market, we were surprised by the gradual growth of 9+ model year (MY) vehicles. In 2019, 9+MY vehicles accounted for 26.6% of the used vehicle sales. Since then, we’ve seen year-over-year growth, culminating with 9+MY vehicles making up a little more than 30% of used vehicle sales in 2024. Perhaps more interesting though, is who is financing these vehicles. Five years ago, prime and super prime borrowers represented 42.5% of 9+MY vehicles, however, in 2024, those consumers accounted for nearly 54% of 9+MY originations. Among the more popular 9+MY segments, CUVs and SUVs comprised 36.9% of sales in 2024, up from 35.2% in 2023, while cars went from 44.3% to 42.9% year-over-year and pickup trucks decreased from 15.9% to 15.6%. 2024 highlights by used vehicle age group To get a better sense of the overall used market, the segments were broken down into three age groups—9+MY, 4-8MY, and current +3MY—and to no surprise, the finance attributes vary widely. While we’ve seen the return of new vehicle inventory drive used vehicle values lower, it could be a sign that consumers are continuing to seek out affordable options that fit their lifestyle. In fact, the average loan amount for a 9+MY vehicle was $19,376 in 2024, compared to $24,198 for a vehicle between 4-8 years old and $32,381 for +3MY vehicle. Plus, more than 55% of 9+MY vehicles have monthly payments under $400. That’s not an insignificant number for people shopping with the monthly payment in mind. In 2024, the average monthly payment for a used vehicle that falls under current+3MY was $608. Meanwhile, 4-8MY vehicles came in at an average monthly payment of $498, and 9+MY vehicles had a $431 monthly payment. Taking a deeper dive into average loan amounts based on specific vehicle types—as of 2024, current +3MY cars came in at $28,721, followed by CUVs/SUVs ($31,589) and pickup trucks ($40,618). As for 4-8MY vehicles, cars came in with a loan amount of $22,013, CUVs/SUVs were at $23,133, and pickup trucks at $31,114. Used 9+MY cars had a loan amount of $19,506, CUVs/SUVs came in at $17,350, and pickup trucks at $22,369. With interest rates remaining top of mind for most consumers as we’ve seen them increase in recent years, understanding the growth from 2019-2024 can give a holistic picture of how the market has shifted over time. For instance, the average interest rate for a used current+3MY vehicle was 8.0% in 2019 and grew to 10.2% in 2024, the average rate for a 4-8MY vehicle went from 10.3% to 12.9%, and the average rate for a 9+MY vehicle increased from 11.4% to 13.8% in the same time frame. Looking ahead to the used vehicle market It’s important for automotive professionals to understand and leverage the data of the used market as it can provide valuable insights into trending consumer behavior and pricing patterns. While we don’t exactly know where the market will stand in a few years—adapting strategies based on historical data and anticipating shifts can help professionals better prepare for both challenges and opportunities in the future. As used vehicles remain a staple piece of the automotive industry, making informed decisions and optimizing inventory management will ensure agility as the market continues to shift. For more information, visit us at the Experian booth (#627) during the NADA Show in New Orleans from January 23-26.

Published: January 21, 2025 by Melinda Zabritski

Using AI in debt collection can help financial institutions leverage technology to ensure more accurate and timely collections.

Published: January 14, 2025 by Brian Funicelli