There is no doubt that there will be many headlines published about the latest Bureau of Labor Statistics (BLS) jobs report. The official unemployment rate spiked to 14.7%, the highest level since the Great Depression, and employers shed an unprecedented 20.5 million jobs. However, given the scale and pace that businesses around the country are adjusting their workforces, these headline numbers – especially the official unemployment rate – fall short in capturing the nuances and internal dynamics of the crisis.
To get a better picture of labor market health in the coming months, there are three other components reported in BLS’s employment release that require close attention: the underemployment rate, the labor force participation rate, and the employment-population ratio.
Tracking underemployment
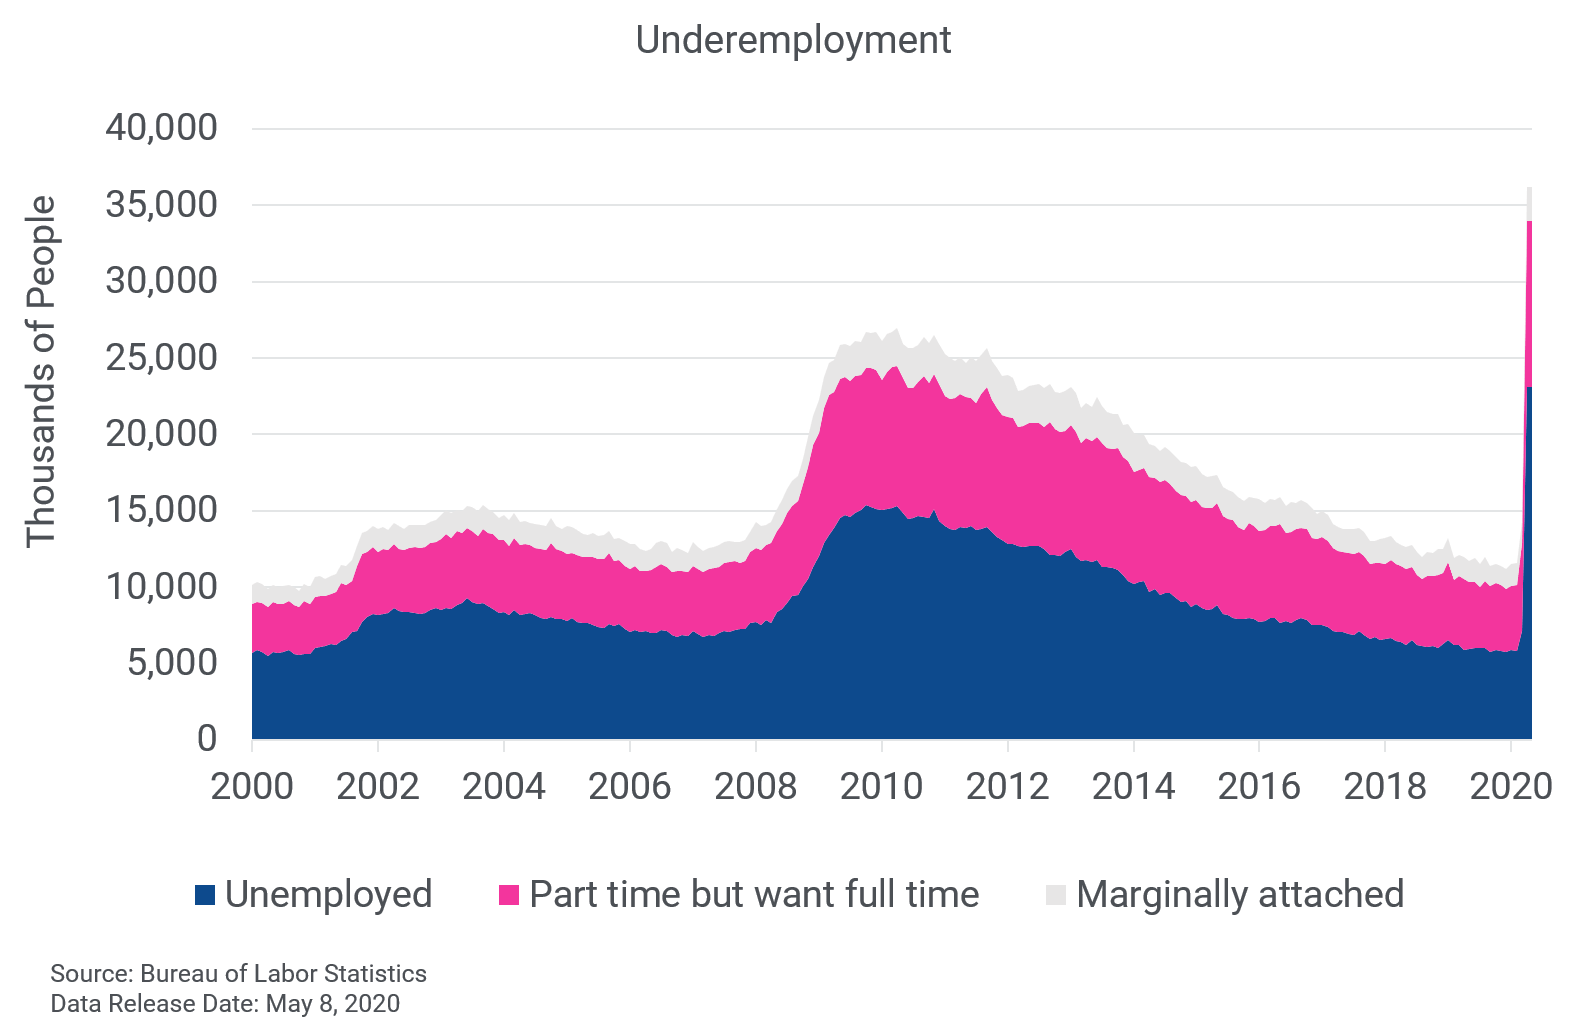
The BLS reports six unemployment figures in its monthly employment release, U1 – U6. The most cited is the “official” unemployment rate, which is U3. However, in the current crisis, the more salient measure of unemployment is U6, which is often known as the “underemployment” rate.
This is because the underemployment (U6) rate takes the unemployed and adds on part-time workers who want a full-time job (BLS calls this segment “part time for economic reasons”), plus marginally attached and discouraged workers (those who don’t think they can find work). Viewing the employment landscape through this lens provides greater insight into the pain points within the labor market.
In April, the underemployment rose from 8.7% to 22.8% – the largest jump on record. A large contributor to the rise was a doubling of the number of part-time workers that wanted a full-time job. Mirroring what happened in previous downturns, the rise in this segment was caused by employers downshifting workers into part-time roles. The official unemployment rate will miss this insight as it classifies everyone who is working as “employed”, regardless if they worked one hour or 100 hours.
Trends in the underemployment rate will be especially important to watch as the recovery gets underway. If employers are doubtful of a strong rebound, they may keep employees on as part time and forgo filling any full-time positions.

Who’s in and who’s out of the labor force
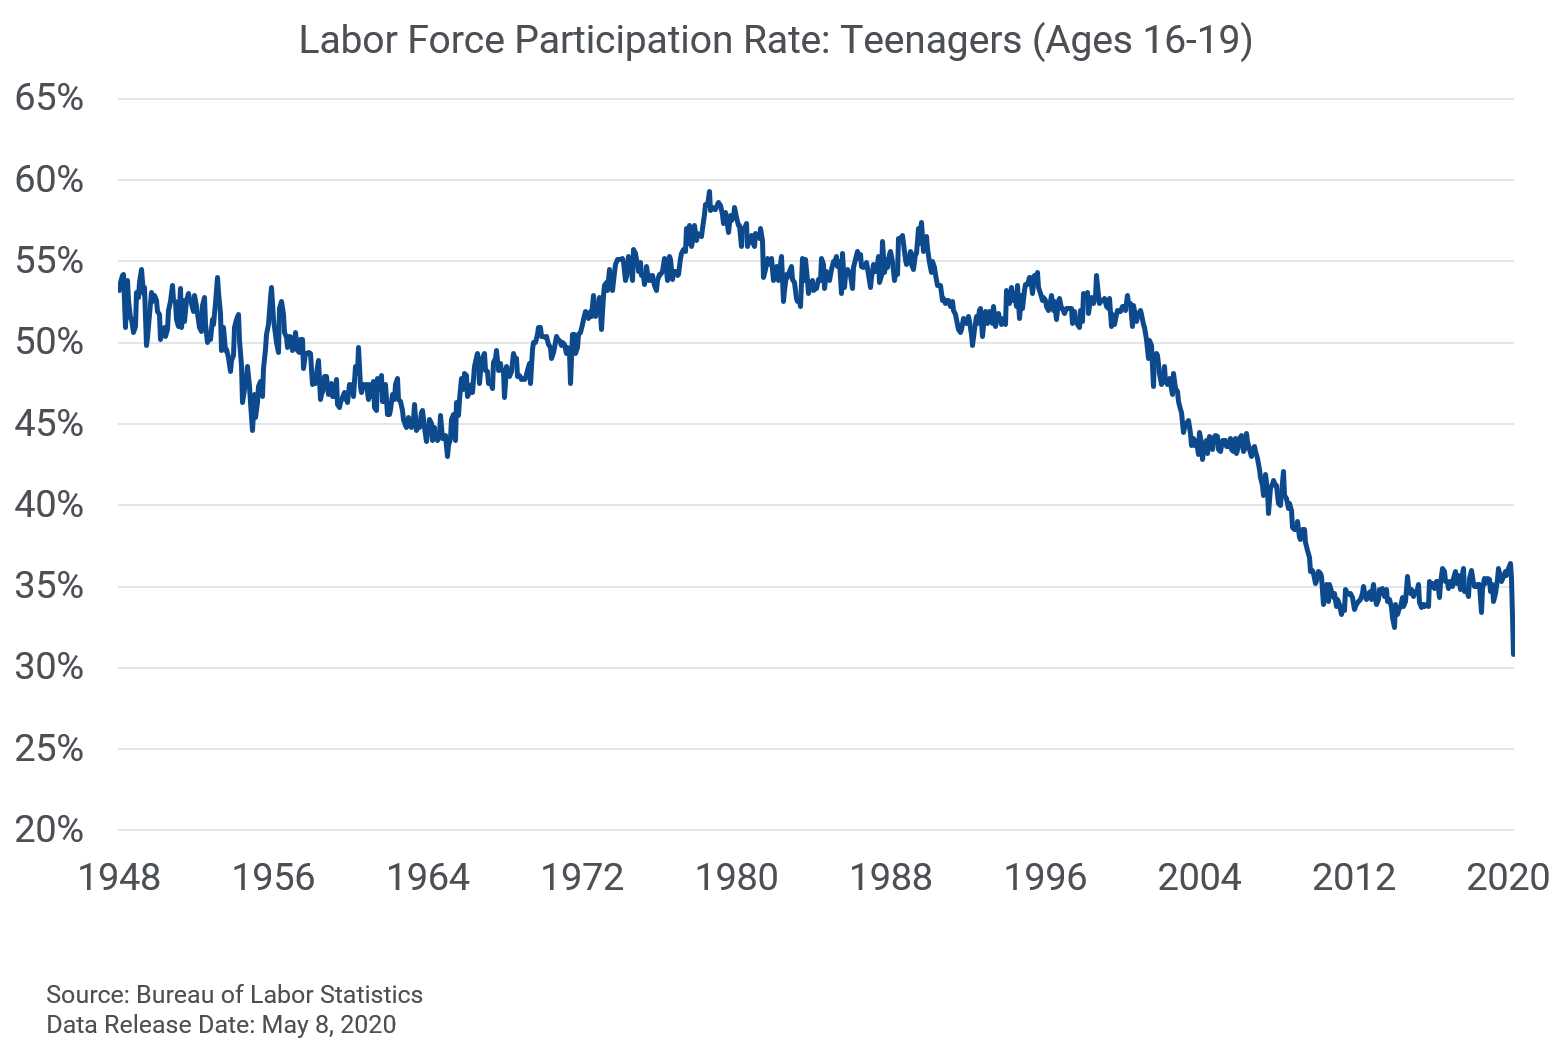
The labor force participation rate is the percentage of the working-age population (aged 16+) that is employed or searching for a job. A decline in the labor force participation rate means that people are leaving the workforce and are no longer looking for employment.
April’s employment report showed labor force participation declining from 62.7% to 60.2%. Teenage participation was especially hard hit, dropping from 35.5% to 30.8% – the lowest level since the government started collecting the data in 1948.
During the recovery phase, tracking what happens with labor force participation will provide insight into how potential workers perceive their chances of landing a job and if it is safe to return. A healthy (or improving) labor market will bring people off the sidelines in search of work, while a weak labor market will do the opposite.
Get a clearer view with the employment-population ratio
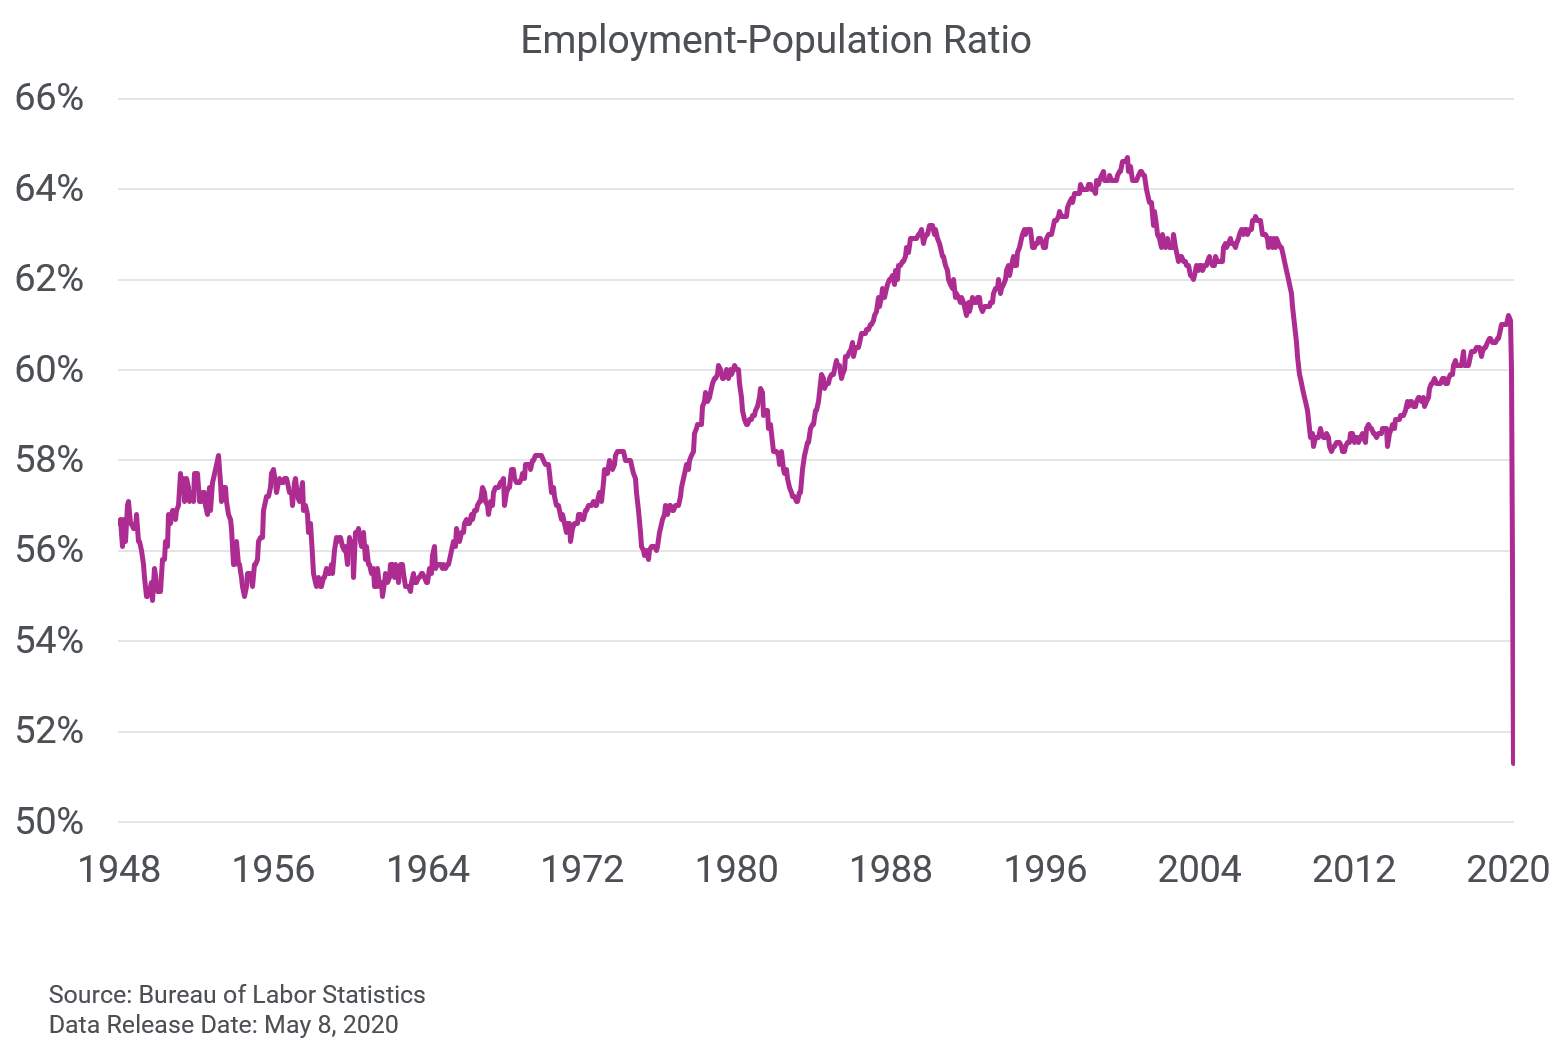
In the current environment where people are bouncing rapidly between employed, unemployed, underemployed, and out of the labor force, tracking the employment-population ratio provides a more stable baseline to view the economic environment.

The latest data shows that the employment-population ratio dropped to the lowest level on record of 51.3% in April. This means that only half of people who are of working age in the U.S. are currently employed in some form.
Unlike the unemployment rate, which is calculated by dividing the number of unemployed workers by the labor force and thus subject to more variation as people start and stop looking for work, the employment to population ratio is the percentage of the total working-age population that is currently employed. By having a more stable baseline, it is easier to locate trends and see through the market gyrations.
And finally, why it matters
The labor market is the backbone of the economy and is the engine that powers the US consumer. But the ongoing crisis and rapid reallocation of the workforce has made it difficult to get a clear picture on what is happening at the ground level. By going beyond the headlines, businesses and financial institutions can glean nuanced insights that provide a better view of where the opportunities lie and how the recovery is likely to unfold.


