Loading...

How a Sales-Based Attribution Approach Can Drive Sales

Published: June 29, 2018 by James Maguire

There are many factors attributing to the success of dealerships. When it comes to dealers, empirical guidance is a great way to study effective advertising. Experian brought Auto, Targeting, and the Dealer Positioning System capabilities together in a nationwide study to answer the ultimate question: what drives sales?

The answers can be found in Experian’s 2018 Attribution Study. This is a wide-ranging, dealer-focused sales-driven attribution study that analyzed a few key variables. We deployed 187,701 tracking pixels to devices in 41,012 distinct households, focused on 15 digital metrics to learn about shopper behavior, and tied that digital shopping data to 2,436 vehicle sales.

An industry first, Experian’s ability to combine automotive registration data, sales data, and website analytics and online behavior data puts us in a position to do something that very few companies can do. We use the household identifiers to not only see who bought a car and who bought specifically from a participating dealer, but also how they shopped the dealer’s site. Our ability to accurately identify a household’s digital behavior is based on the fact that we are a source compiler of the data and have it sitting under one roof.  Others that attempt to provide this type of insight need to contract out for registrations, sales data imports from the dealership, website analytics, household identifiers, or all the above, which generally adds time to the insights.

Using our sales-based approach, we can deliver unbiased attribution. Sales-based attribution is attributing credit to different advertising sources/campaigns based on actual vehicle sales – including those targeted consumers that may have purchased outside of the dealership. This is the Holy Grail of attribution for car dealers since it ties an offline activity such as buying a car back to the online advertising that’s taking up most their budgets every month. Because of that offline-online disconnect, sales-based attribution is difficult.

Other automotive attribution models are typically focused on website conversions or website behavior – “what advertising can I attribute website leads to” (conversions) or “what advertising is driving users who follow the behavior that I think shows they’re likely to buy from my dealership” (website behavior.)

What are the takeaways?
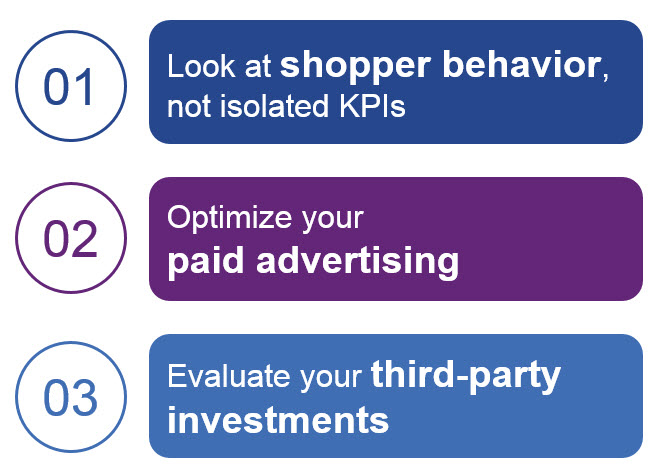
We found three takeaways from our study. First off, we look at shopper behavior instead of isolating KPIs. Later we will discuss how traditional website metrics do not tie-in to sales. Second, we look at optimizing your paid advertising. Finally, we look at third-party investments. Although third parties drive sales, they may not be your sales.

Looking at shopper behavior, not isolated KPI’s

Traditional website metrics don’t tell the sales story for dealers. Traditional conversion stats are equal for buyers vs. all traffic such as VDPs or page views What this means is on average, buyers converted at a lower rate than overall website traffic. Looking solely at form submissions, hours and directions pageviews, and mobile clicks-to-call, don’t give the best view of what advertising is driving sales. With that, 98% of buyer traffic never submitted a form or went to the hours and directions page. This is a typical website conversion that dealers, vendors, and advertising agencies focus on.  Since traditional web metrics don’t tell the story, there is another way. These are called High-Value Users, or HVU. They purchase at a 34% higher rate than overall traffic although they make up 11% of all traffic.
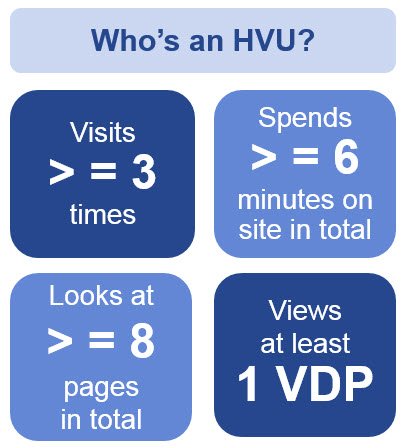
High-Value Users are an Experian derived KPI. What makes someone an HVU are four different measurements.

  • They must visit a website at least three times
  • Spend at least six minutes on the site in total
  • View at least eight pages in total
  • View at least one VDP

High-Value Users correlates to sales better than Vehicle Detail Page or VDP metrics. In this study, the correlation for VDP was measured at .595 which is rated a medium correlation. Meanwhile, HVU scored a .698 which is rated a high correlation. Looking at many different behavioral KPIs, like we do with our High-Value User (HVU) metric, correlates better to sales than just looking at how many VDPs you had. Driving more VDPs won’t necessarily help sales. But driving more HVUs is more likely to correlate with more sales. This also gets back to the attribution discussion above: Experian sales-based attribution is the best, and Experian’s HVUs are a good method for web-based attribution.

From this attribution study, High-Value Users are a vital group for dealers to utilize. In our next post, we will go over the second and third takeaways from the attribution study: optimizing paid advertising and evaluating third-party investments.

Related Posts

Lorem ipsum dolor sit amet, consectetur adipiscing elit. Phasellus at nisl nunc. Sed et nunc a erat vestibulum faucibus. Sed fermentum placerat mi aliquet vulputate. In hac habitasse platea dictumst. Maecenas ante dolor, venenatis vitae neque pulvinar, gravida gravida quam. Phasellus tempor rhoncus ante, ac viverra justo scelerisque at. Sed sollicitudin elit vitae est lobortis luctus. Mauris vel ex at metus cursus vestibulum lobortis cursus quam. Donec egestas cursus ex quis molestie. Mauris vel porttitor sapien. Curabitur tempor velit nulla, in tempor enim lacinia vitae. Sed cursus nunc nec auctor aliquam. Morbi fermentum, nisl nec pulvinar dapibus, lectus justo commodo lectus, eu interdum dolor metus et risus. Vivamus bibendum dolor tellus, ut efficitur nibh porttitor nec. Pellentesque habitant morbi tristique senectus et netus et malesuada fames ac turpis egestas. Maecenas facilisis pellentesque urna, et porta risus ornare id. Morbi augue sem, finibus quis turpis vitae, lobortis malesuada erat. Nullam vehicula rutrum urna et rutrum. Mauris convallis ac quam eget ornare. Nunc pellentesque risus dapibus nibh auctor tempor. Nulla neque tortor, feugiat in aliquet eget, tempus eget justo. Praesent vehicula aliquet tellus, ac bibendum tortor ullamcorper sit amet. Pellentesque tempus lacus eget aliquet euismod. Nam quis sapien metus. Nam eu interdum orci. Sed consequat, lectus quis interdum placerat, purus leo venenatis mi, ut ullamcorper dui lorem sit amet nunc. Donec semper suscipit quam eu blandit. Sed quis maximus metus. Nullam efficitur efficitur viverra. Curabitur egestas eu arcu in cursus. H1 asdf asdf H2 H3 H4 Lorem ipsum dolor sit amet, consectetur adipiscing elit. Vestibulum dapibus ullamcorper ex, sed congue massa. Duis at fringilla nisi. Aenean eu nibh vitae quam auctor ultrices. Donec consequat mattis viverra. Morbi sed egestas ante. Vivamus ornare nulla sapien. Integer mollis semper egestas. Cras vehicula erat eu ligula commodo vestibulum. Fusce at pulvinar urna, ut iaculis eros. Pellentesque volutpat leo non dui aliquet, sagittis auctor tellus accumsan. Curabitur nibh mauris, placerat sed pulvinar in, ullamcorper non nunc. Praesent id imperdiet lorem. H5 Curabitur id purus est. Fusce porttitor tortor ut ante volutpat egestas. Quisque imperdiet lobortis justo, ac vulputate eros imperdiet ut. Phasellus erat urna, pulvinar id turpis sit amet, aliquet dictum metus. Fusce et dapibus ipsum, at lacinia purus. Vestibulum euismod lectus quis ex porta, eget elementum elit fermentum. Sed semper convallis urna, at ultrices nibh euismod eu. Cras ultrices sem quis arcu fermentum viverra. Nullam hendrerit venenatis orci, id dictum leo elementum et. Sed mattis facilisis lectus ac laoreet. Nam a turpis mattis, egestas augue eu, faucibus ex. Integer pulvinar ut risus id auctor. Sed in mauris convallis, interdum mi non, sodales lorem. Praesent dignissim libero ligula, eu mattis nibh convallis a. Nunc pulvinar venenatis leo, ac rhoncus eros euismod sed. Quisque vulputate faucibus elit, vitae varius arcu congue et. Ut maximus felis quis diam accumsan suscipit. Etiam tellus erat, ultrices vitae molestie ut, bibendum id ipsum. Aenean eu dolor posuere, tincidunt libero vel, mattis mauris. Aliquam erat volutpat. Sed sit amet placerat nulla. Mauris diam leo, iaculis eget turpis a, condimentum laoreet ligula. Nunc in odio imperdiet, tincidunt velit in, lacinia urna. Aenean ultricies urna tempor, condimentum sem eget, aliquet sapien. Ut convallis cursus dictum. In hac habitasse platea dictumst. Ut eleifend eget erat vitae tempor. Nam tempus pulvinar dui, ac auctor augue pharetra nec. Sed magna augue, interdum a gravida ac, lacinia quis erat. Pellentesque fermentum in enim at tempor. Proin suscipit, odio ut lobortis semper, est dolor maximus elit, ac fringilla lorem ex eu mauris. Phasellus vitae elit et dui fermentum ornare. Vestibulum non odio nec nulla accumsan feugiat nec eu nibh. Cras tincidunt sem sed lacinia mollis. Vivamus augue justo, placerat vel euismod vitae, feugiat at sapien. Maecenas sed blandit dolor. Maecenas vel mauris arcu. Morbi id ligula congue, feugiat nisl nec, vulputate purus. Nunc nec aliquet tortor. Maecenas interdum lectus a hendrerit tristique. Ut sit amet feugiat velit. Test Yes asedtsdfd asdf asdf adsf Related Posts

Published: March 1, 2025 by Jon Mostajo, test user

Electric vehicles (EVs) are the topic of conversation in the automotive industry, but we’re continuing to see another fuel type pick up speed. With consumer demand shifting and drivers exploring more fuel-efficient options, the automotive market is leaning back into hybrids. In fact, new retail hybrid registrations grew to 11.5% through Q3 2024, from 9.5% through Q3 2023, according to Experian’s Automotive Market Trends Report: Q3 2024. Meanwhile, EVs increased from 7.7% to 8.2% year-over-year and gasoline vehicles declined to 70.4% this year, from 72.7% last year. Despite EVs gaining notable attention over recent years, some consumers may be factoring in the benefits of opting for a hybrid, such as the convenience of driving a longer distance without facing challenges as charging stations remain limited. As more manufacturers adapt to consumer needs and roll out additional vehicles, data shows 9.1% of 2024 model year vehicles in operation were attributed to hybrids, while 6.2% of 2024 model years were EVs through Q3 2024. Having more models enter the market has shifted the hybrid and plug-in hybrid electric vehicle (PHEV) market share, with the Toyota Camry making up 12.5% of the market share this quarter, a notable increase from 2.4% last year. On the other hand, the Jeep Wrangler 4xe went from having 4.5% of market share last year to 2.4% through Q3 2024. With many consumers continuing to have some concerns around EVs such as range anxiety and charging times, they’re seeking a more practical solution for their daily driving needs. The balance of fuel options provides more convenience—making hybrids an appealing choice for those wanting an EV alternative. It’s important for manufacturers to stay ahead of the competitive market as it’s constantly evolving. Leveraging the most current data can provide solutions that address both feasibility and consumer preference. To learn more about vehicle market trends, view the full Automotive Market Trends Report: Q3 2024 presentation on demand.

Published: January 10, 2025 by John Howard

Electric vehicle (EV) registrations are re-gaining momentum as a wave of more affordable models hit the market, pushing more consumers than ever to make the transition. According to Experian’s State of the Automotive Finance Market Report: Q3 2024, EVs made up 10.1% of new vehicle financing this quarter, increasing more than 30% from last year. Furthermore, 45% of EV consumers leased their vehicle in Q3 2024—resulting in EVs accounting for 17.3% of all new vehicle leasing. Of the top five transacted EV models this quarter, Tesla accounted for three—with the Tesla Model Y leading at 31.8%, followed by the Tesla Model 3 (14.3%) and Tesla Cybertruck (4.9%). Rounding out the top five were the Ford Mustang Mach-E (3.9%) and Hyundai IONIQ 5 (3.7%). Interestingly, data in the third quarter of 2024 found that consumers’ financing decisions vary based on the EV model they’re looking at. For example, 76.5% of consumers purchased the Tesla Model Y with a loan and 13.1% opted for a lease; on the other hand, only 8.5% of consumers bought the Hyundai IONIQ 5 with a loan and 78.7% chose to lease. Despite the rising interest in leasing as more incentives and rebate programs roll out, some consumers still prefer to purchase their EV with a loan. Understanding financing patterns based on different models is key for professionals as they cater to the diverse preferences and determine the long-term viability of certain EVs and their potential for leasing renewals. Snapshot of the overall vehicle finance market As the finance market continues to stabilize, it’s notable that the average interest rate for a new vehicle fell year-over-year, going from 7.1% to 6.6%, respectively. However, average new vehicle loan amounts increased $736 from last year, reaching $41,068 in Q3 2024, and average monthly payments went from $732 to $737 in the same time frame. On the used side, average interest rates saw a slight uptick to 11.7% in Q3 2024, from 11.6% last year. Meanwhile, the average loan amount dropped from $1,195 over the last year to $26,091 this quarter and the average monthly payment declined from $538 to $520 year-over-year. With the overall market shifting and EVs re-sparking interest, automotive professionals should leverage how consumers are purchasing their vehicles based on average payments and the fuel type as more incentives are being offered. Monitoring these insights can unlock opportunities for tailored financing solutions that meet the needs of consumers as preferences continue to evolve. To learn more about automotive finance trends, view the full State of the Automotive Finance Market: Q3 2024 presentation on demand.

Published: December 5, 2024 by Melinda Zabritski

Subscribe to our blog

Enter your name and email for the latest updates.

This site is protected by reCAPTCHA and the Google Privacy Policy and Terms of Service apply.

Subscribe to our Experian Insights blog

Don't miss out on the latest industry trends and insights!
Subscribe