
Despite an unprecedented 18 months since the pandemic was in full force and many Americans were sent home, financial wellness continues to be on the up and up. Consumers continue to manage credit well and the average credit score climbed seven points since 2020 to 695, the highest point in more than 13 years.
In Experian’s 12th annual State of Credit report, the headlines are hopeful regarding how Americans are managing personal finances in the face of the pandemic. The report provides a comprehensive look at the credit performance of consumers across America by highlighting consumer credit scores and borrowing behaviors. This year’s report features data from 2019 pre-pandemic, the 2020 pandemic year, and the start of 2021.
“The findings from this year’s report show something I’ve always believed: Americans are resilient, for the most part they make smart decisions in the face of adversity and they are agile in adjusting their financial habits when the environment or circumstances change,” said Alex Lintner, President, Experian Consumer Information Services.
Highlights of Experian’s State of Credit report:
| 2021 State of Credit Report | 2019 | 2020 | 2021 |
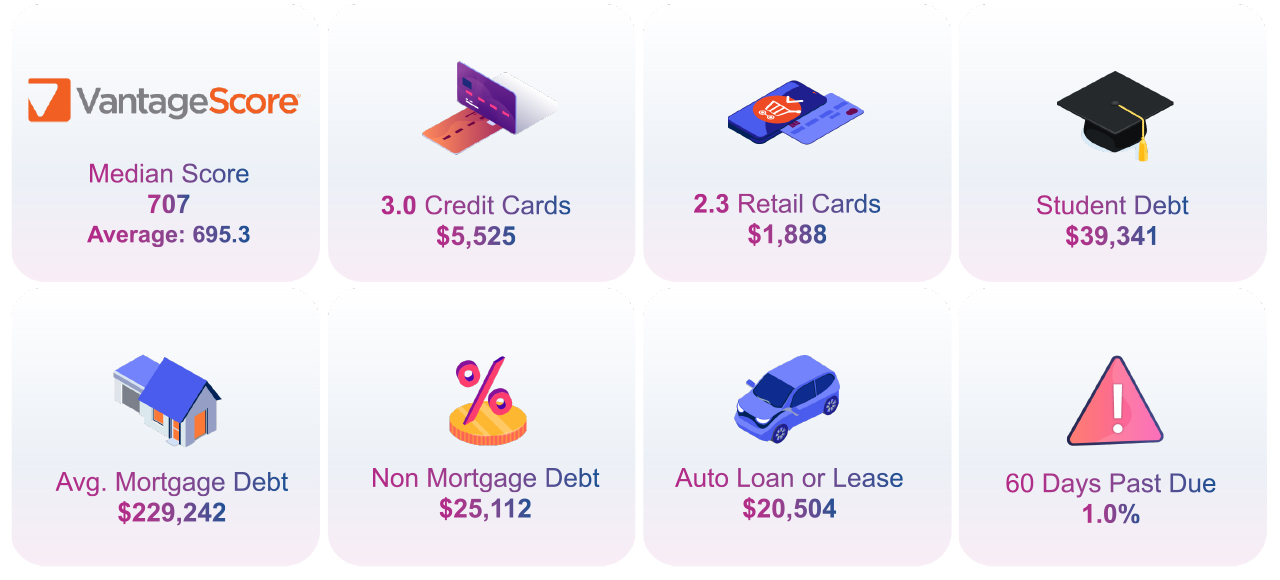
| Average VantageScore® credit score [1] | 682 | 688 | 695 |
| Median VantageScore® credit score | 687 | 697 | 707 |
| Average number of credit cards | 3.0 | 3.0 | 3.0 |
| Average credit card balance | $6,494 | $5,897 | $5,525 |
| Average revolving utilization rate | 30% | 26% | 25% |
| Average number of retail credit cards | 2.50 | 2.42 | 2.33 |
| Average retail credit card balance | $1,930 | $2,044 | $1,887 |
| Average nonmortgage debt | $25,057 | $25,483 | $25,112 |
| Average mortgage debt | $210,263 | $215,655 | $229,242 |
| Average auto loan or lease | $19,034 | $19,462 | $20,505 |
| Average 30–59 days past due delinquency rates | 3.8% | 2.4% | 2.3% |
| Average 60–89 days past due delinquency rates | 1.9% | 1.3% | 1.0% |
| Average 90–180 days past due delinquency rates | 6.6% | 3.8% | 2.5% |
We asked Joseph Mayans, Principal Economist at Advantage Economics, LLC, for his reactions to the findings:
“The State of Credit Report captures the three central themes of the pandemic. First, it shows the overwhelming success of the fiscal support packages. By far, the most striking example of this is the broad based and significant decline in delinquencies during a time when millions of people were out of work. Second, the report showcases the resiliency of American households. People used their stimulus dollars to stay on top of their bills and pay down debt, which boosted average credit scores across all generations. And third, it highlights the unique behavioral shifts brought on by the pandemic. We can see these changes in the rise of housing and auto debt as people bought larger homes and sought to drive rather than ride public transportation.”
Generational Trends
As indicated in the findings, consumers across all generations except Gen Z saw decreased utilization rates and decreased credit card balances year over year. Consumers are also missing fewer payments with notable improvements seen among the youngest consumers.
Mortgage debt was up across every generation, which may correlate with the record low interest rates on mortgages, refinances and moves. According to the CBRE, “the pandemic accelerated several long-standing American migration patterns” as evidenced by more than 15.9 million people filing change-of-address requests with the United States Postal Service. Compared with 2019, 2020 change-of-address requests show a 4% increase in total movers, 2% increase in permanent movers and 27% increase in temporary movers, according to a study by MyMove.
Mayans also made note of the mortgage trends.
“It’s becoming clearer that millennials are stepping into the homebuying phase in a big way. Once thought to be the generation of apartments and urban revival, many older millennials are now buying homes and moving to the suburbs much like their parents before them,” Mayans said. “This will have significant implications for the post-pandemic world, especially as work from home becomes more prevalent.”
State Trends
The states with the highest and lowest average credit score remained unchanged from last year with the highest average score of 726 held by Minnesota and an average score of 666 held by Mississippi.
New Jersey had the highest number of credit cards and retail cards at 3.37 and 2.54 respectively, and Alaska had the highest credit card debt at $7,089 (U.S. average is $5,525) and Texas had the highest retail debt at $2,248 (U.S. average is $1,888).
What Lies Ahead
Some have argued that the past year of the pandemic and quarantine forced a lot of time for reflection. The continued positive trends of consumer behavior seem to indicate some of that effort was put toward better financial health practices. That said, like any sourdough bread recipe or DIY home glow-up, there’s always more to learn and opportunities to seize when it comes to financial health.
“We are committed to working with lenders and the industry to help consumers gain access to credit, driving broader financial inclusion, while also teaching consumers how to responsibly build and use credit responsibly,” Lintner said.
In addition to the free weekly credit report at AnnualCreditReport.com, Experian also offers consumers free access to their credit report and ongoing credit monitoring at Experian.com.
Additional credit education resources and tools
- Join Experian’s #creditchat hosted by @Experian on Twitter with financial experts every Wednesday at 3 p.m. Eastern time. Bilingual and Spanish speakers are also invited to join Experian’s monthly #ChatdeCredito hosted on Twitter at 3 p.m. Eastern time beginning September 16.
- Visit the Ask Experian blog for answers to common questions, advice and education about credit.
- Add positive telecom, utility and streaming service payments to your Experian credit report for an opportunity to improve your credit scores by visiting experian.com/boost[2]
- For additional resources, visit https://www.experian.com/consumereducation
To see all the findings, download the 2021 State of Credit Report.
[1] VantageScore® is a registered trademark of VantageScore Solutions, LLC. VantageScore® credit score range is 300 to 850.
[2] Results may vary. See Experian.com for details


