Loading...

SUVs Continue to Dominate the Automotive Finance Market in Q1 2022

Published: June 29, 2022 by Melinda Zabritski

business woman in auto salon. concept of female driver

We witnessed many changes in the automotive industry since the beginning of the pandemic, but one thing that has stayed consistent is consumers’ desire for larger vehicles, such as SUVs and crossover utility vehicles (CUVs). In fact, they have sustained dominance in the automotive finance market for some time now—partly due to the advancements among newer models, such as increased fuel efficiency and additional cargo space.

According to Experian’s State of the Automotive Finance Market Report: Q1 2022, SUVs and CUVs made up 60.38% of total vehicle financing, an increase from 58.95% in Q1 2021.

Since consumer preferences for larger vehicles have become more prominent, we’ve seen the average loan amounts rising for a while—but this has been exacerbated by the pandemic, with inventory shortages and high consumer demand becoming a core challenge in the automotive industry.

In Q1 2022, the average monthly loan payment for a new vehicle was $648, compared to the average monthly lease, which increased to $522. And the average monthly payment for a used vehicle surpassed $500 this quarter, coming in at $503.

Larger vehicles dominate top leased models

While consumers often lean towards used vehicles as they search for the most budget-friendly option, another option to consider is leasing, as they tend to have a lower monthly payment than a loan. In Q1 2022, there was a $126 difference between average monthly payments of a lease and a new loan.

This is why it’s important for professionals to understand the most prevalent leased vehicles on the market and their price points. This enables them to assist consumers when searching for a vehicle that fits their needs and budget.

With consumers opting for larger, more expensive vehicles such as SUVs, CUVs and full-size pickup trucks, it’s no surprise they made up majority of the top 10 leased models in Q1 2022.

Top 10 leased models Q1 2022

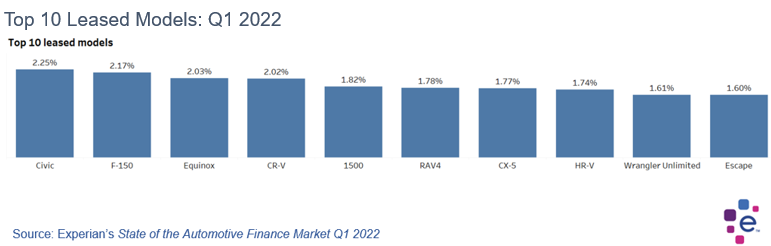
While the Honda Civic made up the highest percentage, it is important to note that it was the only sedan among the top leased vehicles in Q1 2022, accounting for 2.25% of leasing.

It’s really in the new CUVs and SUVs where you can see the difference in monthly payments between a loan and a lease. For instance, the Mazda CX-5 had an average monthly loan payment of $460 this quarter and the average monthly lease payment was $365. While the Chevrolet Equinox was not too far behind, with an average monthly loan payment of $444 and an average monthly lease payment of $319 in Q1 2022.

Consumers have also opted for new CUVs, such as the Honda CR-V, which had an average monthly loan payment of $474 and an average monthly lease payment of $371. Similarly, the Ford Escape had an average monthly loan payment of $436 and the average monthly lease payment was $349.

As we continue to witness automotive financing trends evolve, analyzing the ongoing insights will enable dealers and lenders to help consumers find the most budget-appropriate options in their search for a vehicle that best fits their needs.

To learn more about leasing and other automotive finance trends, watch the entire State of the Automotive Finance Market: Q1 2022 presentation on demand.

Related Posts

Lorem ipsum dolor sit amet, consectetur adipiscing elit. Phasellus at nisl nunc. Sed et nunc a erat vestibulum faucibus. Sed fermentum placerat mi aliquet vulputate. In hac habitasse platea dictumst. Maecenas ante dolor, venenatis vitae neque pulvinar, gravida gravida quam. Phasellus tempor rhoncus ante, ac viverra justo scelerisque at. Sed sollicitudin elit vitae est lobortis luctus. Mauris vel ex at metus cursus vestibulum lobortis cursus quam. Donec egestas cursus ex quis molestie. Mauris vel porttitor sapien. Curabitur tempor velit nulla, in tempor enim lacinia vitae. Sed cursus nunc nec auctor aliquam. Morbi fermentum, nisl nec pulvinar dapibus, lectus justo commodo lectus, eu interdum dolor metus et risus. Vivamus bibendum dolor tellus, ut efficitur nibh porttitor nec. Pellentesque habitant morbi tristique senectus et netus et malesuada fames ac turpis egestas. Maecenas facilisis pellentesque urna, et porta risus ornare id. Morbi augue sem, finibus quis turpis vitae, lobortis malesuada erat. Nullam vehicula rutrum urna et rutrum. Mauris convallis ac quam eget ornare. Nunc pellentesque risus dapibus nibh auctor tempor. Nulla neque tortor, feugiat in aliquet eget, tempus eget justo. Praesent vehicula aliquet tellus, ac bibendum tortor ullamcorper sit amet. Pellentesque tempus lacus eget aliquet euismod. Nam quis sapien metus. Nam eu interdum orci. Sed consequat, lectus quis interdum placerat, purus leo venenatis mi, ut ullamcorper dui lorem sit amet nunc. Donec semper suscipit quam eu blandit. Sed quis maximus metus. Nullam efficitur efficitur viverra. Curabitur egestas eu arcu in cursus. H1 asdf asdf H2 H3 H4 Lorem ipsum dolor sit amet, consectetur adipiscing elit. Vestibulum dapibus ullamcorper ex, sed congue massa. Duis at fringilla nisi. Aenean eu nibh vitae quam auctor ultrices. Donec consequat mattis viverra. Morbi sed egestas ante. Vivamus ornare nulla sapien. Integer mollis semper egestas. Cras vehicula erat eu ligula commodo vestibulum. Fusce at pulvinar urna, ut iaculis eros. Pellentesque volutpat leo non dui aliquet, sagittis auctor tellus accumsan. Curabitur nibh mauris, placerat sed pulvinar in, ullamcorper non nunc. Praesent id imperdiet lorem. H5 Curabitur id purus est. Fusce porttitor tortor ut ante volutpat egestas. Quisque imperdiet lobortis justo, ac vulputate eros imperdiet ut. Phasellus erat urna, pulvinar id turpis sit amet, aliquet dictum metus. Fusce et dapibus ipsum, at lacinia purus. Vestibulum euismod lectus quis ex porta, eget elementum elit fermentum. Sed semper convallis urna, at ultrices nibh euismod eu. Cras ultrices sem quis arcu fermentum viverra. Nullam hendrerit venenatis orci, id dictum leo elementum et. Sed mattis facilisis lectus ac laoreet. Nam a turpis mattis, egestas augue eu, faucibus ex. Integer pulvinar ut risus id auctor. Sed in mauris convallis, interdum mi non, sodales lorem. Praesent dignissim libero ligula, eu mattis nibh convallis a. Nunc pulvinar venenatis leo, ac rhoncus eros euismod sed. Quisque vulputate faucibus elit, vitae varius arcu congue et. Ut maximus felis quis diam accumsan suscipit. Etiam tellus erat, ultrices vitae molestie ut, bibendum id ipsum. Aenean eu dolor posuere, tincidunt libero vel, mattis mauris. Aliquam erat volutpat. Sed sit amet placerat nulla. Mauris diam leo, iaculis eget turpis a, condimentum laoreet ligula. Nunc in odio imperdiet, tincidunt velit in, lacinia urna. Aenean ultricies urna tempor, condimentum sem eget, aliquet sapien. Ut convallis cursus dictum. In hac habitasse platea dictumst. Ut eleifend eget erat vitae tempor. Nam tempus pulvinar dui, ac auctor augue pharetra nec. Sed magna augue, interdum a gravida ac, lacinia quis erat. Pellentesque fermentum in enim at tempor. Proin suscipit, odio ut lobortis semper, est dolor maximus elit, ac fringilla lorem ex eu mauris. Phasellus vitae elit et dui fermentum ornare. Vestibulum non odio nec nulla accumsan feugiat nec eu nibh. Cras tincidunt sem sed lacinia mollis. Vivamus augue justo, placerat vel euismod vitae, feugiat at sapien. Maecenas sed blandit dolor. Maecenas vel mauris arcu. Morbi id ligula congue, feugiat nisl nec, vulputate purus. Nunc nec aliquet tortor. Maecenas interdum lectus a hendrerit tristique. Ut sit amet feugiat velit. Test Yes asedtsdfd asdf asdf adsf Related Posts

Published: March 1, 2025 by Jon Mostajo, test user

The automotive industry is constantly changing. Shifting consumer demands and preferences, as well as dynamic economic factors, make the need for data-driven insights more important than ever. As we head into the National Automobile Dealers Association (NADA) Show this week, we wanted to explore some of the trends in the used vehicle market in our Special Report: State of the Automotive Finance Market Report. Packed with valuable insights and the latest trends, we’ll take a deep dive into the multi-faceted used vehicle market and better understand how consumers are financing used vehicles. 9+ model years grow Although late-model vehicles tend to represent much of the used vehicle finance market, we were surprised by the gradual growth of 9+ model year (MY) vehicles. In 2019, 9+MY vehicles accounted for 26.6% of the used vehicle sales. Since then, we’ve seen year-over-year growth, culminating with 9+MY vehicles making up a little more than 30% of used vehicle sales in 2024. Perhaps more interesting though, is who is financing these vehicles. Five years ago, prime and super prime borrowers represented 42.5% of 9+MY vehicles, however, in 2024, those consumers accounted for nearly 54% of 9+MY originations. Among the more popular 9+MY segments, CUVs and SUVs comprised 36.9% of sales in 2024, up from 35.2% in 2023, while cars went from 44.3% to 42.9% year-over-year and pickup trucks decreased from 15.9% to 15.6%. 2024 highlights by used vehicle age group To get a better sense of the overall used market, the segments were broken down into three age groups—9+MY, 4-8MY, and current +3MY—and to no surprise, the finance attributes vary widely. While we’ve seen the return of new vehicle inventory drive used vehicle values lower, it could be a sign that consumers are continuing to seek out affordable options that fit their lifestyle. In fact, the average loan amount for a 9+MY vehicle was $19,376 in 2024, compared to $24,198 for a vehicle between 4-8 years old and $32,381 for +3MY vehicle. Plus, more than 55% of 9+MY vehicles have monthly payments under $400. That’s not an insignificant number for people shopping with the monthly payment in mind. In 2024, the average monthly payment for a used vehicle that falls under current+3MY was $608. Meanwhile, 4-8MY vehicles came in at an average monthly payment of $498, and 9+MY vehicles had a $431 monthly payment. Taking a deeper dive into average loan amounts based on specific vehicle types—as of 2024, current +3MY cars came in at $28,721, followed by CUVs/SUVs ($31,589) and pickup trucks ($40,618). As for 4-8MY vehicles, cars came in with a loan amount of $22,013, CUVs/SUVs were at $23,133, and pickup trucks at $31,114. Used 9+MY cars had a loan amount of $19,506, CUVs/SUVs came in at $17,350, and pickup trucks at $22,369. With interest rates remaining top of mind for most consumers as we’ve seen them increase in recent years, understanding the growth from 2019-2024 can give a holistic picture of how the market has shifted over time. For instance, the average interest rate for a used current+3MY vehicle was 8.0% in 2019 and grew to 10.2% in 2024, the average rate for a 4-8MY vehicle went from 10.3% to 12.9%, and the average rate for a 9+MY vehicle increased from 11.4% to 13.8% in the same time frame. Looking ahead to the used vehicle market It’s important for automotive professionals to understand and leverage the data of the used market as it can provide valuable insights into trending consumer behavior and pricing patterns. While we don’t exactly know where the market will stand in a few years—adapting strategies based on historical data and anticipating shifts can help professionals better prepare for both challenges and opportunities in the future. As used vehicles remain a staple piece of the automotive industry, making informed decisions and optimizing inventory management will ensure agility as the market continues to shift. For more information, visit us at the Experian booth (#627) during the NADA Show in New Orleans from January 23-26.

Published: January 21, 2025 by Melinda Zabritski

Electric vehicles (EVs) are the topic of conversation in the automotive industry, but we’re continuing to see another fuel type pick up speed. With consumer demand shifting and drivers exploring more fuel-efficient options, the automotive market is leaning back into hybrids. In fact, new retail hybrid registrations grew to 11.5% through Q3 2024, from 9.5% through Q3 2023, according to Experian’s Automotive Market Trends Report: Q3 2024. Meanwhile, EVs increased from 7.7% to 8.2% year-over-year and gasoline vehicles declined to 70.4% this year, from 72.7% last year. Despite EVs gaining notable attention over recent years, some consumers may be factoring in the benefits of opting for a hybrid, such as the convenience of driving a longer distance without facing challenges as charging stations remain limited. As more manufacturers adapt to consumer needs and roll out additional vehicles, data shows 9.1% of 2024 model year vehicles in operation were attributed to hybrids, while 6.2% of 2024 model years were EVs through Q3 2024. Having more models enter the market has shifted the hybrid and plug-in hybrid electric vehicle (PHEV) market share, with the Toyota Camry making up 12.5% of the market share this quarter, a notable increase from 2.4% last year. On the other hand, the Jeep Wrangler 4xe went from having 4.5% of market share last year to 2.4% through Q3 2024. With many consumers continuing to have some concerns around EVs such as range anxiety and charging times, they’re seeking a more practical solution for their daily driving needs. The balance of fuel options provides more convenience—making hybrids an appealing choice for those wanting an EV alternative. It’s important for manufacturers to stay ahead of the competitive market as it’s constantly evolving. Leveraging the most current data can provide solutions that address both feasibility and consumer preference. To learn more about vehicle market trends, view the full Automotive Market Trends Report: Q3 2024 presentation on demand.

Published: January 10, 2025 by John Howard