Tag: auto

Amid the fallout of COVID-19, I often find myself thinking about the impact the pandemic has had and will have on businesses in the coming months—particularly those within the automotive industry. The impact has reached all facets of the industry, leaving dealerships to take unprecedented action. Some have temporarily closed, while many have shifted business priorities to focus on maintenance and repair. Like everyone, we in the automotive industry are concerned about the health and safety of our family, friends and communities. Much like the rest of small business owners, those that oversee dealerships are also concerned about the wellbeing of their work families. The automotive industry is a pillar of our economy, and dealerships are staples within our local communities. Experian has an unwavering commitment to help the industry navigate these uncertain times and address challenges as they arise. The pandemic has impacted groups of people differently and at different times. It’s important for those within the automotive industry to understand how consumer sentiment and priorities will shift over the coming months, in order to address their most pressing needs. As such, Experian launched a daily survey of the general population to gain insight into shifting consumer sentiment as a result of the pandemic. The survey reveals how consumers are dealing with the outbreak across key industries, including automotive. As of May 4, 2020, only 20 percent of Americans plan on buying a new car, truck, van or motorcycle within the next few months, and of those, only 50 percent plan to continue the purchase as planned. 26 percent plan to delay the purchase a few months. While car shopping may not be a priority for most in the coming months, there are consumers who will need to replace their vehicle sooner rather than later—perhaps their lease is set to expire, or they’ve experienced car trouble. In these instances, it’s important for dealers to be able to connect with these consumers to help them understand the options available to them. With this urgency in mind, Experian is providing dealers with complimentary access to nationwide and local automotive market trends. The information will be updated weekly to help dealers gain insight into current sales trends and website traffic, better understand in-market car shoppers and identify the most effective communications channels. For instance, during the week of April 27, dealer website traffic was down 11 percent from the same time last year. That said, web site traffic has picked back up over the past few weeks.. With the short- and long-term impacts of the pandemic largely unknown, dealerships must adapt quickly. Consumers' vehicle needs will shift based on circumstance, and it’s important for dealers to continually assess the market. We are all adapting to our new environment, and will need to collaborate to find ways to combat the fallout—it’s a difficult time for many, including dealers. The automotive market will recover, and Experian is committed to helping the automotive industry navigate the recovery and ensure car shoppers can find vehicles that meet their needs. To view the Automotive Trends & Marketing Insights and sign up to receive your complimentary local market trends, click here. To view the Consumer Sentiment Index, click here.

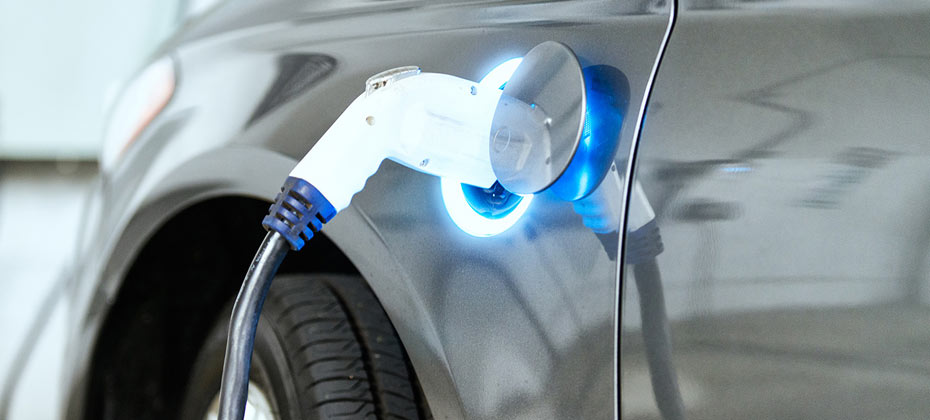
Essential personnel and organizations are working tirelessly to deliver food and other resources, not to mention, protecting the health and safety of those around us. These vehicles still require proper maintenance and care to ensure they run smoothly. That’s where the automotive industry can help.

In uncertain times, we need to find ways to adapt to our situation. We want to help you manage through this unprecedented period.

If there is one word to describe the automotive finance market in Q4 2019, it’s stable. By nearly every measure, the automotive finance market continued to move along at a good pace.

According to Experian’s Q3 2019 State of the Automotive Finance Market report, used vehicle financing increased across all credit tiers.
Electric vehicles have 2.08 percent of total VIO share through September 30, 2019
The Experian Automotive Intelligence Engine™ enables dealers to find and reach potential customers

The average new vehicle loan hit $32,119 in Q2 2019. Average used vehicle loan amounts reached $20,156 in Q2 2019.

Experian Boost provides a unique opportunity to help dealers build loyalty while helping consumers.

Pickups are the most common vehicle in operation at 20% share today and hold 16.5% of new vehicle registrations in the market in Q1 2019.
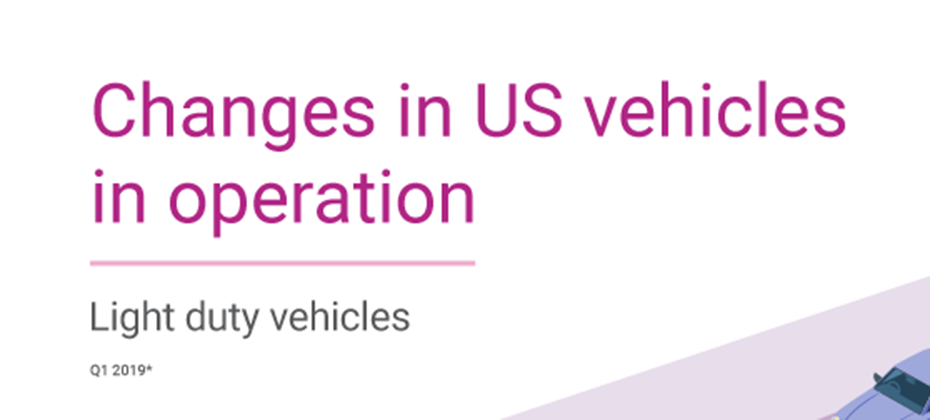
There were 276 million vehicles on the road in Q1 2019.

Beginning with the birth of stock muscle cars, like the Pontiac GTO, vehicles with powerful V8 engines permeated the roads in the 1960s. Given consumers’ “need for speed,” these vehicles were synonymous with American culture following World War II - some going as far as to call muscle cars as American as apple pie. It’s no doubt that these vehicles have made an undeniable lasting impression on the automotive industry. Today, there are still automotive enthusiasts who appreciate the style and strength of the muscle car, but most of us want practical vehicles with better fuel economy and easy maintenance. This has resulted in a dramatic increase in the volume of 4-cylinder vehicles on the road. As seen in the graphic above, over the last 11 years, 4-cylinder engines have increased in volume over 55%, 6-cylinder have declined 4% and 8-cylinders have increased 9.8%. More power, smaller engines This trend doesn’t necessarily mean that those of us who elect for a smaller engine size aren’t able to satisfy our need for speed. Horsepower has received a significant boost over the past two decades. This has been partially driven by EPA guidelines, as manufacturers have implemented engine enhancements to increase gas mileage to meet the guidelines, resulting in higher horsepower. 4-cylinder engines have as much horsepower today as 6-cylinder engines had in 2003. That gives today’s drivers a lot more pep in engine performance. Similarly, today's 6-cylinder engines have nearly the same horsepower today that V8s had in 2009. Where does that leave true muscle car enthusiasts? Well, if you are looking for raw power, things are looking up. In 2018, V8 engines averaged a whopping 370.4 horsepower, nearly double V8 output of 204 horsepower in 1999. Those who buy V8s today have power to burn. Above chart detailing percentage of total volume count and average vehicle MAX HP over history. The automotive market is driven by consumer preferences and offers a range of engine options, which provides something for everyone. The boost in horesepower in today’s engines provides a nice mix of fuel economy and performance. While muscle cars remain an important fixture in American society and automotive culture, demand has shifted and understanding these data points in the broader industry context empowers dealers to make the right inventory decisions. To learn more about the latest automotive trends impacting the marketplace, view the full Q4 2018 Automotive Market Trends Analysis.

When it comes to new vehicle registration, there is one segment that stands out from the pack: crossover vehicles. According to Experian’s Q4 2018 Automotive Market Trends Analysis, over the last four years, crossovers (CUVs) have spiked in popularity, representing about a third of new vehicle registrations in 2014 (34.1 percent), but growing to nearly half the new vehicle market in 2018 (47.6 percent). In fact, the large growth in CUVs isn’t limited to just the last four years – there was a large volume of growth year-over-year compared to 2017; the share has grown nearly 4 percent. Sedans and hatchbacks, meanwhile, have seen their share decrease year-over-year. The charts below detail this change in market, based on Experian’s latest 2018 quarterly findings. Source: Experian Automotive VIO as of December 31, 2018 (light duty registered vehicles only) What’s driving this growth? Across the board, the number of light-duty vehicles on the road continues to increase, up to 275.3 million in the U.S. market, at the end of 2018, compared to 271.4 million a year prior. The growth in CUVs isn’t entirely unprecedented, as it’s been going on for a number of years. CUVs continue to grow in popularity for a variety of reasons including: Greater visibility, as the driver sits higher than in a sedan/coupe Larger storage capacities for passengers or cargo Number of varieties available, such as size, engines, and manufactures Higher fuel efficiency than a full-size SUV or minivan Currently, there are over 130 different CUV/SUV Make/Model combos offered, and of those, the different engines, options, etc. drive that volume even higher. Source: Experian Automotive VIO as of December 31, 2018 (light duty registered vehicles only) Potential for growth Currently, there are only two CUVs among the top vehicles in the aftermarket “sweet spot.” Vehicles in the sweet spot are 6 to 12 model years old, and typically aged out of general OEM warranties for any repairs. These vehicles likely require more part replacement services, which may be performed by aftermarket service shops using parts from aftermarket part manufacturers. According to Experian data, the sweet spot has stopped falling and has settled for now. But, there is expected growth of the number of vehicles that fall into the sweet spot over the coming years. One of the segments where the aftermarket industry can begin to focus on will be CUVs. Source: Experian Automotive VIO as of December 31, 2018 (light duty registered vehicles only) The aftermarket can use this data to make more informed product decisions, specifically, around the high volume of CUVs expected to come into the sweet spot. With the number of vehicle options available on the market today, CUVs will continue to stand out as a segment to watch within the auto industry. There’s a greater story beyond the numbers and understanding how to leverage the data at hand can provide the industry with a greater understanding of CUVs and its potential for even greater growth. To learn more about CUVs/SUVs and total vehicles in operation, view the full Q4 2018 Automotive Market Trends Analysis.

There’s recently been a significant amount of discussion about the stability of the automotive finance industry. Many fear the increase in the volume of delinquent U.S. automotive loans may be an early stage harbinger of the downfall of the automotive industry. But, the fact is, that’s not entirely true. While we certainly want to keep a close eye on the volume of delinquent loans, it’s important to put these trends into context. We’ve seen a steady increase in the volume of outstanding loan balances for the past several years – though the growth has slowed the past few quarters. And while much of the increase is driven by higher loan amounts, it also means there’s been an overall higher volume of vehicle buyers leaning on automotive lenders to finance vehicles. In fact, findings from our Q4 2018 State of the Automotive Finance Market Report show 85.1 percent of all new vehicle purchases were financed in Q4 2018 – compare that to 81.4 percent in Q4 2010 and 78.2 percent in Q4 2006. Suffice it to say, more financed vehicles will undoubtedly lead to more delinquent loans. But that also means, there is a high volume of car buyers who continue to pay their automotive loans in a timely manner. Through Q4 2018, there were nearly 86 million automotive loans and leases that were in good standing. With a higher volume of automotive loans than in the past, we should pay close attention to the percentage of delinquent loans compared to the overall market and compare that to previous years. And when we examine findings from our report, the percentage of automotive loans and leases that were 30-days past due dropped from 2.36 percent to 2.32 percent compared to a year ago. When we look at loans and leases that were 60-days past due, the percentages are relatively stable (up slightly from 0.76 percent to 0.78 percent compared to a year ago). It’s worth noting, these percentages are well below the high-water mark set during Q4 2009 when 3.30 percent of loans were 30-days delinquent and 0.94 percent of loans were 60-days delinquent. But, while the rate of delinquency is down and/or relatively stable year-over-year, it has trended upward since Q4 2015 – we’ll want to stay close to these trends. That said, much of the increase in the percentage of 60-day delinquent automotive loans is a result of a higher percentage of deep subprime loans from previous years – high-risk originations that become delinquent often occur more than 16 months after the origination. Additionally, the percentage of deep subprime originations has steadily decreased over the past two years, which could lead to a positive impact on the percentage of delinquent automotive loans. Despite rising automotive loan amounts and monthly payments, the data shows consumers appear to be making their payments on-time – an encouraging sign for automotive lenders. That said, lenders will want to continue to keep a close eye on all facets of car buyers’ payment performance moving forward – but it is important to put it into context. A clear understanding of these trends will better position lenders to make the right decisions when analyzing risk and provide consumers with comprehensive automotive financing options. To learn more about the State of the Automotive Finance Market report, or to watch the webinar, click here.

A closer look at the data shows GM’s losses might not be particularly significant, despite the announcement of discontinued models.