As we approach 2024, marketers must grasp the evolving landscape of digital activation. Understanding emerging audience trends and activation strategies is key to developing impactful marketing initiatives and positioning your brand for success.
In Experian’s 2024 Digital audience trends and predictions report you’ll find:
- Data-driven insights that will empower you to confidently develop marketing strategies that resonate with your audience and drive meaningful results.
- Insights from Experian experts and our industry-leading data.
- Our outlook for 2024 marketing trends.

In this blog post, we’ll provide a sneak peek of the 2024 marketing trends you can expect in our full report.
Digital activation
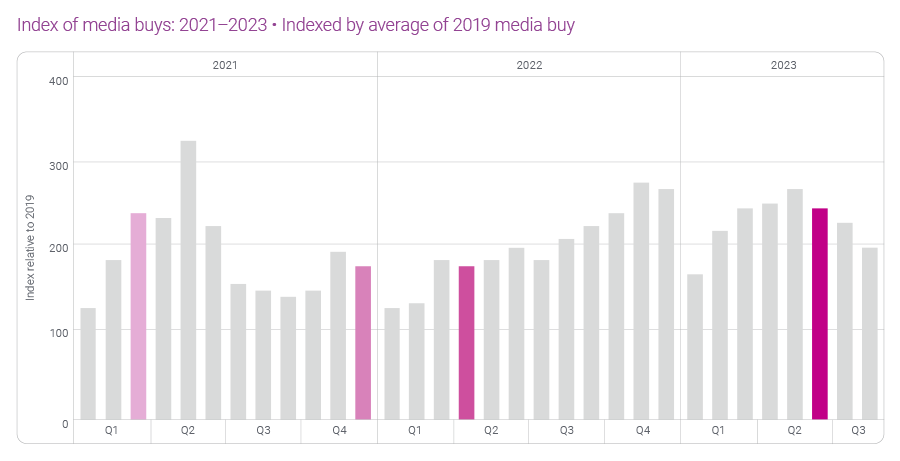
Digital activation grew by 63% between 2022 and 2023. We expect digital activation to increase in 2024 but at a slower rate than in 2023 due to economic uncertainty caused by high-interest rates, recent state privacy regulations, and work stoppages in the entertainment and automotive industries.
Top digital audiences
Which digital audiences are advertisers purchasing from Experian?
We are seeing growth in four major data categories: Automotive, Demographics, Lifestyle and Interests, and Retail Shoppers: Purchase Based audiences. Here are a few audiences within these categories that you can activate on-the-shelf of your preferred platform:
- Automotive: Autos, Cars, and Trucks > In Market-Make and Models
- Demographics: Demographics > Homeowners/Renters > Renter
- Lifestyle and Interests: Lifestyle and Interests (Affinity) > Activities and Entertainment > Wine Lovers
- Retail Shoppers: Purchase Based: Retail Shoppers: Purchase Based > Food and Drink > Restaurants: Fast Food/QSR Chicken Frequent Spenders
Top digital audiences by industry
What are the top digital audiences being activated by industry? Download our 2024 Digital audience trends and predictions report to discover the top digital audiences in the following industries:
- Automotive
- Health
- Financial Services
- Retail & CPG
Download our new 2025 Digital trends and predictions report
Marketers, agencies, and platforms are facing new challenges as privacy regulations evolve, AI technology advances, and consumer behaviors shift. Our latest report highlights actionable strategies for navigating these changes and improving how you connect with audiences, measure impact, and deliver results.
What you’ll learn
- Navigating signal loss: Explore the rise of alternative IDs and contextual targeting as privacy regulations and signal loss reshape data-driven advertising.
- Connected TV (CTV): Understand the growth of connected TV (CTV), the importance of frequency capping, and strategies for effective audience activation.
- Omnichannel campaigns: Learn how marketers are moving from channel-specific strategies to audience-led omnichannel campaigns that tell a more cohesive story.
- Retail media networks: Learn how retail media networks (RMNs) are capitalizing on enriched first-party data to learn more about their customers and reach them across on-site and off-site inventory.
- Curation: Examine how curation is transforming programmatic campaigns by combining audience, contextual, and supply chain signals to deliver premium inventory packages that maximize addressability, efficiency, and performance.
Latest posts

Twenty years ago this week, the first mobile text message, or SMS, was sent by British engineer Neil Papworth. Today, Americans are texting more than ever and among young adults, many of whom were not yet born when the first message was sent, texting is almost as common a mobile activity as talking. And why wouldn’t it be? According to the latest Simmons National Consumer Study, 48% of adults ages 18-to-24 say that a conversation via text message is just as meaningful as a telephone call. A similar share of adults ages 25-to-34 feel the same way. Regardless of age, texting is still, technically, the second most common activity that Americans engage in on their cell phone after talking. During a typical week, 95% of mobile adults talk on their mobile phone, while 59% text. Among adults ages 18-to-24, however, 89% talk on their phone and 85% text. Despite the increasing availability of mobile chat or instant message applications, texting remains the dominant means for exchanging short messages. Only 8% of all mobile adults use their phone to IM or chat. The fastest thumbs To get a more in-depth understanding of the texting habits of adults today, we leveraged data from the Simmons Connect mobile panel of 1,485 U.S. smartphone owners. Hands down, young adults text more than any age other age group. During a typical month, in fact, smartphone-owners ages 18-to-24 send 2,022 mobile text messages and receive another 1,831 for a combined total of 3,852 texts sent and received. With every age bracket we move up, the number of mobile texts drops by roughly 40%. For instance, smartphone owners ages 25-to-34 send, on average, 1,110 text messages a month and receive another 1,130 for a combined total of 2,240 messages. We are also able to leverage the Simmons Connect smartphone panel to understand mobile calling behaviors. The data shows that while young adults hold the record for the most text messages sent and received, they actually make and receive few calls, by comparison. During a typical month, smartphone owners ages 18-to-24 make 119 calls on their mobile phone and answer another 64 calls. Adults ages 35-to-44 make and receive the most calls on their mobile phones in a given month. (Call counts do not include inbound and outbound calls that go unanswered.) Text around the clock Unlike television and radio, which have peak hours for reaching consumers, mobile text messages reach Americans throughout the day, providing advertisers with a medium to connect with consumers any time they want or need. No surprise, young adults are the most likely to send and receive mobile text messages throughout the day. The smartphone panel data shows that during every hour between 8:00 A.M. and midnight, more than half of young smartphone owners are both sending and receiving mobile text messages. Even when most of us are asleep, young adults’ smartphones continue buzzing from inbound texts. In fact, 37% of 18-to-24 year-old smartphone owners receive texts at 4:00 in the morning. By comparison, just 20% of smartphone-owners ages 25-to-34 years-old receive texts at this late (or early) hour as do 17% of those 35-to-44, 15% of those 45-to-54 and 10% of those ages 55 and older. Better to send or to receive? During overnight hours, the share of young smartphone owners who send texts surpasses the share who receives them. However, by 8:00 A.M., the difference between those two figures narrows to the point that they are nearly equal. In fact, from noon until 11:00 P.M., young adults are more likely to send mobile text messages than they are to receive them. Call or text? While texting is still a secondary use of mobile phones after calling, that’s not the case all day, especially among young adults. In fact, while smartphone owners ages 18-to-24 are more likely to make an outbound call than they are to send a text from their phone between 7:00 A.M. and 10:00 P.M., they are more likely to send a text between 11:00 P.M. and 6:00 A.M., during hours when they might understandably wake the recipient. That should help us all sleep a little better.
Black Friday online traffic increased 7% in 2012 versus 2011 as the top 500 retail sites received more than 193.8 million total US visits. So far this Holiday week of online traffic to the top retail sites is up 10% on average. Online retail traffic was up 1% on Black Friday compared to Thanksgiving Day 2012 traffic this year. Amazon.com remained the top visited retail site on Black Friday while Walmart was the second most visited retail site. BestBuy moved up to the 3rd most visited site while Target was the 4th most visited site. JC Penney moved up from being the 8th most visited retail site on Thanksgiving Day to the 5th most visited on Black Friday. Among the top 5 sites, JC Penney saw the biggest day-over-day growth at 26%. Looking at the top 20 retail sites on Black Friday, the Apple Store site saw the biggest day-over-day growth at 99%. Check back for CyberMonday insight and a weekly recap of this week. Learn more about the author, Matt Tatham
The Latino Influence Project came about because we wanted to prove if Hispanics really are influencing the mainstream or not.