
As we approach 2024, marketers must grasp the evolving landscape of digital activation. Understanding emerging audience trends and activation strategies is key to developing impactful marketing initiatives and positioning your brand for success.
In Experian’s 2024 Digital audience trends and predictions report you’ll find:
- Data-driven insights that will empower you to confidently develop marketing strategies that resonate with your audience and drive meaningful results.
- Insights from Experian experts and our industry-leading data.
- Our outlook for 2024 marketing trends.

In this blog post, we’ll provide a sneak peek of the 2024 marketing trends you can expect in our full report.
Digital activation
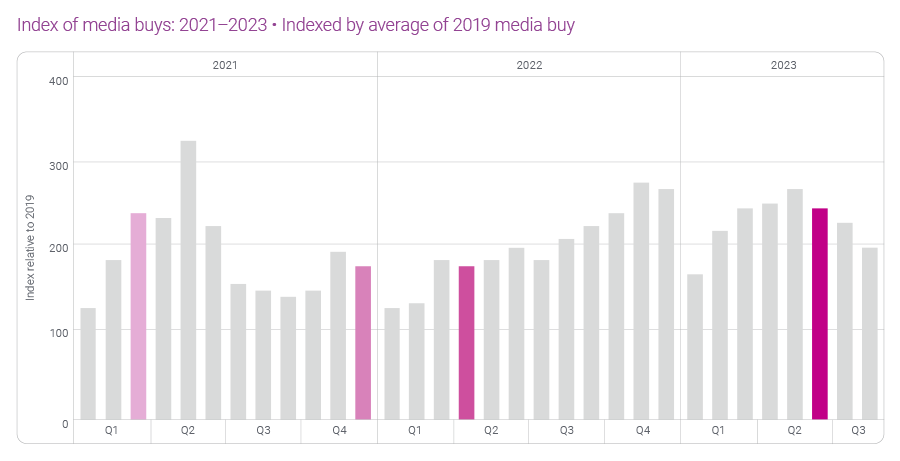
Digital activation grew by 63% between 2022 and 2023. We expect digital activation to increase in 2024 but at a slower rate than in 2023 due to economic uncertainty caused by high-interest rates, recent state privacy regulations, and work stoppages in the entertainment and automotive industries.
Top digital audiences
Which digital audiences are advertisers purchasing from Experian?
We are seeing growth in four major data categories: Automotive, Demographics, Lifestyle and Interests, and Retail Shoppers: Purchase Based audiences. Here are a few audiences within these categories that you can activate on-the-shelf of your preferred platform:
- Automotive: Autos, Cars, and Trucks > In Market-Make and Models
- Demographics: Demographics > Homeowners/Renters > Renter
- Lifestyle and Interests: Lifestyle and Interests (Affinity) > Activities and Entertainment > Wine Lovers
- Retail Shoppers: Purchase Based: Retail Shoppers: Purchase Based > Food and Drink > Restaurants: Fast Food/QSR Chicken Frequent Spenders
Top digital audiences by industry
What are the top digital audiences being activated by industry? Download our 2024 Digital audience trends and predictions report to discover the top digital audiences in the following industries:
- Automotive
- Health
- Financial Services
- Retail & CPG
Download our new 2025 Digital trends and predictions report
Marketers, agencies, and platforms are facing new challenges as privacy regulations evolve, AI technology advances, and consumer behaviors shift. Our latest report highlights actionable strategies for navigating these changes and improving how you connect with audiences, measure impact, and deliver results.
What you’ll learn
- Navigating signal loss: Explore the rise of alternative IDs and contextual targeting as privacy regulations and signal loss reshape data-driven advertising.
- Connected TV (CTV): Understand the growth of connected TV (CTV), the importance of frequency capping, and strategies for effective audience activation.
- Omnichannel campaigns: Learn how marketers are moving from channel-specific strategies to audience-led omnichannel campaigns that tell a more cohesive story.
- Retail media networks: Learn how retail media networks (RMNs) are capitalizing on enriched first-party data to learn more about their customers and reach them across on-site and off-site inventory.
- Curation: Examine how curation is transforming programmatic campaigns by combining audience, contextual, and supply chain signals to deliver premium inventory packages that maximize addressability, efficiency, and performance.
Latest posts

For British Petroleum (BP), 2010 has been marked by the unfortunate developments resulting after the Deepwater Horizon oil rig explosion in the Gulf of Mexico on April 20. Since then, BP’s crisis mismanagement and failed attempts to stop the oil spill have transformed this unfortunate event into an ecological disaster with political and financial consequences for the company. The oil leak has caused BP to lose a noticeable number of its American customers, namely their most loyal consumers. Experian Simmons DataStream shows that between April 26 and June 28, 2010 the percentage of American adults who report going to BP fell from 26.4% to 16.4%, a relative loss of 38% of their client base in just nine weeks. More astounding is the fact that BP’s most loyal consumers (those who said that BP is the gas or service station that they go to most often) declined a relative 56% during the same time. In fact, on June 28, 2010, only 9.5% of adults went to BP most often compared with 21.5% who were loyal to BP the week of the spill. With the flow of oil temporarily ceased and nearing a permanent solution, BP may finally be able to cap the flow of bad publicity and to reverse some of their loss in market share. Experian Simmons will continue to monitor this and other important consumer trends and share those findings here.