
As we approach 2024, marketers must grasp the evolving landscape of digital activation. Understanding emerging audience trends and activation strategies is key to developing impactful marketing initiatives and positioning your brand for success.
In Experian’s 2024 Digital audience trends and predictions report you’ll find:
- Data-driven insights that will empower you to confidently develop marketing strategies that resonate with your audience and drive meaningful results.
- Insights from Experian experts and our industry-leading data.
- Our outlook for 2024 marketing trends.

In this blog post, we’ll provide a sneak peek of the 2024 marketing trends you can expect in our full report.
Digital activation
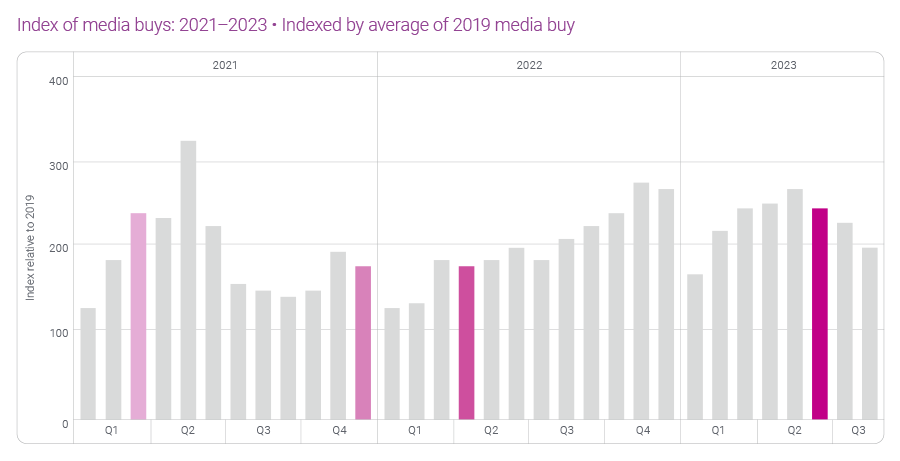
Digital activation grew by 63% between 2022 and 2023. We expect digital activation to increase in 2024 but at a slower rate than in 2023 due to economic uncertainty caused by high-interest rates, recent state privacy regulations, and work stoppages in the entertainment and automotive industries.
Top digital audiences
Which digital audiences are advertisers purchasing from Experian?
We are seeing growth in four major data categories: Automotive, Demographics, Lifestyle and Interests, and Retail Shoppers: Purchase Based audiences. Here are a few audiences within these categories that you can activate on-the-shelf of your preferred platform:
- Automotive: Autos, Cars, and Trucks > In Market-Make and Models
- Demographics: Demographics > Homeowners/Renters > Renter
- Lifestyle and Interests: Lifestyle and Interests (Affinity) > Activities and Entertainment > Wine Lovers
- Retail Shoppers: Purchase Based: Retail Shoppers: Purchase Based > Food and Drink > Restaurants: Fast Food/QSR Chicken Frequent Spenders
Top digital audiences by industry
What are the top digital audiences being activated by industry? Download our 2024 Digital audience trends and predictions report to discover the top digital audiences in the following industries:
- Automotive
- Health
- Financial Services
- Retail & CPG
Download our new 2025 Digital trends and predictions report
Marketers, agencies, and platforms are facing new challenges as privacy regulations evolve, AI technology advances, and consumer behaviors shift. Our latest report highlights actionable strategies for navigating these changes and improving how you connect with audiences, measure impact, and deliver results.
What you’ll learn
- Navigating signal loss: Explore the rise of alternative IDs and contextual targeting as privacy regulations and signal loss reshape data-driven advertising.
- Connected TV (CTV): Understand the growth of connected TV (CTV), the importance of frequency capping, and strategies for effective audience activation.
- Omnichannel campaigns: Learn how marketers are moving from channel-specific strategies to audience-led omnichannel campaigns that tell a more cohesive story.
- Retail media networks: Learn how retail media networks (RMNs) are capitalizing on enriched first-party data to learn more about their customers and reach them across on-site and off-site inventory.
- Curation: Examine how curation is transforming programmatic campaigns by combining audience, contextual, and supply chain signals to deliver premium inventory packages that maximize addressability, efficiency, and performance.
Latest posts

Same-sex marriage is a hot button topic no matter on which side of the issue you stand. But there can be no denying that same-sex couples are finding an expanding number of options in the U.S. and abroad should they decide to legally wed. The 2010 LGBT Consumer Report explores the household arrangements and behaviors of America's LGBT consumers—in particular, those associated with marriage—compared to America's heterosexual population. You will learn that despite being less than half as likely to be married, lesbian, gay and bisexual adults are 22% more likely than their "straight" counterparts to have recently wed or to be planning nuptials for the next year. Looking for that perfect gift for the newly wed couple? You will also get some shopping tips for identifying favored retailers of lesbian, gay and bisexual shoppers. We'll start by sizing the LGBT market. An estimated 3.7% of the non-Hispanic adult population (7.1 million adults) self-identifies as LGBT, which can be broken down as follows: The average heterosexual adult lives in a household with 1.9 other individuals, including adults and kids. By comparison, the average lesbian shares her home with only 1.6 other people. Gay men live in the smallest households, sharing their home with only one other person, on average. Over a third of gay or bisexual men (38%) share their home with at least one other adult male, compared with only 24% of heterosexual men who live under the same roof as another adult male. Thirty-five percent of gay or bisexual men say they live with one (and only one) other adult male, a living arrangement that has a higher chance of consisting of a same-sex, co-habiting couple. Over half of lesbians or bisexual women (53%) share their home with at least one other adult female, compared with only 23% of heterosexual women who live under the same roof as another adult female. Forty-three percent of lesbian or bisexual women say they live with one (and only one) other adult female, a living arrangement that has a higher chance of consisting of a same-sex, co-habiting couple. Lesbian, Gay and Bisexual adults (LGB) as a group are less than half as likely as heterosexuals to be married. Only 26% of LGB adults are wed, compared with 57% of “straight” adults. Of all LGB adults, bisexuals are the most likely group to be married, with over 4 in 10 reporting they are presently wed. Lesbians are more than four and a half times more likely than gay men to be married, with 23% of lesbians having tied the knot versus only 5% of gay men. Lesbian, gay and bisexual adults as a group are 22% more likely than heterosexual adults to have either tied the knot in the last 12 months or have plans to wed in the coming year. 5.7% of lesbian, gay or bisexual adults are newly weds or “soonly” weds vs. 4.6% of heterosexual adults. Lesbian, gay and bisexual adults are twice as likely to shop at Neiman Marcus, making the department store the number one retailer with a wedding registry program among LGB shoppers. With many retailers ending their registry programs in favor of gift cards, we looked at how stores without registry programs stack up among lesbian, gay and bisexual shoppers. LGB adults are almost twice as likely to shop at J. Crew, making the store the number one retailer without a wedding registry program among LGB shoppers.
With the 82nd Academy Awards® just around the corner and only days before final voting ballots are due back to accounting firm PricewaterhouseCoopers, Experian Simmons is taking a close look at the American movie-going population. In any given month, over 56 million adults (26% of the adult population) make a trip to the cinema to take in a film. Movie-going typically reaches its peak in mid-summer, and 2009 was no exception. Experian Simmons DataStreamSM reports that in July of last year, 32% of adults went to movies, the highest level observed at any point in the year. In October of the same year, the percentage of past-month adult cinema-goers had dropped to just 19%, the lowest point observed in all of 2009. In this month’s Consumer Insights report, Experian Simmons sizes the movie-going audience, examines their receptivity to cinema ads—including pre-show commercials and product placement within films—online movie searches as well as Americans’ penchant for tuning into the Academy Awards. All data comes from the Simmons Summer 2009 National Consumer Study. Two-thirds of the adult population have gone to the movies at least once in the last 6 months. Nearly half (46%) have been in the last 90 days and a quarter (26%) have been in the last month. Young adults are, as expected, more likely to go to the movies than older adults, but adults over 50 outnumber young adults when it comes to raw number of movie-goers as you will see in the following chart. Over 147 million individuals have gone to the movies at least once in the last 6 months. With 20.8 million adults ages 18 to 24 going to the movies in the last 6 months, this age group accounts for only 14% of the movie-going population. Adults ages 50 and over, on the other hand, account for 37% of the movie-going population with over 55 million adults in this age group going to the theater at least once in the last 6 months. Among all adults who had been to the movies at least once in the last 6 months, 68% have been at least once in the last 30 days. Many movie-goers (39%) have been only once in the last month and only 7% have been four or more times. Young adults ages 18 to 24 are much more likely than the average movie-goer to have been to the theater in the last month with 75% reporting having been at least once and 10% having been 4 times or more. Experian Simmons DataStreamSM reports similar trends in past 30 day movie-going for 2008 and 2009 with the peak for this behavior occurring in both years on almost the exact same date. During the week of July 22, 2009 32% of adults reported having been to the theater during the last 30 days and during the week of July 21, 2008, 29% reported going. Cinema Blockbusters that month in ’09 included Bruno and Harry Potter and the Half-Blood Prince. In July of ’08, Mama Mia and The Dark Knight were released. When it comes to product placement in movies, frequent cinema-goers are most likely to respond. In fact, 41% of adults who went to the movies 4 or more times in the last 90 days are classified by the Simmons Movie Product Placement segmentation system as “Emulators,” those consumers who notice, remember and are driven to buy products placed into the context of a film. By comparison, only 28% of consumers who went to a movie only once in the last 90 days are Emulators. Forty-eight percent of Horror film fans say they often pay attention to commercials that show along with movie previews in movie theaters making them the most receptive to cinema advertisements followed by Romantic Comedy fans and Family movie fans. Only 39% of Foreign Language or Independent film fans say they pay attention to such ads. Nearly a quarter of all movie-goers get movie information, reviews or show times online in any given month. Aside from the obvious movie sites, you are likely to find movie information seekers on these sites: Californians like foreign language and independent films, whereas New Englanders have more of a penchant for Comedies and Southerners are among the most likely to see Horror films. Below are the top 5 metro areas for finding adults who say they usually see the three selected movie genres when they go to the theater. One-in-seven American adults tuned into the last Academy Awards® ceremony on ABC, including many non-movie-goers. Nine percent of adults who had not been to the movies even once in the past six months tuned into the last awards show and ultimately comprised 19% of all 2009 Oscar® viewers. Still, the more frequently a consumer goes to the movies, the more likely he or she is to watch the annual Academy Awards® ceremony.