
As the vibrant colors of spring emerge, so do opportunities for marketers to engage with their audience in fresh and meaningful ways. Crafting effective spring advertising campaigns requires a deep understanding of your target audience. In this blog post, we’ll explore five key audience categories, each presenting unique opportunities for impactful spring advertising campaigns.

Spring cleaning and home improvement
Embrace the energy of renewal associated with spring cleaning. Target audiences interested in home improvement and organization with Experian syndicated audiences like “Gardening Mothers” or “Home Improvement & DIY Frequent Spenders.” Share tips, hacks, and products that align with the desire for a fresh start, turning mundane chores into exciting opportunities for your brand to shine.
Here are 6 audience segments that you can activate to target consumers focused on spring cleaning and home improvements:
- Purchase Transactions > Household Goods > Frequent Spenders
- Purchase Predictors > Shoppers All Channels > Home Maintenance and Improvement
- Purchase Transactions > DIY and Advice Seekers > High Spenders
- Purchase Transactions > Home Improvement/DIY > High Spenders
- Retail Shoppers: Purchase Based > Home Improvement & DIY > Hardware & Home Improvement
- Retail Shoppers: Purchase Based > Shopping Behavior > Big Box and Club Stores: Walmart Frequent Spenders
Gardening
Spring is the time when consumers are investing in gardening equipment for lawn care. Here are a few audience segments you can activate to target consumers focused on gardening:
- Retail Shoppers: Purchase Based > Home Improvement & DIY > Garden & Landscaping Stores: Frequent Spenders
- Lifestyle and Interests (Affinity) > Hobbies > Gardening
- Lifestyle and Interests (Affinity) > Moms, Parents, Families > Gardening Mothers
- Purchase Predictors > Shoppers All Channels > Lawn and Garden
Movers and new homeowners
Did you know?
44% of new homeowners are between the ages of 25-39*.
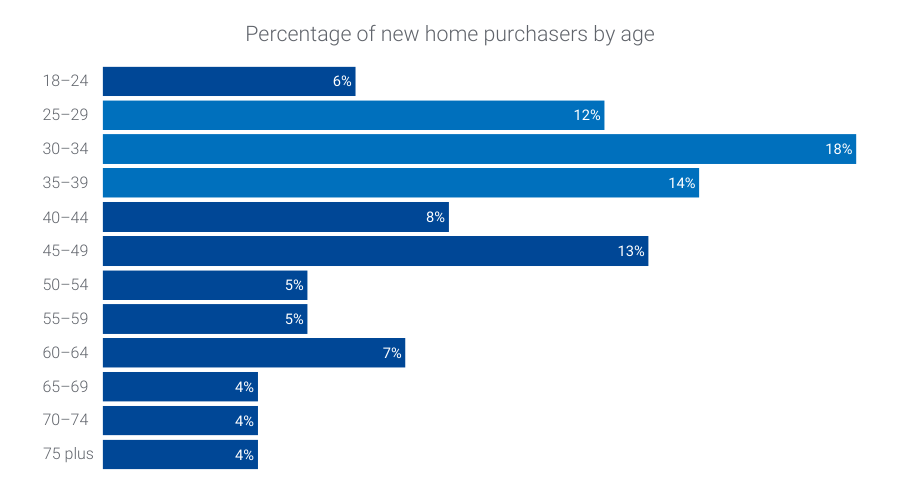
Improve engagement for your spring targeting by pairing our new homeowner audiences with our Demographics > Ages > 25-29, 30-34, and 35-39 syndicated audiences. Here are a few you can activate now:
- Life Events > New Homeowners > Last 6 Months
- Life Events > New Movers > Last 12 Months

Mother’s Day: Unveil the perfect gift
Appealing to the emotion of gratitude and love, Mother’s Day is a significant occasion for marketers. Activate Experian syndicated audiences such as “Mother’s Day Shoppers” and “Florists & Flower Gifts High Spenders” to tailor your spring advertising campaign toward those likely to purchase heartfelt gifts. Share ideas and promotions that resonate with the nurturing and caring spirit of this celebration.
Here are 6 audience segments that you can activate to target consumers getting ready to celebrate Mother’s Day:
- Retail Shoppers: Purchase Based > Seasonal > Mothers Day Shoppers Spenders
- Lifestyle and Interests (Affinity) > Moms, Parents, Families > Mothers with 2+ children
- Mobile Location Models > Visits > Mothers Day Shoppers
- Lifestyle and Interests (Affinity) > Moms, Parents, Families > Moms Age 25-54
- Mobile Location Models > Visits > Jewelry Retail Stores
- Retail Shoppers: Purchase Based > Shopping Behavior > Florists & Flower Gifts: High Spenders

Father’s Day: Celebrate Dads in style
Highlighting the significance of paternal bonds, Father’s Day is an excellent opportunity to showcase thoughtful gifts and experiences. Engage the “Father’s Day Shoppers” or “Growing and Expanding families” with content and products aligned with their interests. Craft a campaign that acknowledges the varied roles fathers play and the unique gifts they would appreciate.
Here are 6 audience segments that you can activate to target consumers getting ready to celebrate Father’s Day:
- Retail Shoppers: Purchase Based > Seasonal > Fathers Day Shoppers Spenders
- Mobile Location Models > Visits > Fathers Day Shoppers
- Mosaic – Personas – Lifestyle and Interests > Group M: Families in Motion > M45 – Growing and Expanding (Young, working-class families and single parent households that live in small city residences)
- Geo-Indexed > Demographics > Presence of Children: Ages: 7-9
- Lifestyle and Interests (Affinity) > Activities and Entertainment > Home Improvement Spenders
- Life Events > New Parents > Child Age 0-36 Months

Plan for the 2024 TV Upfronts
When gearing up for the 2024 upfronts, you can expand your TV planning by incorporating diverse audience categories into your spring advertising campaigns. It’s not just about targeting a demographic; it’s about captivating your unique audience. Whether it’s cord cutters, ad avoiders, avid streamers, or households that watch TV together, understanding and engaging with these distinct segments is paramount. To maximize impact, use comprehensive TV data that goes beyond broad demographics.
Here are 6 audience segments that you can activate as part of your TV planning strategy:
- Retail Shoppers: Purchase Based > Entertainment > Streaming/Video/Audio/CTV/Cable TV: Cable/Broadcast TV: Cord Cutters: Recent
- Retail Shoppers: Purchase Based > Entertainment > Streaming/Video/Audio/CTV/Cable TV: Streaming Video: High Spenders
- Television (TV) > Ad Avoiders/Ad Acceptors > Ad Avoiders
- Television (TV) > TV Enthusiasts > Paid TV High Spenders
- Television (TV) > Ad Avoiders/Ad Acceptors > Ad Acceptors
- Television (TV) > Household/Family Viewing > Pay TV/vMVPD Subscribers Households
To find consumers who are most likely to engage with your TV ads, you can layer in our TrueTouchTM engagement channel audiences:
- TrueTouch: Communication Preferences > Engagement Channel Preference > Digital Video
- TrueTouch: Communication Preferences > Engagement Channel Preference > Streaming TV

Summer preparation: Anticipate the fun ahead
As spring transitions to summer, help your audience gear up for the upcoming season. Target “Summer break travelers” or “Memorial Day Shoppers” with offerings that align with their summer plans. Whether it’s fashion, travel essentials, or outdoor gear, position your brand as an essential companion for their summer adventures.
Here are 6 audience segments that you can activate to target consumers getting ready for summer:
- Mobile Location Models > Visits > Summer Break Travelers
- Retail Shoppers: Purchase Based > Seasonal > Summer Sales Event Shoppers: Independence Day Shoppers
- Retail Shoppers: Purchase Based > Travel > Vacation/Leisure Travelers: Summer Trips
- Mosaic – Personas – Lifestyle and Interests > Group B: Flourishing Families > B09 – Family Fun-tastic (Upscale, middle-aged families with older children that live in suburban areas and lead busy lives focused on their children)
- Mobile Location Models > Visits > Memorial Day Shoppers
- Retail Shoppers: Purchase Based > Seasonal > Summer Sales Event Shoppers: High Spenders: Memorial Day Shoppers
Did you know?
Consumers between the age of 45-49 make up the largest percentage of top apparel shoppers*.
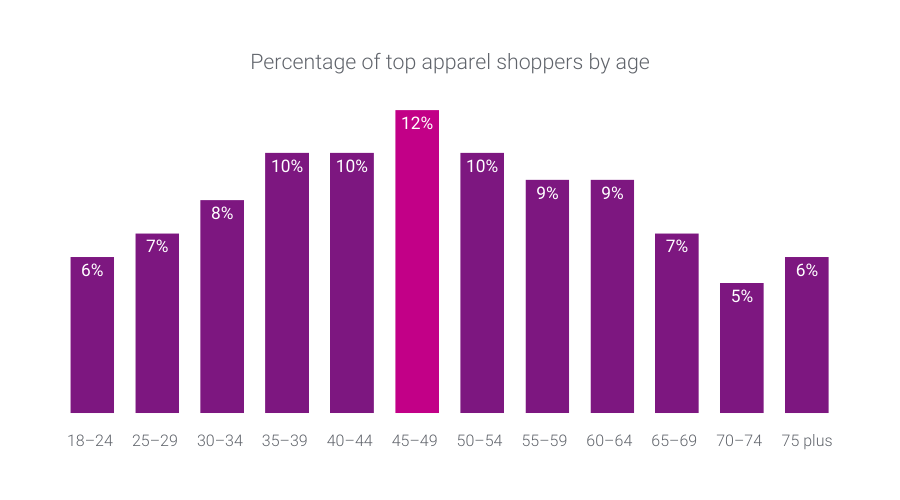
Improve engagement for summer apparel shopping targeting by refining your audience with our Demographics > Ages > 45-49 syndicated audience.
Spring into effective advertising with Experian’s syndicated audiences
For spring advertising campaigns, understanding your audience is the key to success. By activating Experian’s syndicated audiences, you can refine your approach and resonate by activating specific segments. Embrace our syndicated audiences so you deliver campaigns that not only capture attention but also build lasting connections with your audience. As you embark on this spring marketing journey, remember – the possibilities are as endless as the blossoming flowers.
You can activate our syndicated audiences on-the-shelf of most major platforms. For a full list of Experian’s syndicated audiences and activation destinations, download our syndicated audiences guide below.
Check out other seasonal audiences you can activate today.
Footnote
*Experian looked at our demographic and purchase-based data to understand retail trends over the past year. Our demographic and purchase-based data covers credit and debit card usage across 500 top merchants.
Latest posts

The social media space continues to evolve. Pinterest, a site launched in March 2010 that describes itself as an online pinboard to organize and share things you love, recently emerged as one of the top 10 websites within the Hitwise Social Networking & Forums category. The invitation only site received nearly 11 million total visits during the week ending December 17, 2011, almost 40 times the number of total visits versus just six months ago (week ending June 18, 2011). Pinterest content has something for everyone, but the site is dominated by images featuring home décor, crafts, fashion, and food. Not surprisingly, visitors to the site in the 12 rolling weeks ending December 17th skewed female (58%) and between the ages of 25 and 44 (59%). Pinterest and the Social Networking & Forums category both receive their highest share of visits from California and Texas. However, the Social Networking category as a whole over-indexes on share of visits from Northeastern states while Pinterest over-indexes on visits from the states in the Northwest and Southeast. This data indicates that Pinterest visitors have a different profile versus their counterparts visiting other social networking sites such as Facebook and YouTube. In fact, nine of the top ten over-indexed states for Pinterest visitors also over-index for the Hobbies and Crafts category (versus the online population) which is expected given the abundance of crafts content on the website. When comparing the Mosaic USA 2011 types that visit both Pinterest.com and Hobbies and Crafts websites during the 12 weeks ending December 17, 2011, the data shows that Boomers and Boomerangs are the group most likely to visit, particularly the Pinterest website (comprising over 10% of visits). This group of consumers is characterized as baby boomers and young adults who are heavy web users who spend time on house and garden, sports and fitness, and family-oriented websites. This information is useful to companies who wish to target their content to be “pinned” by Pinterest users. Thanks to Lauren Rice, an Analyst with the Strategic Services team at Experian Hitwise for today's analysis.
We are asking marketers – specifically retailers – to take a look back at the Holiday selling season because there are a few steps to take in order to finish out strong and THEN start the new year off right.
With record ad spending predicted for the 2012 election, the rest of the nation will soon be bombarded with television ads “approved by” politicians from the left, right and the center of the political spectrum.