
As the vibrant colors of spring emerge, so do opportunities for marketers to engage with their audience in fresh and meaningful ways. Crafting effective spring advertising campaigns requires a deep understanding of your target audience. In this blog post, we’ll explore five key audience categories, each presenting unique opportunities for impactful spring advertising campaigns.

Spring cleaning and home improvement
Embrace the energy of renewal associated with spring cleaning. Target audiences interested in home improvement and organization with Experian syndicated audiences like “Gardening Mothers” or “Home Improvement & DIY Frequent Spenders.” Share tips, hacks, and products that align with the desire for a fresh start, turning mundane chores into exciting opportunities for your brand to shine.
Here are 6 audience segments that you can activate to target consumers focused on spring cleaning and home improvements:
- Purchase Transactions > Household Goods > Frequent Spenders
- Purchase Predictors > Shoppers All Channels > Home Maintenance and Improvement
- Purchase Transactions > DIY and Advice Seekers > High Spenders
- Purchase Transactions > Home Improvement/DIY > High Spenders
- Retail Shoppers: Purchase Based > Home Improvement & DIY > Hardware & Home Improvement
- Retail Shoppers: Purchase Based > Shopping Behavior > Big Box and Club Stores: Walmart Frequent Spenders
Gardening
Spring is the time when consumers are investing in gardening equipment for lawn care. Here are a few audience segments you can activate to target consumers focused on gardening:
- Retail Shoppers: Purchase Based > Home Improvement & DIY > Garden & Landscaping Stores: Frequent Spenders
- Lifestyle and Interests (Affinity) > Hobbies > Gardening
- Lifestyle and Interests (Affinity) > Moms, Parents, Families > Gardening Mothers
- Purchase Predictors > Shoppers All Channels > Lawn and Garden
Movers and new homeowners
Did you know?
44% of new homeowners are between the ages of 25-39*.

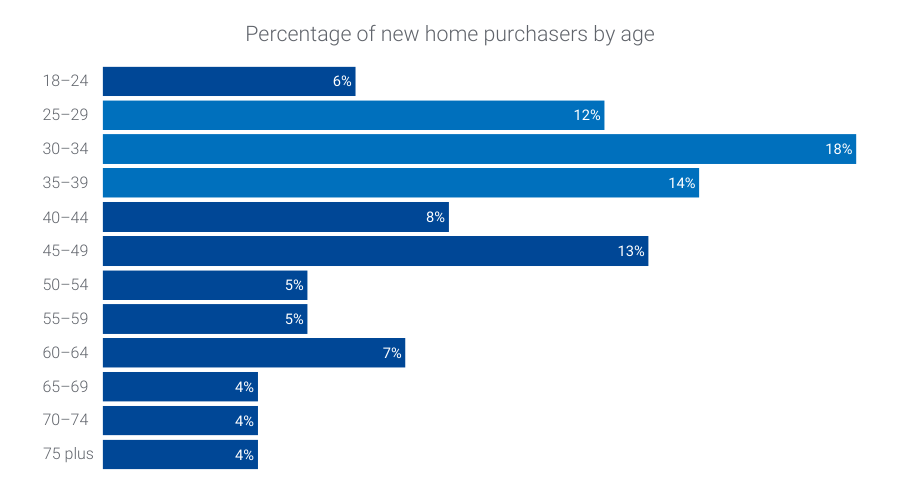
Improve engagement for your spring targeting by pairing our new homeowner audiences with our Demographics > Ages > 25-29, 30-34, and 35-39 syndicated audiences. Here are a few you can activate now:
- Life Events > New Homeowners > Last 6 Months
- Life Events > New Movers > Last 12 Months

Mother’s Day: Unveil the perfect gift
Appealing to the emotion of gratitude and love, Mother’s Day is a significant occasion for marketers. Activate Experian syndicated audiences such as “Mother’s Day Shoppers” and “Florists & Flower Gifts High Spenders” to tailor your spring advertising campaign toward those likely to purchase heartfelt gifts. Share ideas and promotions that resonate with the nurturing and caring spirit of this celebration.
Here are 6 audience segments that you can activate to target consumers getting ready to celebrate Mother’s Day:
- Retail Shoppers: Purchase Based > Seasonal > Mothers Day Shoppers Spenders
- Lifestyle and Interests (Affinity) > Moms, Parents, Families > Mothers with 2+ children
- Mobile Location Models > Visits > Mothers Day Shoppers
- Lifestyle and Interests (Affinity) > Moms, Parents, Families > Moms Age 25-54
- Mobile Location Models > Visits > Jewelry Retail Stores
- Retail Shoppers: Purchase Based > Shopping Behavior > Florists & Flower Gifts: High Spenders

Father’s Day: Celebrate Dads in style
Highlighting the significance of paternal bonds, Father’s Day is an excellent opportunity to showcase thoughtful gifts and experiences. Engage the “Father’s Day Shoppers” or “Growing and Expanding families” with content and products aligned with their interests. Craft a campaign that acknowledges the varied roles fathers play and the unique gifts they would appreciate.
Here are 6 audience segments that you can activate to target consumers getting ready to celebrate Father’s Day:
- Retail Shoppers: Purchase Based > Seasonal > Fathers Day Shoppers Spenders
- Mobile Location Models > Visits > Fathers Day Shoppers
- Mosaic – Personas – Lifestyle and Interests > Group M: Families in Motion > M45 – Growing and Expanding (Young, working-class families and single parent households that live in small city residences)
- Geo-Indexed > Demographics > Presence of Children: Ages: 7-9
- Lifestyle and Interests (Affinity) > Activities and Entertainment > Home Improvement Spenders
- Life Events > New Parents > Child Age 0-36 Months

Plan for the 2024 TV Upfronts
When gearing up for the 2024 upfronts, you can expand your TV planning by incorporating diverse audience categories into your spring advertising campaigns. It’s not just about targeting a demographic; it’s about captivating your unique audience. Whether it’s cord cutters, ad avoiders, avid streamers, or households that watch TV together, understanding and engaging with these distinct segments is paramount. To maximize impact, use comprehensive TV data that goes beyond broad demographics.
Here are 6 audience segments that you can activate as part of your TV planning strategy:
- Retail Shoppers: Purchase Based > Entertainment > Streaming/Video/Audio/CTV/Cable TV: Cable/Broadcast TV: Cord Cutters: Recent
- Retail Shoppers: Purchase Based > Entertainment > Streaming/Video/Audio/CTV/Cable TV: Streaming Video: High Spenders
- Television (TV) > Ad Avoiders/Ad Acceptors > Ad Avoiders
- Television (TV) > TV Enthusiasts > Paid TV High Spenders
- Television (TV) > Ad Avoiders/Ad Acceptors > Ad Acceptors
- Television (TV) > Household/Family Viewing > Pay TV/vMVPD Subscribers Households
To find consumers who are most likely to engage with your TV ads, you can layer in our TrueTouchTM engagement channel audiences:
- TrueTouch: Communication Preferences > Engagement Channel Preference > Digital Video
- TrueTouch: Communication Preferences > Engagement Channel Preference > Streaming TV

Summer preparation: Anticipate the fun ahead
As spring transitions to summer, help your audience gear up for the upcoming season. Target “Summer break travelers” or “Memorial Day Shoppers” with offerings that align with their summer plans. Whether it’s fashion, travel essentials, or outdoor gear, position your brand as an essential companion for their summer adventures.
Here are 6 audience segments that you can activate to target consumers getting ready for summer:
- Mobile Location Models > Visits > Summer Break Travelers
- Retail Shoppers: Purchase Based > Seasonal > Summer Sales Event Shoppers: Independence Day Shoppers
- Retail Shoppers: Purchase Based > Travel > Vacation/Leisure Travelers: Summer Trips
- Mosaic – Personas – Lifestyle and Interests > Group B: Flourishing Families > B09 – Family Fun-tastic (Upscale, middle-aged families with older children that live in suburban areas and lead busy lives focused on their children)
- Mobile Location Models > Visits > Memorial Day Shoppers
- Retail Shoppers: Purchase Based > Seasonal > Summer Sales Event Shoppers: High Spenders: Memorial Day Shoppers
Did you know?
Consumers between the age of 45-49 make up the largest percentage of top apparel shoppers*.

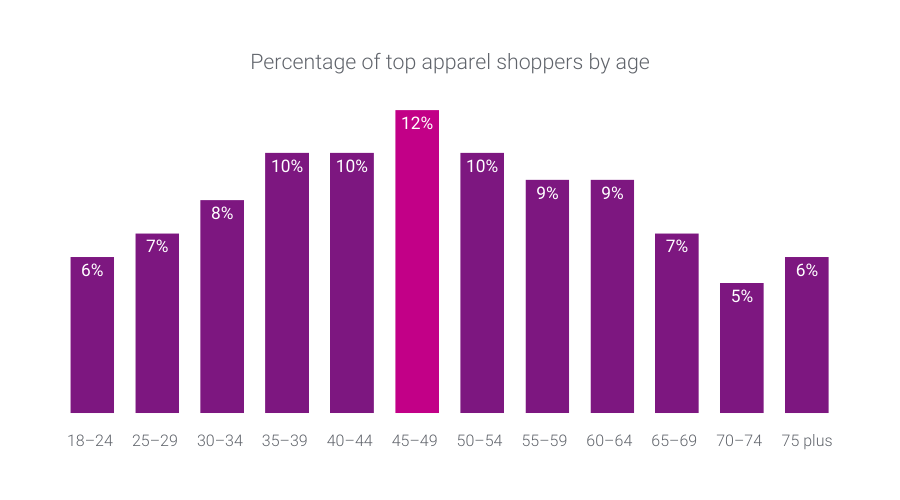
Improve engagement for summer apparel shopping targeting by refining your audience with our Demographics > Ages > 45-49 syndicated audience.
Spring into effective advertising with Experian’s syndicated audiences
For spring advertising campaigns, understanding your audience is the key to success. By activating Experian’s syndicated audiences, you can refine your approach and resonate by activating specific segments. Embrace our syndicated audiences so you deliver campaigns that not only capture attention but also build lasting connections with your audience. As you embark on this spring marketing journey, remember – the possibilities are as endless as the blossoming flowers.
You can activate our syndicated audiences on-the-shelf of most major platforms. For a full list of Experian’s syndicated audiences and activation destinations, download our syndicated audiences guide below.
Check out other seasonal audiences you can activate today.
Footnote
*Experian looked at our demographic and purchase-based data to understand retail trends over the past year. Our demographic and purchase-based data covers credit and debit card usage across 500 top merchants.
Latest posts

According to weekly trend data from Experian Simmons DataStreamSM, the number of U.S. adults paying a monthly visit to microblogging site Twitter.com has fallen during the past year by 14%. As of November 29, 2010, 8.25 million adults had made at least one visit to Twitter.com during the previous 30 days, down from 9.54 million adults who had visited the site in the 30 days prior to November 30, 2009. Does this mean the ultimate “fail whale” is lurking just over the horizon for Twitter? Not just yet. Among those who visit Twitter.com, Simmons DataStream shows that the average number of visits per month rose a relative 37% in the last year. Twitter.com visits in late November 2010, in fact, reached an average of 10.0 visits per month, up from just 7.3 visits per month the year prior. As visit frequency increased, however, the duration of the average Twitter.com session declined, suggesting visitors today are seeking more frequent quick hits, rather than spending longer periods of time reading through posts. According to Experian Hitwise, the average amount of time Twitter.com visitors spend on the site during a typical session fell to 13 minutes, 12 seconds on November 27, 2010, down from an average of 15 minutes, 12 seconds spent on the site each session on November 28, 2009. That said, Americans are still spending more time on Twitter.com than ever before. According to Experian Simmons estimates, Americans spent an estimated 2 hours and 12 minutes tweeting and reading tweets on Twitter.com in November 2010, up from 1 hour and 51 minutes spent on the site during November 2009. Swim on, fail whale, swim on. To tweet this blog post, click on the green “retweet” button at the top of this item. For more information on Simmons DataStream weekly reporting of nearly 40,000 consumer variables, visit our website.

As we ring in the New Year this week, Americans will be tossing back a few adult beverages in celebration. While alcohol consumption certainly increases around holidays and other times of celebration, many Americans imbibe year-round. So where across this great land of ours are you most likely to find adults willing and able to raise a glass (or two) and where are you most likely to be surrounded by teetotalers? Experian Simmons has the answer. Leveraging data from our SimmonsLOCAL study, we examined the drinking patterns of adults of legal drinking age in the 106 Designated Market Areas (DMAs) with populations of at least 500,000 adults age 21 and older. We then ranked those markets by the number of alcoholic beverages consumed by the average adult during a typical month. The chart below lists the DMAs that consume the most alcoholic beverages per capita in a typical month. First place goes to Boston, where the average adult of legal drinking age regularly kicks back 14.4 drinks a month. (Celebrations in Beantown are probably already underway.) Rank DMA Average drinks per month 1 Boston 14.4 2 Austin 13.8 3 Providence-New Bedford 13.4 4 Madison 13.2 4 Hartford & New Haven 13.2 6 Philadelphia 13.1 7 Chicago 13 8 Denver 12.9 9 Tallahassee-Thomasville 12.8 9 Milwaukee 12.8 11 Minneapolis-St. Paul 12.6 11 West Palm Beach-Ft. Pierce 12.6 11 Seattle-Tacoma 12.6 11 Tucson (Sierra Vista) 12.6 15 Green Bay-Appleton 12.5 16 San Diego 12.4 16 Baltimore 12.4 16 Washington, DC 12.4 16 Albany-Schenectady-Troy 12.4 20 New Orleans 12.3 20 St. Louis 12.3 20 Colorado Springs-Pueblo 12.3 23 Burlington-Plattsburgh 12.2 23 Syracuse 12.2 23 Norfolk-Portsmouth-Newport News 12.2 23 Spokane 12.2 23 Portland-Auburn 12.2 Source: Experian Simmons Adult residents of the markets listed below surely know how to have a good time-it's just unlikely to include a cocktail. The chart below lists the DMAs that consume the fewest alcoholic beverages per capita in a typical month. Residents of Chattanooga consume only 6 alcoholic beverages per month, on average, making it the least imbibing market-and probably the one that feels the best the morning after a big gathering. Rank DMA Average drinks per month 106 Chattanooga 6 105 Salt Lake City 7.2 105 Florence-Myrtle Beach 7.2 105 Charleston-Huntington 7.2 105 Tri-Cities, TN-VA 7.2 101 Knoxville 7.4 100 Lexington 7.9 99 Birmingham 8 98 Huntsville-Decatur 8.5 97 Nashville 8.9 97 Evansville 8.9 95 Paducah-Cape Girardeau-Harrisburg-Mt Vernon 9.1 94 Springfield, MO 9.2 94 Tulsa 9.2 94 Greenville-New Bern-Washington 9.2 91 Memphis 9.3 90 Greenville-Spartanburg-Asheville-Anderson 9.4 90 Jackson, MS 9.4 90 Wichita-Hutchinson Plus 9.4 86 Little Rock-Pine Bluff 9.5 86 Louisville 9.5 86 Ft. Smith-Fayetteville-Springdale-Rogers 9.5 83 Fresno-Visalia 9.6 82 Greensboro-High Point-Winston Salem 9.7 82 Roanoke-Lynchburg 9.7 Source: Experian Simmons For more information on SimmonsLOCAL's vivid reporting of consumer behaviors, attitudes, lifestyles and media consumption in 209 Designated Market Areas down to the ZIP code level, visit our website.

The political winds in the United States shifted sharply to the right earlier this month with Republicans making gains across the board. While political party affiliation was a strong indication of a candidate's success in the election, we wondered: Can the political leaning of a TV show's audience determine the success of the program? The answer is yes. Experian Simmons examined the political party registrations of viewers of over 700 television programs measured in the Spring 2010 Simmons National Consumer study. We found that registered Republicans and Democrats, indeed, have different preferences in entertainment programs. But especially noticeable was the preponderance of highly rated Nielsen programs at the top of the Republican list. Not all shows that skew Republican are ratings darlings, of course, but programmers should take note of this fact if ratings are their foremost goal. Republicans: When looking at programs on broadcast TV, we see that Republicans tend to gravitate towards reality shows that center on some sort of competition. In fact, Republicans are 32% more likely to watch The Amazing Race on CBS than the average American adult. They're also 24% more likely to watch American Idol on Fox and 18% more likely to watch America's Got Talent on NBC. The Simmons data provides some evidence that it's the competitive angle of these shows that is attracting Republicans. Specifically, Republicans are fully 29% more likely than the average adult to watch the results show of Dancing with the Stars on ABC and just 17% more likely to watch the non-results episodes of the same show. Republicans tend to gravitate towards reality shows that center on some sort of competition. When it comes to cable entertainment programs, Republicans tend to prefer lifestyle programs on HGTV and TLC. Republicans are also found in high concentrations among many adventure/documentary show audiences, like Ice Road Truckers on History and Deadliest Catch on Discovery. And finally, big families are big draws for Republicans with 18 Kids and Counting and Jon & Kate Plus 8, both on TLC, attracting more than average concentrations of Republican viewers. Top indexing Republican NETWORK programs (non-news, non-music) Republican Index Top indexing Republican CABLE programs (non-news, non-music) Republican Index THE AMAZING RACE (CBS) 132 PROPERTY VIRGINS (HGTV) 125 DANCING WITH THE STARS RESULTS SHOW(ABC) 129 MODERN MARVELS (HISTORY) 121 MODERN FAMILY (ABC) 124 COLOR SPLASH (HGTV) 120 AMERICAN IDOL (FOX) 122 UNSELLABLES (HGTV) 120 V (ABC) 122 LEVERAGE (TNT) 118 THE BIG BANG THEORY (CBS) 119 18 KIDS AND COUNTING (TLC) 116 THE GOOD WIFE (CBS) 119 DEAR GENEVIEVE (HGTV) 116 THE MENTALIST (CBS) 119 WHAT NOT TO WEAR (TLC) 116 AMERICA'S GOT TALENT (NBC) 118 DINERS, DRIVE-INS & DIVES (FOOD NETWORK) 115 SURVIVOR (CBS) 118 HOUSE HUNTERS (HGTV) 115 DANCING WITH THE STARS (ABC) 117 INCOME PROPERTY (HGTV) 114 DESPERATE HOUSEWIVES (ABC) 116 OPERATION REPO (TRU TV) 114 NCIS (CBS) 115 WHITE COLLAR (USA) 114 HUMAN TARGET (FOX) 114 ICE ROAD TRUCKERS (HISTORY) 112 LIE TO ME (FOX) 114 PAWN STARS (HISTORY) 112 THE BACHELOR (ABC) 114 SAY YES TO THE DRESS (TLC) 111 ANTIQUES ROADSHOW (PBS) 113 DIRTY JOBS (DISCOVERY) 110 CASTLE (ABC) 113 MYTHBUSTERS (DISCOVERY) 109 HOW I MET YOUR MOTHER (CBS) 113 JON & KATE PLUS 8 (TLC) 106 THE BACHELORETTE (ABC) 113 AMERICAN LOGGERS (DISCOVERY) 105 EXTREME MAKEOVER: HOME EDITION (ABC) 112 IN PLAIN SIGHT (USA) 104 NCIS: LOS ANGELES (CBS) 112 THROWDOWN WITH BOBBY FLAY (FOOD NETWORK) 104 TWO AND A HALF MEN (CBS) 112 DEADLIEST CATCH (DISCOVERY) 103 FRIDAY NIGHT LIGHTS (NBC) 111 MAN VS. WILD (DISCOVERY) 103 CELEBRITY APPRENTICE (NBC) 109 THE SMOKING GUN PRESENTS:WORLD'S DUMBEST (TRU TV) 103 Democrats: On the left side of the broadcast dial, we see that registered Democrats tend to be drawn to crime and legal dramas like Law & Order and Law & Order: SVU, both on NBC. We also see higher concentrations of Democrats tuning into broadcast shows featuring female characters playing central or leading roles, such as Brothers & Sisters on ABC, Medium on CBS, 30 Rock on NBC and the Good Wife on CBS. The Good Wife, actually, has higher than average concentrations of both registered Democrats and registered Republicans. Given that the program is about the wife of a politician, it's not such a surprise that registered voters from both sides of the aisle tune in. We also see higher concentrations of Democrats tuning into broadcast shows featuring female characters playing central or leading roles. On cable, we see high concentrations of registered Democrats tuning into character-driven dramas, like Dexter and United States of Tara, both on Showtime. Democrats also flock in disproportionate numbers to cable reality shows. But unlike the competitive reality shows favored by Republicans, Democrats prefer observational reality shows where they get to peer into the lives of celebrities or unique and extraordinary people. Top indexing Democrat NETWORK programs (non-news, non-music) Democrat Index Top indexing Democrat CABLE programs (non-news, non-music) Democrat Index FLASHPOINT (CBS) 145 TYLER PERRY'S MEET THE BROWNS (TBS) 189 HOMETIME (PBS) 143 HOUSE OF PAYNE (TBS) 181 90210 (CW) 140 REAL TIME WITH BILL MAHER (HBO) 165 WIFE SWAP (ABC) 136 SNAPPED (OXYGEN) 162 AMERICA'S NEXT TOP MODEL (CW) 135 SHERRI (LIFETIME) 153 NOVA (PBS) 133 HAWTHORNE (TNT) 153 LAW & ORDER (NBC) 132 LIVE FROM THE RED CARPET (E!) 149 SMALLVILLE (CW) 131 DEXTER (SHOWTIME) 147 WHO DO YOU THINK YOU ARE? (NBC) 130 UGLY AMERICANS (COMEDY CENTRAL) 147 BROTHERS & SISTERS (ABC) 127 KOURTNEY & KHLOE TAKE MIAMI (E!) 146 PRIVATE PRACTICE (ABC) 127 TODDLERS & TIARAS (TLC) 145 MEDIUM (CBS) 126 UNITED STATES OF TARA (SHOWTIME) 144 TRUE BEAUTY (ABC) 126 MEET THE NATIVES (TRAVEL CHANNEL) 144 AMERICA'S MOST WANTED (FOX) 126 BRIDEZILLAS (WE TV) 143 30 ROCK (NBC) 126 TOP CHEF MASTERS (BRAVO) 142 VICTORY GARDEN (PBS) 126 WOMEN BEHIND BARS (WE TV) 142 THE GOOD WIFE (CBS) 124 THE BOONDOCKS: ADULT SWIM(CARTOON NETWRK) 142 ONE TREE HILL (CW) 124 TABATHA'S SALON TAKEOVER (BRAVO) 140 NEW YANKEE WORKSHOP (PBS) 122 DOWN HOME WITH THE NEELYS (FOOD NETWORK) 140 LAW & ORDER: SVU (NBC) 122 BAD GIRLS CLUB (OXYGEN) 138 MASTERPIECE (PBS) 122 SCARE TACTICS (SYFY) 136 COMMUNITY (NBC) 122 MILLION DOLLAR LISTING (BRAVO) 135 BIG BROTHER (CBS) 121 MODELS OF THE RUNWAY (LIFETIME) 135 GOSSIP GIRL (CW) 120 TORI & DEAN: HOME SWEET HOLLYWOOD (OXYGEN) 133 FRIDAY NIGHT LIGHTS (NBC) 119 DESTINATION TRUTH (SYFY) 132 For more information about the in-depth consumer behaviors, attitudes, lifestyles, brands and media measured in the Simmons National Consumer Study, visit our website.