Experian is excited to introduce our new Geo-Indexed audiences. Our Geo-Indexed audiences use a new advanced indexing classification technology to identify and reach consumers based on their geo-regional attributes. These audiences can help you discover, segment, and craft messaging for consumers without the use of sensitive personal information, so you can confidently reach your target audience without sacrificing data privacy.
In this blog post, we’ll review how our new Geo-Indexed audiences can help you reach your audience while balancing data privacy and accuracy.
How we collect and use data is changing
The AdTech industry is undergoing a transformation as various forces shape its trajectory. One significant factor is legislation, with as many as 26 states currently considering data privacy laws. Consumer preferences also play a crucial role, as more individuals look to brands for responsible and ethical data handling practices. According to Forbes, 82% of people view brands positively when they consciously opt to refrain from using personal data for personalized ads. Major players in the field such as Apple and Google are actively pushing for a shift away from traditional methods like cookies and other identifiers in data collection and usage. These developments mark a considerable shift in how we use data.
Many brands are seeking a few solutions to continue to find and reach their target audience online, but at Experian, we see a great opportunity for innovation and impact within geo-based targeting solutions.
“We predict that over the next year, you will begin to see innovations in geo-based targeting methodologies that satisfy the industry’s need for audience targeting with responsible data strategies. By embracing innovations in geo-based targeting and adhering to responsible data strategies, you can not only comply with these laws but continue to reach your intended audiences effectively.”
jeremy meade, vp, marketing data & operations
Introducing Experian’s Geo-Indexed audiences
Geo-Indexed audiences from Experian allow brands to reach consumers and households based on geographic regions that over-index for a common set of attributes.
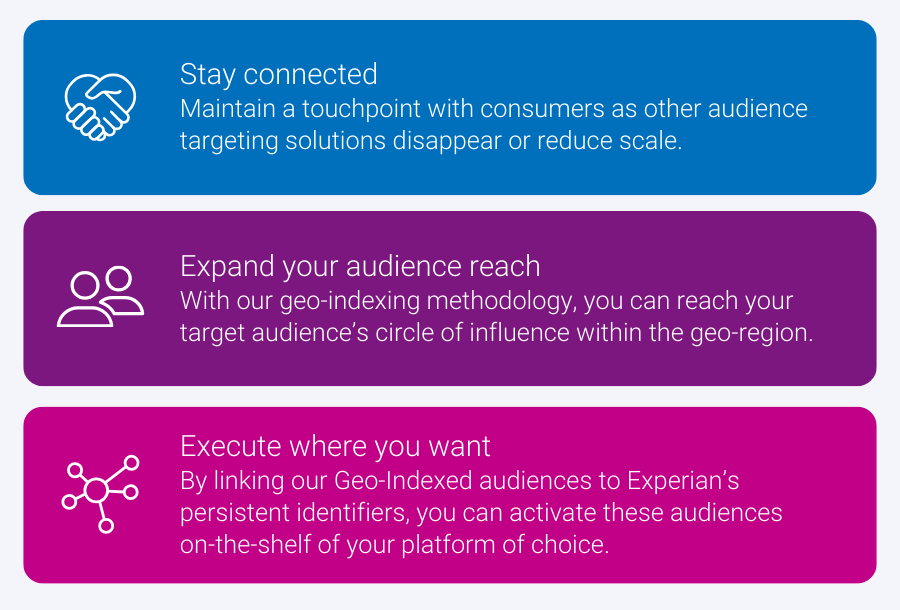
Our Geo-Indexed audiences give brands the ability to:
- Stay connected: Maintain a touchpoint with consumers as other audience targeting solutions disappear or reduce scale due to new legislation.
- Expand your audience reach: With our sophisticated geo-indexing methodology, you will be reaching your target audience’s circle of influence within the geo-region.
- Execute where you want: By linking our Geo-Indexed audiences to Experian’s persistent identifiers, you can activate these audiences on the shelf of your platform of choice.
As a part of the release of Geo-Indexed audiences, we will be rolling out three main categories:
- Language
- Ethnic Group
- Demographics which include:
- Education
- Household Income
- Marital Status
- Occupation
- Presence of Children
Over the next year, we will continue to release new audiences within Geo-Indexed audiences.
How you can use Geo-Indexed audiences
An Auto brand has a new corporate policy restricting the use of sensitive personal information in audience targeting but would like to reach high-income earners. To reach their target audience they use the Geo-Indexed audiences to reach households who are in geographic regions that index highly for income ranges ‘$175,000 – $199,999’ and ‘$200,000+.’
Prioritize privacy without sacrificing accuracy with Experian’s Geo-Indexed audiences
Our Geo-Indexed audiences are available in most major data and demand-side platforms. Visit our partner page for more information.
Don’t see our audiences on your platform of choice? We can help you build and activate an Experian audience on the platform of your choice.
Latest posts

According to Experian Simmons, just over 5% of all U.S. adults and nearly a quarter of adult NCAA men’s tournament viewers (24%) qualify as likely online game streamers. How do you know which ones they are?
While WOM sites like Yelp.com continue to grow, their participants continue to be a very distinct subset of U.S. Internet users.
The audiences for the men’s and women’s NCAA Basketball Tournaments are decidedly different from one another. How do they stack up head-to-head?