
Experian is excited to introduce our new Geo-Indexed audiences. Our Geo-Indexed audiences use a new advanced indexing classification technology to identify and reach consumers based on their geo-regional attributes. These audiences can help you discover, segment, and craft messaging for consumers without the use of sensitive personal information, so you can confidently reach your target audience without sacrificing data privacy.
In this blog post, we’ll review how our new Geo-Indexed audiences can help you reach your audience while balancing data privacy and accuracy.
How we collect and use data is changing
The AdTech industry is undergoing a transformation as various forces shape its trajectory. One significant factor is legislation, with as many as 26 states currently considering data privacy laws. Consumer preferences also play a crucial role, as more individuals look to brands for responsible and ethical data handling practices. According to Forbes, 82% of people view brands positively when they consciously opt to refrain from using personal data for personalized ads. Major players in the field such as Apple and Google are actively pushing for a shift away from traditional methods like cookies and other identifiers in data collection and usage. These developments mark a considerable shift in how we use data.
Many brands are seeking a few solutions to continue to find and reach their target audience online, but at Experian, we see a great opportunity for innovation and impact within geo-based targeting solutions.
“We predict that over the next year, you will begin to see innovations in geo-based targeting methodologies that satisfy the industry’s need for audience targeting with responsible data strategies. By embracing innovations in geo-based targeting and adhering to responsible data strategies, you can not only comply with these laws but continue to reach your intended audiences effectively.”
jeremy meade, vp, marketing data & operations
Introducing Experian’s Geo-Indexed audiences
Geo-Indexed audiences from Experian allow brands to reach consumers and households based on geographic regions that over-index for a common set of attributes.
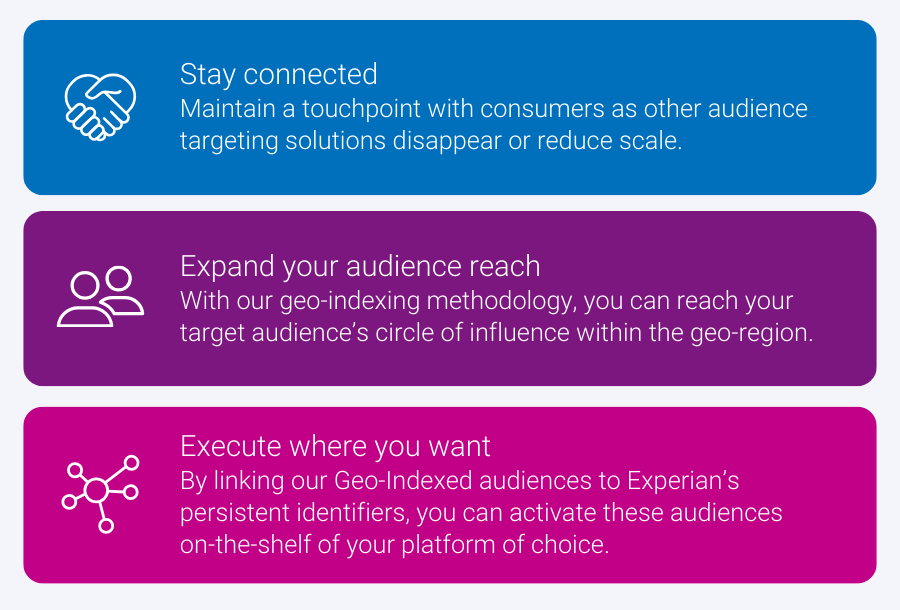
Our Geo-Indexed audiences give brands the ability to:
- Stay connected: Maintain a touchpoint with consumers as other audience targeting solutions disappear or reduce scale due to new legislation.
- Expand your audience reach: With our sophisticated geo-indexing methodology, you will be reaching your target audience’s circle of influence within the geo-region.
- Execute where you want: By linking our Geo-Indexed audiences to Experian’s persistent identifiers, you can activate these audiences on the shelf of your platform of choice.

As a part of the release of Geo-Indexed audiences, we will be rolling out three main categories:
- Language
- Ethnic Group
- Demographics which include:
- Education
- Household Income
- Marital Status
- Occupation
- Presence of Children
Over the next year, we will continue to release new audiences within Geo-Indexed audiences.
How you can use Geo-Indexed audiences
An Auto brand has a new corporate policy restricting the use of sensitive personal information in audience targeting but would like to reach high-income earners. To reach their target audience they use the Geo-Indexed audiences to reach households who are in geographic regions that index highly for income ranges ‘$175,000 – $199,999’ and ‘$200,000+.’
Prioritize privacy without sacrificing accuracy with Experian’s Geo-Indexed audiences
Our Geo-Indexed audiences are available in most major data and demand-side platforms. Visit our partner page for more information.
Don’t see our audiences on your platform of choice? We can help you build and activate an Experian audience on the platform of your choice.
Latest posts

2013 has been a milestone year for those lobbying on behalf of expanded rights of Lesbian, Gay, Bisexual and Transgendered (LGBT) Americans. With 12 states and the District of Columbia now formally recognizing same sex marriages and two highly anticipated rulings from the U.S. Supreme Court expected shortly, the momentum is currently on the side of those seeking greater recognition and support of LGBT-related issues. The speed with which public attitudes have shifted towards greater acceptance of LGBT individuals and their causes has left many marketers scrambling to devise plans that are not only inclusive of LGBT consumers, but in many instances, designed to overtly and publically court this influential and growing consumer segment. The 2013 LGBT consumer report out from Experian Marketing Services delivers insights marketers need to better understand the market that is on everyone’s radar. In this first of a series of blog posts, we’ll highlight key data from the report. Readers can download the full report at any time here. Living out Loud In 2006, when Experian Marketing Services first began measuring sexual orientation among respondents to our Simmons® National Consumer Study, we found that 3.4% of all non-Hispanic adults self-identified as either lesbian, gay, bisexual or transgendered (LGBT), a figure consistent with what leading LGBT researchers predicted at the time. However today, 4.3% of the non-Hispanic adult population self-identifies as LGBT, a figure that has risen slowly but steadily year-after-year. Younger adults have consistently been more likely to identify as LGBT, and in fact today, 5.8 percent of 18 to 34 year olds say they are lesbian, gay, bisexual or transgendered. As a result, the adult LGBT population predictably skews towards the younger age cohorts. Specifically, 36% of LGBT adults today are aged 18 to 34 versus 26% of the heterosexual population in that age range. Likewise, while 20% of heterosexual adults are age 65 and older, just 16% of LGBT adults are in this age range, though our data shows that the share of adults age 65 and older identifying as LGBT has also risen. Home and Family As a growing number of U.S. states pass laws recognizing same-sex marriages and civil unions, we see an increasing percentage of gay and lesbian Americans reporting that they are married. In 2007, for example, when only Massachusetts allowed same-sex marriage, 8% of gay men and 14% of lesbian women said they were married. Today, 17% of gay men and 16% of lesbian women are married. Marriage rates among lesbian and gay adults still lag well behind those of heterosexuals, but the gap is closing from both sides. In fact, while marriage rates are rising among lesbians and gays, they’re falling among heterosexuals. Today, 58% of heterosexual men and 53% of heterosexual women are married, compared to 60% of heterosexual men and 55% of heterosexual women who were married in 2007. The Pink Dollar Income levels are important to consider when targeting consumers, but more important is determining the amount of money left over for non-essentials after the other bills are paid. Despite earning nearly identical salaries, gay men have lower annual household discretionary expenditures than heterosexual men. Likewise, lesbian households have fewer dollars than those of heterosexual women to spend on non-essentials. This is mostly likely due to the fact that both lesbian and gay adults tend to reside in larger cities where the cost of living can be considerably higher than average. Interestingly, when household size is brought into the equation, we see that gay males actually have higher discretionary spending per capita than heterosexual men. In fact, gay men live in households that devote $6,794 per capita annually to non-essentials, which is $753 more than what heterosexual men spend. Forthcoming posts from this series will include insights into the automotive and food vertical markets; the mobile habits of LGBT consumers; and an examination of online visitors to LGBT content sites. Don’t want to wait? Download the full report now. Also, learn more about the Simmons LGBT Consumer Study, the only syndicated, national probability sample survey that measures the lifestyles, attitudes, media habits and brand preferences of the LGBT population giving marketers actionable insights into this powerful consumer segment that can be directly compared with those of heterosexuals.

The importance of affiliate marketing as a marketing channel is evident; it ranks as one of the most effective marketing channels for retailers, along with paid search and e-mail. While effective affiliate marketing relies on two groups, the publishers (affiliates) who display advertisements online and the advertisers (merchants) who aim to increase sales for their online shop, incorporating insights from Experian Marketing Services’ Hitwise can strengthen affiliate programs. I recently worked with Rakuten LinkShare on a webinar which highlights how their affiliate marketing services partnered with Hitwise create a proven package for success by providing valuable and actionable insights to affiliate marketers in understanding and targeting key consumer segments. Identify sites sending traffic to your category For our case study, we examined a custom category of Rakuten LinkShare department store clients and compared them with a category of department store non-clients. Using Hitwise, we examined which publisher sites sent traffic to each of the categories in order to identify the best affiliates to partner with. Among the top 20 publisher websites, a number of fashion and style content websites were sources of traffic to LinkShare Department store clients. Fashion and trend focused affiliate sites, namely ShopStyle and Polyvore, pointed to clear fashion editorial interest amongst those who visited LinkShare department store clients. Consider search terms used to capture consumer interest and intent Next, we looked at generic terms that sent traffic to affiliate site ShopStyle. Terms included searches for products sold in department stores such as variations of “heels” and “dresses”. The data indicates that ShopStyle is a good candidate to partner with because it attracted visits from those who are interested in fashion, looking for a deal, and who are likely in-market for specific products. Monitor effectiveness of affiliate programs and make timely decisions Hitwise can also be used by marketers to evaluate the effectiveness of their affiliate partnerships. For this example, we were able to show that Rakuten LinkShare affiliates sent a larger share of traffic to department store clients versus non-clients, pointing to a clear benefit from affiliate partnerships. As affiliate marketing is an increasingly critical channel for marketers, the importance of selecting the best and most relevant publishers is clear. When used in conjunction with affiliate marketing programs, Hitwise enables marketers to understand competitors’ online distribution and sources of traffic, select the best affiliates to partner with, and quantify the return on investment from partnerships.

New data from Experian Marketing Services’ Simmons® ConnectSM mobile and digital panel sheds light on the way smartphone users spend time using their phone, with the average adult clocking 58 minutes daily on their device. On average, smartphone owners devote 26% of the time they spend on their phone talking and another 20% texting. Social networking eats up 16% of smartphone time while browsing the mobile web accounts for 14% of time spent. Emailing and playing games account for roughly 9% and 8% of daily smartphone time, respectively, while use of the phone’s camera and GPS each take up another 2% of our smartphone day. *Activities include use of a smartphone’s native features dedicated to each activity as well as downloaded apps whose primary function falls under the given activity. For instance, “watch video” includes the act of watching video on the smartphone’s native video player as well as use of video apps such as YouTube, Netflix, etc. iPhone versus Android users Smartphone users may constantly debate which operating system is supreme, but we see clear differences between the ways consumers use their phone depending on the operating system that runs it. For starters, iPhone users spend an hour and fifteen minutes using their phones per day, a full 26 minutes more than the typical Android phone owner. Additionally, iPhone and Android smartphone owners use their phones in markedly different ways. For instance, 28% of the time that Android users spend using their phones is dedicated to talking, whereas iPhone users spend only 22% of their smartphone time talking on the device. Android owners also devote a greater share of time visiting websites on their phone than iPhone owners. On the other hand, iPhone owners spend a disproportionately greater share of smartphone time than Android owners texting, emailing, using the camera and social networking. Note on time spent It may surprise some to read that an activity like watching video accounts for such a small share (less than 1%) of the typical adult’s daily smartphone use. However, for the charts above to sum to a single daily total it was necessary to calculate individual activity contribution using a base of all smartphone owners, including those who don’t spend any time engaging in a given activity during a typical day. The chart below provides additional insights into the time spent engaging in the major smartphone activities examining only those individuals who engaged in each activity during a 24-hour period. I’ve also added into the chart a reach and frequency metric to indicate the popularity of each activity and the number of times per day that individuals engage in them. In the chart, the activities with the largest bubbles are those in which the greatest share of smartphone owners engage during a typical day and include the usual suspects: talking (79%), texting (76%), visiting websites (62%), emailing (61%) and social networking (52%). Activities with the fewest daily participants are: watching video, which 2.3% of smartphone owners do during a typical day, and reading, which just 0.5% of smartphone owners do daily. Given that nearly 98% of smartphone users don’t watch videos on their phone during a typical day, it’s easier to understand why video comprises such a low share of the average adult’s daily smartphone use. However, the chart above reveals that those who do watch video on their phone spend, on average, 5 minutes a day watching videos spread out over 4.2 different viewing sessions. For more information on consumers’ usage of smartphones, digital tablets, computers and other traditional and digital media platforms, check out Simmons Connect.