Originally appeared on MediaPost
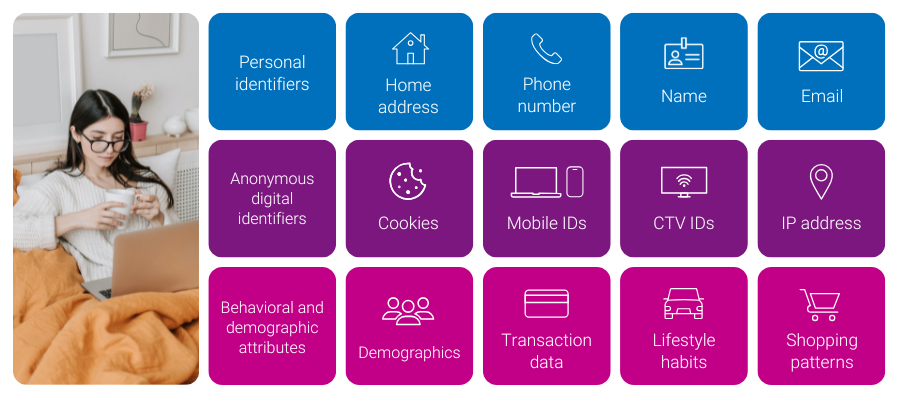
As the digital ecosystem becomes more complex, managing multiple identifiers for consumers has emerged as a significant challenge. From cookies and IP addresses to mobile IDs and universal IDs, marketers and platforms face increasing difficulty in maintaining a unified view of their consumers. Without a coherent identity strategy, campaigns can suffer from poor targeting, limited personalization, and flawed attribution.
Experian understands these challenges and offers solutions to help our partners navigate the complexities of a multi-ID landscape. By utilizing both digital and offline data, we provide the tools to unify fragmented identifiers and maintain a persistent view of consumers. As a result, marketers and platforms get rich insights, accurate cross-device targeting, improved addressability, and measurable advertising.
The shifting identity landscape
For years, the industry has relied on cookies to identify consumers across devices and platforms. However, with ongoing signal loss, including the uncertainty around cookies, and the evolution of privacy regulations, the digital identity landscape has grown more complicated. As consumers hop from one device to another, they are now represented by multiple signals, each tied to a different aspect of their digital behavior.
While this shift brings complexity, it also opens the door for innovation. Marketers and ad platforms now have the opportunity to rethink their identity strategies and adopt more flexible approaches that are not reliant on a single identifier.
This is where Experian comes in.
Connecting the dots: A holistic view of the customer journey
Our identity solutions are designed to help manage today’s multi-ID ecosystem by connecting digital and offline identifiers to a single customer profile. This creates a unified view of the consumer, and when combined with our understanding of customer behavior (e.g. demo, interests, shopping patterns) marketers and platforms get both insights about their customers and the addressability to reach them across channels.
Four examples of what you can do with a strong identity foundation
- If an advertiser wants to make its first-party data more addressable, it can utilize our Digital Graph with universal IDs, hashed emails (HEMs), and connected TV (CTV) IDs to extend its reach.
- A publisher who wants to gain further insights into their audiences and create private marketplaces (PMPs) can achieve this goal with the use of our Digital Graph with hashed emails, universal IDs, mobile ad IDs (MAIDs), CTV IDs, and IPs. The publisher can use this in concert with Marketing Attributes to understand age, gender, household income, buying behavior, and more. The publisher can connect marketing attributes to the Digital Graph via our Living Unit ID (LUID) to understand more about consumers that fall into their segments.
- A demand-side platform (DSP) who wants to extend first-party and third-party audience reach across all digital devices on their platform will use the Digital Graph with all digital IDs to allow users of their platform to select cross-device extension against first-party and third-party audiences.
- A retail media network (RMN) can use our Offline and Digital Graphs to connect in-store and online purchases to a household profile—even when purchases are made by different people. The RMN can then reach that household across digital media platforms and accurately attribute the in-store purchase back to digital ad exposure.
Identity as a strategic asset: Today and in the future
In our paradoxical world where consumers are represented by multiple identifiers, yet marketers and platforms face signal loss, identity is more than a technical issue—it’s a strategic asset. The ability to unify identity data into a single profile provides marketers with the customer intelligence needed to drive growth and stay competitive. Here’s how we do it:
- Deep, persistent customer understanding: With roots in offline, deterministic data like names, addresses, and emails, we provide an accurate and persistent view of identity to our customers. This allows you to maintain a consistent and comprehensive understanding of your customers and their marketing attributes over time.
- Highly accurate and refreshed digital identities: Our signal-agnostic graph is not reliant on any one signal as it includes HEMs, cookies, MAIDs, IPs, Universal IDs, and CTV IDs. Our Digital Graph is updated weekly, ensuring the data is always fresh and addressable. This persistent linkage of individuals and households to their identifiers and devices means your campaigns are always targeting the right people.
- Connected offline and digital graphs for holistic insights: We connect offline and digital identities by following privacy-first best practices, such as preventing re-identification, to allow insights from the offline world to be used in the online world. This integrated approach, enriched with marketing data, gives you better insights, more addressable advertising, and the ability to engage customers across multiple devices while accurately measuring campaign impact.
Transform challenges into opportunities
The rise of the multi-ID landscape presents both challenges and opportunities for the advertising industry. We stand as the trusted partner to navigate this complexity, utilizing insights from the offline world to inform decisions in the online world, enabling personalized marketing and accurate attribution, and helping you achieve your current and future goals.
Latest posts

New data from Experian Marketing Services’ Simmons® ConnectSM mobile and digital panel sheds light on the way smartphone users spend time using their phone, with the average adult clocking 58 minutes daily on their device. On average, smartphone owners devote 26% of the time they spend on their phone talking and another 20% texting. Social networking eats up 16% of smartphone time while browsing the mobile web accounts for 14% of time spent. Emailing and playing games account for roughly 9% and 8% of daily smartphone time, respectively, while use of the phone’s camera and GPS each take up another 2% of our smartphone day. *Activities include use of a smartphone’s native features dedicated to each activity as well as downloaded apps whose primary function falls under the given activity. For instance, “watch video” includes the act of watching video on the smartphone’s native video player as well as use of video apps such as YouTube, Netflix, etc. iPhone versus Android users Smartphone users may constantly debate which operating system is supreme, but we see clear differences between the ways consumers use their phone depending on the operating system that runs it. For starters, iPhone users spend an hour and fifteen minutes using their phones per day, a full 26 minutes more than the typical Android phone owner. Additionally, iPhone and Android smartphone owners use their phones in markedly different ways. For instance, 28% of the time that Android users spend using their phones is dedicated to talking, whereas iPhone users spend only 22% of their smartphone time talking on the device. Android owners also devote a greater share of time visiting websites on their phone than iPhone owners. On the other hand, iPhone owners spend a disproportionately greater share of smartphone time than Android owners texting, emailing, using the camera and social networking. Note on time spent It may surprise some to read that an activity like watching video accounts for such a small share (less than 1%) of the typical adult’s daily smartphone use. However, for the charts above to sum to a single daily total it was necessary to calculate individual activity contribution using a base of all smartphone owners, including those who don’t spend any time engaging in a given activity during a typical day. The chart below provides additional insights into the time spent engaging in the major smartphone activities examining only those individuals who engaged in each activity during a 24-hour period. I’ve also added into the chart a reach and frequency metric to indicate the popularity of each activity and the number of times per day that individuals engage in them. In the chart, the activities with the largest bubbles are those in which the greatest share of smartphone owners engage during a typical day and include the usual suspects: talking (79%), texting (76%), visiting websites (62%), emailing (61%) and social networking (52%). Activities with the fewest daily participants are: watching video, which 2.3% of smartphone owners do during a typical day, and reading, which just 0.5% of smartphone owners do daily. Given that nearly 98% of smartphone users don’t watch videos on their phone during a typical day, it’s easier to understand why video comprises such a low share of the average adult’s daily smartphone use. However, the chart above reveals that those who do watch video on their phone spend, on average, 5 minutes a day watching videos spread out over 4.2 different viewing sessions. For more information on consumers’ usage of smartphones, digital tablets, computers and other traditional and digital media platforms, check out Simmons Connect.
New health information exchanges are prompting data quality efforts, as state and local healthcare agencies look to electronically share patient data.
If the time spent on the Internet for personal computers was distilled into an hour then 27 percent of it would be spent on social networking and forums across the United States, United Kingdom and Australia. In the U.S., 16 minutes out of every hour online is spent on social networking and forums, nine minutes on entertainment sites and five minutes shopping. Global comparison In the UK, 13 minutes out of every hour online is spent on social networking and forums, nine minutes on entertainment sites and six minutes shopping. Australian Internet users spend 14 minutes on social sites, nine on entertainment and four minutes shopping online. Across all three markets, time spent shopping online grew year-over-year, but the UK market emerged as having the most prolific online shoppers, spending proportionally more time on retail Websites than online users in the U.S. or Australia. British Internet users spent 10 percent of all time online shopping in 2012, compared to nine percent in the U.S. and six percent in Australia. This was in part due to a bumper winter holiday season in the UK where 370 million hours were spent shopping online, 24 percent higher than the monthly average. Consumption of news content also increased across all three markets with Australian users emerging as the most voracious consumers of news online. Six percent of all time spent online in Australia in 2012 was on a news Website, compared to five percent in the UK and four percent in the U.S. Meanwhile, the time spent on social media proportionate to other online activities declined across all three regions. The U.S., which has been the most dominant market for social media consumption in the last three years dropped from 30 percent of all time spent online to 27 percent. In Australia time spent on social dropped from 27 percent to 24 percent while in the UK it dipped from 25 percent to 22 percent year-over-year. This highlights the rise in access via 3G and 4G networks as consumers spend increasingly more time online while on the move. "Understanding consumer behavior across channels is more important than ever as more visits are being made on the move, particularly among social networking and email,” says Bill Tancer, general manager of global research for Experian Marketing Services. "With smartphones and tablets becoming more powerful, our data clearly indicates the difference between mobile and traditional desktop usage further enabling the ‘always on’ consumer mentality. Marketers need to understand these differences, as well as regionally, to ensure campaigns can be tailored for better and more effective engagement.” Mobile browsing When looking at the U.S. browsing data for mobile devices, email accounted for the largest time spent on average, for the same categories for Q1 2013. Email made up 23 percent of time spent on mobile devices for Q1-13, while social networking accounted for 15 percent. Entertainment had the third highest time spent with 13 percent, followed by shopping with 11 percent and travel with 9 percent. The mobile data does not include app usage, but does include mobile browsing within an app. Read more of the latest consumer trends in The 2013 Digital Marketer Report Learn more about consumer online behavior by visiting our Online Trends page Learn more about the author, Matt Tatham