
Originally appeared on MediaPost
As the digital ecosystem becomes more complex, managing multiple identifiers for consumers has emerged as a significant challenge. From cookies and IP addresses to mobile IDs and universal IDs, marketers and platforms face increasing difficulty in maintaining a unified view of their consumers. Without a coherent identity strategy, campaigns can suffer from poor targeting, limited personalization, and flawed attribution.
Experian understands these challenges and offers solutions to help our partners navigate the complexities of a multi-ID landscape. By utilizing both digital and offline data, we provide the tools to unify fragmented identifiers and maintain a persistent view of consumers. As a result, marketers and platforms get rich insights, accurate cross-device targeting, improved addressability, and measurable advertising.
The shifting identity landscape
For years, the industry has relied on cookies to identify consumers across devices and platforms. However, with ongoing signal loss, including the uncertainty around cookies, and the evolution of privacy regulations, the digital identity landscape has grown more complicated. As consumers hop from one device to another, they are now represented by multiple signals, each tied to a different aspect of their digital behavior.
While this shift brings complexity, it also opens the door for innovation. Marketers and ad platforms now have the opportunity to rethink their identity strategies and adopt more flexible approaches that are not reliant on a single identifier.
This is where Experian comes in.
Connecting the dots: A holistic view of the customer journey
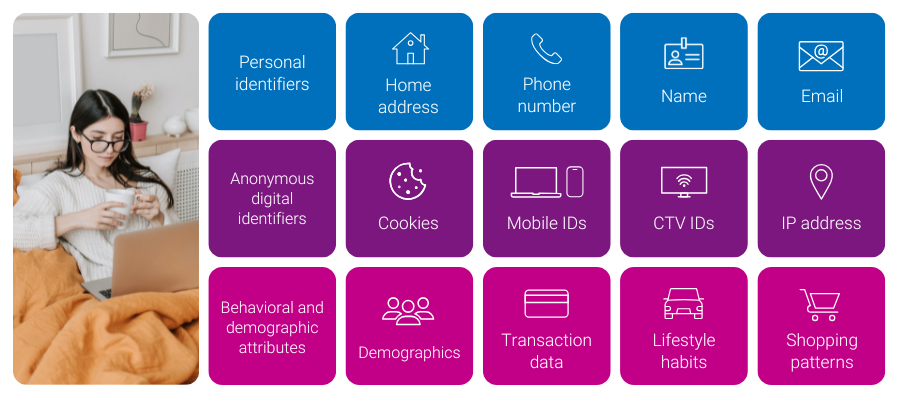
Our identity solutions are designed to help manage today’s multi-ID ecosystem by connecting digital and offline identifiers to a single customer profile. This creates a unified view of the consumer, and when combined with our understanding of customer behavior (e.g. demo, interests, shopping patterns) marketers and platforms get both insights about their customers and the addressability to reach them across channels.

Four examples of what you can do with a strong identity foundation
- If an advertiser wants to make its first-party data more addressable, it can utilize our Digital Graph with universal IDs, hashed emails (HEMs), and connected TV (CTV) IDs to extend its reach.
- A publisher who wants to gain further insights into their audiences and create private marketplaces (PMPs) can achieve this goal with the use of our Digital Graph with hashed emails, universal IDs, mobile ad IDs (MAIDs), CTV IDs, and IPs. The publisher can use this in concert with Marketing Attributes to understand age, gender, household income, buying behavior, and more. The publisher can connect marketing attributes to the Digital Graph via our Living Unit ID (LUID) to understand more about consumers that fall into their segments.
- A demand-side platform (DSP) who wants to extend first-party and third-party audience reach across all digital devices on their platform will use the Digital Graph with all digital IDs to allow users of their platform to select cross-device extension against first-party and third-party audiences.
- A retail media network (RMN) can use our Offline and Digital Graphs to connect in-store and online purchases to a household profile—even when purchases are made by different people. The RMN can then reach that household across digital media platforms and accurately attribute the in-store purchase back to digital ad exposure.
Identity as a strategic asset: Today and in the future
In our paradoxical world where consumers are represented by multiple identifiers, yet marketers and platforms face signal loss, identity is more than a technical issue—it’s a strategic asset. The ability to unify identity data into a single profile provides marketers with the customer intelligence needed to drive growth and stay competitive. Here’s how we do it:
- Deep, persistent customer understanding: With roots in offline, deterministic data like names, addresses, and emails, we provide an accurate and persistent view of identity to our customers. This allows you to maintain a consistent and comprehensive understanding of your customers and their marketing attributes over time.
- Highly accurate and refreshed digital identities: Our signal-agnostic graph is not reliant on any one signal as it includes HEMs, cookies, MAIDs, IPs, Universal IDs, and CTV IDs. Our Digital Graph is updated weekly, ensuring the data is always fresh and addressable. This persistent linkage of individuals and households to their identifiers and devices means your campaigns are always targeting the right people.
- Connected offline and digital graphs for holistic insights: We connect offline and digital identities by following privacy-first best practices, such as preventing re-identification, to allow insights from the offline world to be used in the online world. This integrated approach, enriched with marketing data, gives you better insights, more addressable advertising, and the ability to engage customers across multiple devices while accurately measuring campaign impact.
Transform challenges into opportunities
The rise of the multi-ID landscape presents both challenges and opportunities for the advertising industry. We stand as the trusted partner to navigate this complexity, utilizing insights from the offline world to inform decisions in the online world, enabling personalized marketing and accurate attribution, and helping you achieve your current and future goals.
Latest posts

In our upcoming 2011 Digital Marketer Report, we will cover what influences purchase decisions. While you'll have to wait to read the report to see the entire list, when ranking influencers to purchase decisions: 54% of U.S. adults identified old-fashioned Word of Mouth (WOM), while information from webpages (47%) ranked second and online consumer reviews (31%) ranked as the third most important. It's nearly impossible to measure old-fashioned WOM, and “Information from a website” is a very broad category. Gauging the uptake in online consumer reviews is another story, however. Visits to online review pure-play Yelp.com is a good proxy for the uptake in online reviews in the service sector (restaurants, dry cleaners and dentists to name a few). Over the past two years, visits to Yelp.com have increased over 136%. Given such impressive and steady growth since 2009, you might assume that Yelp and other sites like it have become ubiquitous. Your assumption, however, would be incorrect. While age demographics of visitors to the site show that use of the online consumer reviews has reached maturity (Internet users over the age of 55 make up the largest age bin at 25%), geo-demographics, or visits by DMA, tell a completely different story. The top five cities by representation; San Francisco, San Diego, Monterey, Los Angeles and Sacramento reveal the first skew, that Yelp.com visitors favor the West Coast, where the company was founded. So it seems that, by percentage, the largest U.S. cities also figure significant. When looking at visitors to the site by Mosaic™ segments, Americas Wealthiest, Young Cosmopolitans and other affluent types figure heavily in the site's traffic. Taken all together, the numbers reveal that while Yelp.com continues to grow, its participants continue to be a very distinct subset of U.S. Internet users. This niche set of users might explain why traditional WOM continues to show more significance in influencing purchase decisions. Want to learn more about other purchase decision influencers? Click here to request a copy of Experian Marketing Services highly-anticipated 2011 Digital Marketer Report, launching in late March. The report features an editorial by Bill Tancer as well as unreleased data spanning email, social, mobile, search and more.

College basketball mania is here. First round NCAA tournament action tips off this week leading up to the Final Four in Houston and Indianapolis for the men and women respectively. With March Madness just around the corner, Experian Marketing Services' data team started to wonder — how do TV viewers of the men's tournament differ from viewers of the women's tournament? The women's game has come a long way since the first women's collegiate basketball championship in 1972. This will be the ninth year that all 63 games of the tournament are televised nationally. Looking back to 1982 when the finals were contested in Norfolk, Virginia, only 37 media credentials were issued. This has increased 14 fold when compared to the 530 media credentials issued in San Antonio last year. The men's game is as popular as ever drawing impressive TV ratings, especially during tournament time. Remember Butler's drive to the Final Four last year and their near upset of Duke? CBS reported that 48 million viewers watched at least some of the championship game. According to viewership data from Experian Simmons, men's tournament viewers outnumbered women's tournament viewers by a ratio of 3.7 to 1. That's nearly four men's tournament viewers for every viewer of the women's tournament. So who might be watching this year? Using Experian's Mosaic consumer lifestyle segmentation system combined with last year's tournament viewership data from Experian Simmons, we took a closer look. Men's Tournament Viewers Rise Above The Rim On Affluence The men's tournament draws a significant share of viewers from affluent households. Nearly half of viewers have household income of $75,000 or over. The ten most affluent Mosaic segments have an over-representation of men's tournament viewers compared to their corresponding share of U.S. adults. This includes Dream Weavers (well-off families with school age children, living an affluent suburban version of the American Dream), Enterprising Couples (married couples with children and childless duos living in upper-middle-class commuter communities), and New Suburbia Families (young, affluent working couples with pre-school children concentrated in fast-growing, metro fringe communities). Nearly half of the men's tournament TV viewers have household income of $75,000 or over. True to its name, the Dream Weavers segment is a college basketball advertiser's dream for home electronics, home furnishings, home improvement and home office supplies. All of these home-centered categories are near and dear to Dream Weaver householders many of whom will be following the men's tournament very closely in a variety of media formats including online, in HDTV, and on their smart phones. Brands and retail stores that have particular appeal to Dream Weavers include Nordstrom, Ralph Lauren, Nike, Eddie Bauer, Sephora, Dick's Sporting Goods and Banana Republic. But that's not to say that only affluent consumers are watching the men's tournament. Other segments with an above average concentration of men's tournament viewers include African-American Neighborhoods, Minority Metro Communities, America's Farmlands, and Young Cosmopolitans. Men's tournament viewers participate in a wide range of leisure and sport's activities (most notably golfing, football, softball, racquet sports, and weight training), have a preference for driving Cadillac, Acura, and Lexus automobiles, and have a high concentration of readers of such magazine titles as Golf Digest, Sports Illustrated, ESPN The Magazine, Barron's, and Black Enterprise. Women's Tournament Delivers Younger, More Ethnically Diverse Audience The audience for the women's tournament is decidedly different from the men's. About six out of every ten viewers have household income below $75,000. Mosaic segments with the greatest over-representation of women's tournament viewers include Struggling City Centers (young, single and single-parent minority renters living in low-income city neighborhoods throughout the South) and Minority Metro Communities (married couples and single-parent minorities with above-average incomes working in a mix of service industry and white-collar jobs). These two segments alone account for nearly 20% of the women's tournament viewing audience and contain about 2.5 times the concentration of viewers relative to their corresponding share of U.S. adults. Women's college basketball advertisers should note that the tournament delivers a less affluent audience compared to the men. Using Minority Metro Communities as an example, brands and retail stores that have particular appeal to this group and to the broader women's tournament audience overall include 7-Eleven, Ace Hardware, Hallmark, Sam's Club, Kmart, Dollar General, Big Lots, and Marshall's. Women's college basketball advertisers should note that the tournament delivers a less affluent audience compared to the men. Only four of the ten most affluent Mosaic segments have an over-representation of women's tournament viewers. When comparing a segment's share of the overall women's tournament viewing audience to its corresponding share of the men's tournament viewing audience, three of these four segments account for a higher share of women's viewers. These are America's Wealthiest, White Collar Suburbia, and Affluent Urban Professionals. Advertisers will be pleased to know that interest in the tournament from these segments helps lift the viewing audience into a higher income demographic. Using White Collar Suburbia as an example, retail stores that have particular appeal to this segment of the population include Brooks Brothers, Costco, Gap, J. Crew, Kohl's, Lord & Taylor, and Victoria's Secret. Other segments that contain a significantly higher share of women's viewers compared to men include Small-city Endeavors (a mix of lower income singles, families, and single parents living in older homes and small apartments in working class towns) and Professional Urbanites (upper-middle-class empty nesting couples and older singles in metropolitan areas). Men’s Tournament Viewers Compared to Women’s Tournament Viewers Men’s Tournament Top Ten Most Affluent Mosaic Segments Women’s Tournament America’s Wealthiest Dream Weavers White Collar Suburbia Upscale Suburbanites Enterprising Couples Small-town Success New Suburbia Families Status-conscious Consumers Affluent Urban Professionals Urban Commuter Families = Index of 100 to 125 = Index of 126 to 150 = Index above 150 The index shows the concentration of viewers for the men's and women's tournament for a segment compared to the segment's share of U.S. adults. For example, an index above 150 means that adults from the segment are 50% more likely to watch the tournament compared to U.S. adults overall.

Along with death and taxes, the third certainty as an online marketer is change. When we combine the rapid rate of online innovation with consumers' relentless pursuit of finding the best possible price, a pursuit that kicks into overdrive with economic uncertainty, it's critical to anticipate changes in consumer behavior and the adoption of new buying modalities. Here are three things that you should know about the group coupon phenomenon. By now, most of us are aware of Groupon, the privately held Chicago group couponing-company that rejected Google's $6 billion dollar acquisition offer in late 2010. Since it's founding in 2009, Groupon has grown to over 5 million visits per week to take the #25 spot in the Experian Hitwise Shopping & Classifieds category1 for the week ending January 29, 2011. But is Groupon, or more generally the category of online group buying, a fad or a significant change in the way we buy online? Here are three things that you should know about the group coupon phenomenon. Group Buying Has Reached Mainstream Adoption If you think that this new social buying trend is fueled by early adopters of technology, the young and hip technocrats, you may have been correct in January 2010. Today, you would be completely off the mark. According to Experian Hitwise for the four weeks ending January 29, 2011, the largest age-bin for visitors to Groupon.com are those Internet users over the age of 55 (37.5%). There is Applicability to Local and National Retailers While group coupons were heralded as the perfect solution for local online commerce, successful deals with national retailers (both bricks-and-mortar such as GAP and online pure-plays like Amazon.com) indicate that this movement will take its place alongside email and search as a key channel for marketers to consider. On January 19, 2011, LivingSocial.com, a Groupon competitor, offered a $20 Amazon credit for $10 (it should be noted that Amazon invested $175 million in LivingSocial.com). According to PC Magazine, over 1.3 million certificates were sold at a rate of over 100,000 per hour. The Race to Dominate the Space is Heating Up LivingSocial's Amazon play did more than just put up impressive numbers; it was a clear sign that the site is a viable threat to category leader, Groupon. According to Groupon CEO Andrew Mason, Groupon has over 500 competitors in the marketplace and growing. Have you considered group buying for your business? Along with anticipating this trend, with the growing number of competitors and offers you should think one step ahead – will consumers succumb to daily deal fatigue? Want to learn more about digital marketing in 2011? Click here to request a copy of Experian Marketing Services highly-anticipated 2011 Digital Marketer Report, launching in late March. The report features an editorial by Bill Tancer as well as unreleased data spanning email, social, mobile, search and more. ——— 1 Shopping and Classifieds Category: 28,586 top sites that specialize in online shopping, auctions and classifieds