Originally appeared on MediaPost
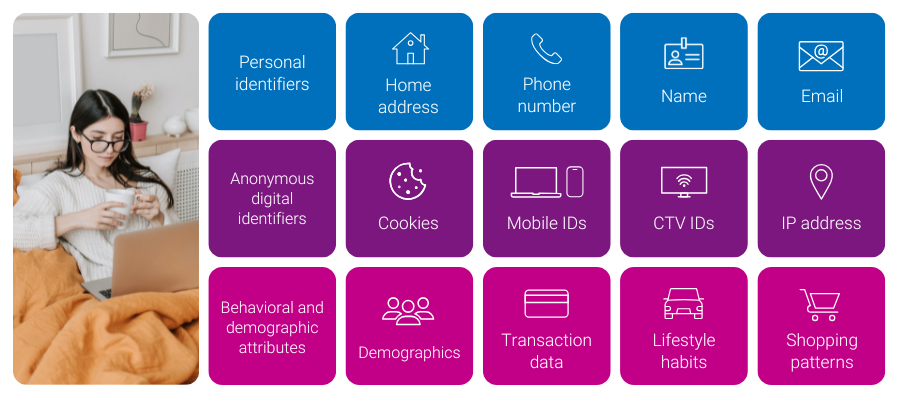
As the digital ecosystem becomes more complex, managing multiple identifiers for consumers has emerged as a significant challenge. From cookies and IP addresses to mobile IDs and universal IDs, marketers and platforms face increasing difficulty in maintaining a unified view of their consumers. Without a coherent identity strategy, campaigns can suffer from poor targeting, limited personalization, and flawed attribution.
Experian understands these challenges and offers solutions to help our partners navigate the complexities of a multi-ID landscape. By utilizing both digital and offline data, we provide the tools to unify fragmented identifiers and maintain a persistent view of consumers. As a result, marketers and platforms get rich insights, accurate cross-device targeting, improved addressability, and measurable advertising.
The shifting identity landscape
For years, the industry has relied on cookies to identify consumers across devices and platforms. However, with ongoing signal loss, including the uncertainty around cookies, and the evolution of privacy regulations, the digital identity landscape has grown more complicated. As consumers hop from one device to another, they are now represented by multiple signals, each tied to a different aspect of their digital behavior.
While this shift brings complexity, it also opens the door for innovation. Marketers and ad platforms now have the opportunity to rethink their identity strategies and adopt more flexible approaches that are not reliant on a single identifier.
This is where Experian comes in.
Connecting the dots: A holistic view of the customer journey
Our identity solutions are designed to help manage today’s multi-ID ecosystem by connecting digital and offline identifiers to a single customer profile. This creates a unified view of the consumer, and when combined with our understanding of customer behavior (e.g. demo, interests, shopping patterns) marketers and platforms get both insights about their customers and the addressability to reach them across channels.
Four examples of what you can do with a strong identity foundation
- If an advertiser wants to make its first-party data more addressable, it can utilize our Digital Graph with universal IDs, hashed emails (HEMs), and connected TV (CTV) IDs to extend its reach.
- A publisher who wants to gain further insights into their audiences and create private marketplaces (PMPs) can achieve this goal with the use of our Digital Graph with hashed emails, universal IDs, mobile ad IDs (MAIDs), CTV IDs, and IPs. The publisher can use this in concert with Marketing Attributes to understand age, gender, household income, buying behavior, and more. The publisher can connect marketing attributes to the Digital Graph via our Living Unit ID (LUID) to understand more about consumers that fall into their segments.
- A demand-side platform (DSP) who wants to extend first-party and third-party audience reach across all digital devices on their platform will use the Digital Graph with all digital IDs to allow users of their platform to select cross-device extension against first-party and third-party audiences.
- A retail media network (RMN) can use our Offline and Digital Graphs to connect in-store and online purchases to a household profile—even when purchases are made by different people. The RMN can then reach that household across digital media platforms and accurately attribute the in-store purchase back to digital ad exposure.
Identity as a strategic asset: Today and in the future
In our paradoxical world where consumers are represented by multiple identifiers, yet marketers and platforms face signal loss, identity is more than a technical issue—it’s a strategic asset. The ability to unify identity data into a single profile provides marketers with the customer intelligence needed to drive growth and stay competitive. Here’s how we do it:
- Deep, persistent customer understanding: With roots in offline, deterministic data like names, addresses, and emails, we provide an accurate and persistent view of identity to our customers. This allows you to maintain a consistent and comprehensive understanding of your customers and their marketing attributes over time.
- Highly accurate and refreshed digital identities: Our signal-agnostic graph is not reliant on any one signal as it includes HEMs, cookies, MAIDs, IPs, Universal IDs, and CTV IDs. Our Digital Graph is updated weekly, ensuring the data is always fresh and addressable. This persistent linkage of individuals and households to their identifiers and devices means your campaigns are always targeting the right people.
- Connected offline and digital graphs for holistic insights: We connect offline and digital identities by following privacy-first best practices, such as preventing re-identification, to allow insights from the offline world to be used in the online world. This integrated approach, enriched with marketing data, gives you better insights, more addressable advertising, and the ability to engage customers across multiple devices while accurately measuring campaign impact.
Transform challenges into opportunities
The rise of the multi-ID landscape presents both challenges and opportunities for the advertising industry. We stand as the trusted partner to navigate this complexity, utilizing insights from the offline world to inform decisions in the online world, enabling personalized marketing and accurate attribution, and helping you achieve your current and future goals.
Latest posts

Same-sex marriage is a hot button topic no matter on which side of the issue you stand. But there can be no denying that same-sex couples are finding an expanding number of options in the U.S. and abroad should they decide to legally wed. The 2010 LGBT Consumer Report explores the household arrangements and behaviors of America's LGBT consumers—in particular, those associated with marriage—compared to America's heterosexual population. You will learn that despite being less than half as likely to be married, lesbian, gay and bisexual adults are 22% more likely than their "straight" counterparts to have recently wed or to be planning nuptials for the next year. Looking for that perfect gift for the newly wed couple? You will also get some shopping tips for identifying favored retailers of lesbian, gay and bisexual shoppers. We'll start by sizing the LGBT market. An estimated 3.7% of the non-Hispanic adult population (7.1 million adults) self-identifies as LGBT, which can be broken down as follows: The average heterosexual adult lives in a household with 1.9 other individuals, including adults and kids. By comparison, the average lesbian shares her home with only 1.6 other people. Gay men live in the smallest households, sharing their home with only one other person, on average. Over a third of gay or bisexual men (38%) share their home with at least one other adult male, compared with only 24% of heterosexual men who live under the same roof as another adult male. Thirty-five percent of gay or bisexual men say they live with one (and only one) other adult male, a living arrangement that has a higher chance of consisting of a same-sex, co-habiting couple. Over half of lesbians or bisexual women (53%) share their home with at least one other adult female, compared with only 23% of heterosexual women who live under the same roof as another adult female. Forty-three percent of lesbian or bisexual women say they live with one (and only one) other adult female, a living arrangement that has a higher chance of consisting of a same-sex, co-habiting couple. Lesbian, Gay and Bisexual adults (LGB) as a group are less than half as likely as heterosexuals to be married. Only 26% of LGB adults are wed, compared with 57% of “straight” adults. Of all LGB adults, bisexuals are the most likely group to be married, with over 4 in 10 reporting they are presently wed. Lesbians are more than four and a half times more likely than gay men to be married, with 23% of lesbians having tied the knot versus only 5% of gay men. Lesbian, gay and bisexual adults as a group are 22% more likely than heterosexual adults to have either tied the knot in the last 12 months or have plans to wed in the coming year. 5.7% of lesbian, gay or bisexual adults are newly weds or “soonly” weds vs. 4.6% of heterosexual adults. Lesbian, gay and bisexual adults are twice as likely to shop at Neiman Marcus, making the department store the number one retailer with a wedding registry program among LGB shoppers. With many retailers ending their registry programs in favor of gift cards, we looked at how stores without registry programs stack up among lesbian, gay and bisexual shoppers. LGB adults are almost twice as likely to shop at J. Crew, making the store the number one retailer without a wedding registry program among LGB shoppers.
With the 82nd Academy Awards® just around the corner and only days before final voting ballots are due back to accounting firm PricewaterhouseCoopers, Experian Simmons is taking a close look at the American movie-going population. In any given month, over 56 million adults (26% of the adult population) make a trip to the cinema to take in a film. Movie-going typically reaches its peak in mid-summer, and 2009 was no exception. Experian Simmons DataStreamSM reports that in July of last year, 32% of adults went to movies, the highest level observed at any point in the year. In October of the same year, the percentage of past-month adult cinema-goers had dropped to just 19%, the lowest point observed in all of 2009. In this month’s Consumer Insights report, Experian Simmons sizes the movie-going audience, examines their receptivity to cinema ads—including pre-show commercials and product placement within films—online movie searches as well as Americans’ penchant for tuning into the Academy Awards. All data comes from the Simmons Summer 2009 National Consumer Study. Two-thirds of the adult population have gone to the movies at least once in the last 6 months. Nearly half (46%) have been in the last 90 days and a quarter (26%) have been in the last month. Young adults are, as expected, more likely to go to the movies than older adults, but adults over 50 outnumber young adults when it comes to raw number of movie-goers as you will see in the following chart. Over 147 million individuals have gone to the movies at least once in the last 6 months. With 20.8 million adults ages 18 to 24 going to the movies in the last 6 months, this age group accounts for only 14% of the movie-going population. Adults ages 50 and over, on the other hand, account for 37% of the movie-going population with over 55 million adults in this age group going to the theater at least once in the last 6 months. Among all adults who had been to the movies at least once in the last 6 months, 68% have been at least once in the last 30 days. Many movie-goers (39%) have been only once in the last month and only 7% have been four or more times. Young adults ages 18 to 24 are much more likely than the average movie-goer to have been to the theater in the last month with 75% reporting having been at least once and 10% having been 4 times or more. Experian Simmons DataStreamSM reports similar trends in past 30 day movie-going for 2008 and 2009 with the peak for this behavior occurring in both years on almost the exact same date. During the week of July 22, 2009 32% of adults reported having been to the theater during the last 30 days and during the week of July 21, 2008, 29% reported going. Cinema Blockbusters that month in ’09 included Bruno and Harry Potter and the Half-Blood Prince. In July of ’08, Mama Mia and The Dark Knight were released. When it comes to product placement in movies, frequent cinema-goers are most likely to respond. In fact, 41% of adults who went to the movies 4 or more times in the last 90 days are classified by the Simmons Movie Product Placement segmentation system as “Emulators,” those consumers who notice, remember and are driven to buy products placed into the context of a film. By comparison, only 28% of consumers who went to a movie only once in the last 90 days are Emulators. Forty-eight percent of Horror film fans say they often pay attention to commercials that show along with movie previews in movie theaters making them the most receptive to cinema advertisements followed by Romantic Comedy fans and Family movie fans. Only 39% of Foreign Language or Independent film fans say they pay attention to such ads. Nearly a quarter of all movie-goers get movie information, reviews or show times online in any given month. Aside from the obvious movie sites, you are likely to find movie information seekers on these sites: Californians like foreign language and independent films, whereas New Englanders have more of a penchant for Comedies and Southerners are among the most likely to see Horror films. Below are the top 5 metro areas for finding adults who say they usually see the three selected movie genres when they go to the theater. One-in-seven American adults tuned into the last Academy Awards® ceremony on ABC, including many non-movie-goers. Nine percent of adults who had not been to the movies even once in the past six months tuned into the last awards show and ultimately comprised 19% of all 2009 Oscar® viewers. Still, the more frequently a consumer goes to the movies, the more likely he or she is to watch the annual Academy Awards® ceremony.