
2024 marked a significant year. AI became integral to our workflows, commerce and retail media networks soared, and Google did not deprecate cookies. Amidst these changes, ID bridging emerged as a hot topic, raising questions around identity reliability and transparency, which necessitated industry-wide standards. We believe the latest IAB OpenRTB specifications, produced in conjunction with supply and demand-side partners, set up the advertising industry for more transparent and effective practices.
So, what exactly is ID bridging?
As signals, like third-party cookies, fade, ID bridging emerged as a way for the supply-side to offer addressability to the demand-side. ID bridging is the supply-side practice of connecting the dots between available signals, that were generated in a way that is not the expected default behavior, to understand a user’s identity and communicate it to prospective buyers. It enables the supply-side to extend user identification beyond the scope of one browser or device.
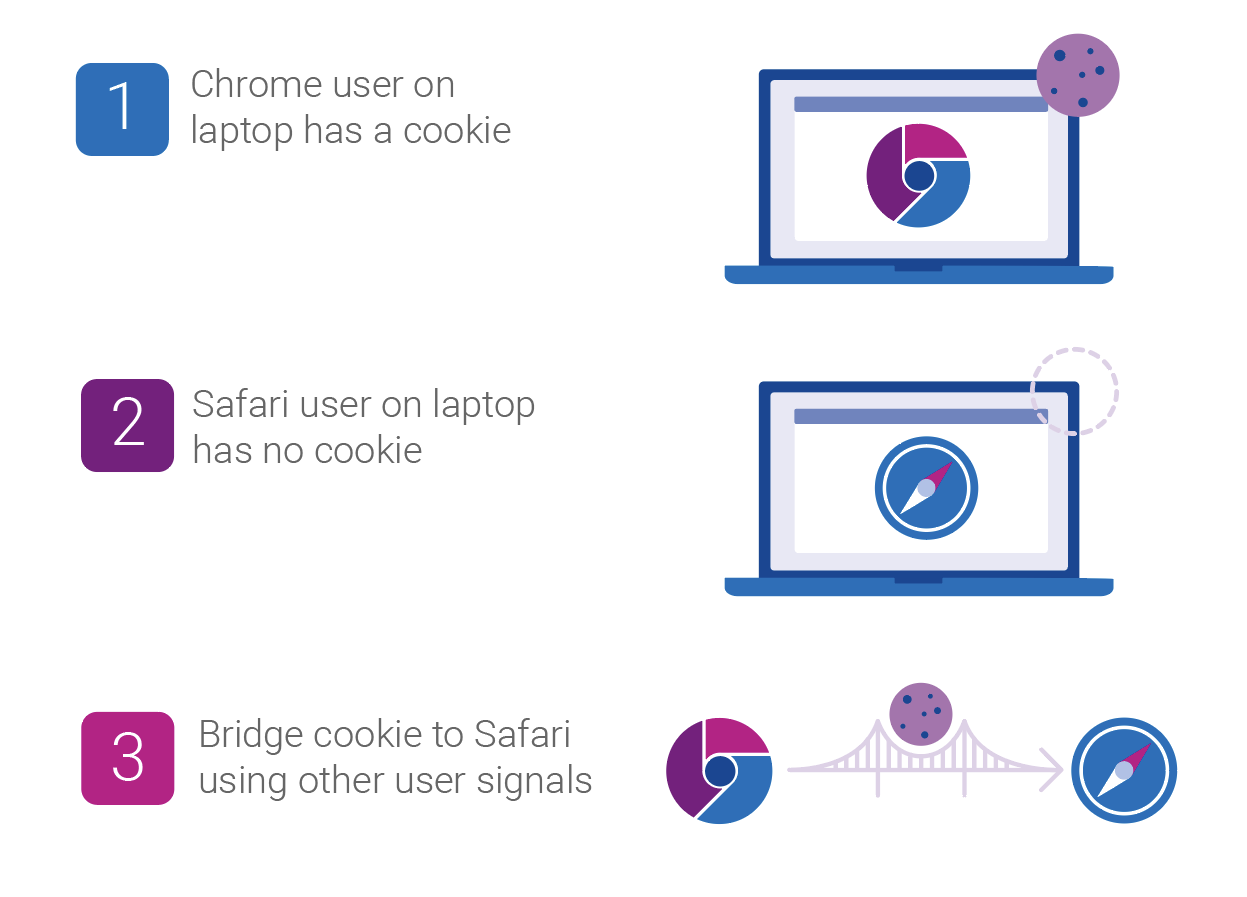
Imagine you visit a popular sports website on your laptop using Chrome. Later, you use the same device to visit the same sports website, but this time, on Safari. By using identity resolution tools, a supply-side partner can infer that both visits are likely from the same user and communicate with them as such.
ID bridging is not inherently a bad thing. However, the practice has sparked debate, as buyers want full transparency into the use of a deterministic identifier versus an inferred one. This complicates measurement and frequency capping for the demand-side. Before OpenRTB 2.6, ID bridging led to misattribution as the demand-side could not attribute ad exposures, which had been served to a bridged ID, to a conversion, which had an ID different from the ad exposure.
OpenRTB 2.6 sets us up for a more transparent future
In 2010, the IAB, along with supply and demand-side partners, formed a consortium known as the Real-Time Bidding Project for companies interested in an open protocol for the automated trading of digital media. The OpenRTB specifications they produced became that protocol, adapting with the evolution of the industry.
The latest evolution, OpenRTB 2.6, sets out standards that strive to ensure transparency in real-time bidding, mandating how the supply-side should use certain fields to more transparently provide data when inferring users’ identities.
What’s new in OpenRTB 2.6?
Here are the technical specifications for the industry to be more transparent when inferring users’ identities:
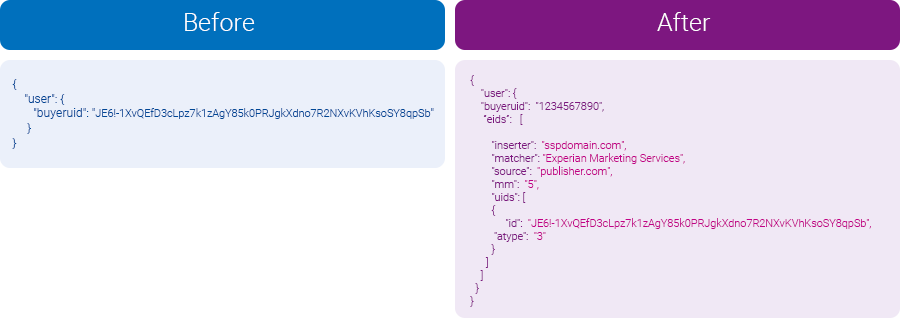
- Primary ID field: This existing field now can only contain the “buyeruid,” an identifier mutually recognized and agreed upon by both buyer and seller for a given environment. For web environments, the default is a cookie ID, while for app activity, it is a mobile advertising ID (MAID), passed directly from an application downloaded on a device. This approach ensures demand-side partners understand the ID’s source.
- Enhanced identifier (EID) field: The EID field, designated for alternative IDs, now accommodates all other IDs. The EID field now has additional parameters that provide buyers transparency into how the ID was created and sourced, which you can see in the visual below:
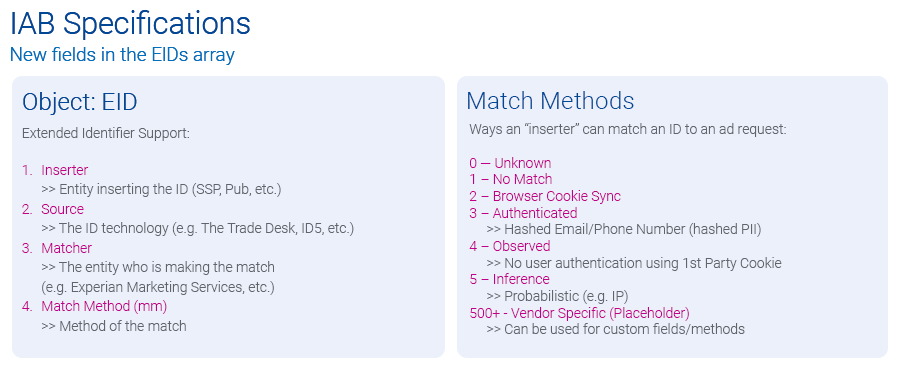
Using the above framework, a publisher who wants to send a cross-environment identifier that likely belongs to the same user would declare the ID as “mm=5,” while listing the potential third-party identity resolution partner under the “matcher” field, which the visual below depicts. This additional metadata gives the demand-side the insights they need to evaluate the reliability of each ID.
“These updates to OpenRTB add essential clarity about where user and device IDs come from, helping buyers see exactly how an ID was created and who put it into the bidstream. It’s a big step toward greater transparency and trust in the ecosystem. We’re excited to see companies already adopting these updates and can’t wait to see the industry fully embrace them by 2025.”
Hillary Slattery, Sr. Director, Programmatic, Product Management, IAB Tech Lab
Experian will continue supporting transparency
As authenticated signals decrease due to cookie deprecation and other consumer privacy measures, we will continue to see a rise in inferred identifiers. Experian’s industry-leading Digital Graph has long supported both authenticated and inferred identifiers, providing the ecosystem with connections that are accurate, scalable, and addressable. Experian will continue to support the industry with its identity resolution products and is supportive of the IAB’s efforts to bring transparency to the industry around the usage of identity signals.
Supply and demand-side benefits of adopting the new parameters in OpenRTB 2.6
- Partner collaboration: Clarity between what can be in the Primary ID field versus the EID field provides clear standards and transparency between buyers and sellers.
- Identity resolution: The supply side has an industry-approved way to bring in inferred IDs while the demand side can evaluate these IDs, expanding addressability.
- Reducing risk: With accurate metadata available in the EID field, demand-side partners can evaluate who is doing the match and make informed decisions on whether they want to act on that ID.
Next steps for the supply and demand-sides to consider
For supply-side and demand-side partners looking to utilize OpenRTB 2.6 to its full potential, here are some recommended steps:
For the supply-side:
- Follow IAB Specs and provide feedback: Ensure you understand and are following transparent practices. Ask questions on how to correctly implement the specifications.
- Vet identity partners: Choose partners who deliver the most trusted and accurate identifiers in the market.
- Be proactive: Have conversations with your partners to discuss how you plan to follow the latest specs, which identity partners you work with, and explain how you plan to provide additional signals to help buyers make better decisions.
We are beginning to see SSPs adopt this new protocol, including Sonobi and Yieldmo.
“The OpenRTB 2.6 specifications are a critical step forward in ensuring transparency and trust in programmatic advertising. By aligning with these standards, we empower our partners with the tools needed to navigate a cookieless future and drive measurable results.”
Michael Connolly, CEO, Sonobi
These additions to the OpenRTB protocol further imbue bidding transactions with transparency which will foster greater trust between partners. Moreover, the data now available is not only actionable, but auditable should a problem arise. Buyers can choose, or not, to trust an identifier based on the inserter, the provider and the method used to derive the ID. While debates within the IAB Tech Lab were spirited at times, they ultimately drove a collaborative process that shaped a solution designed to work effectively across the ecosystem.”
Mark McEachran, SVP of Product Management, Yieldmo
For the demand side:
- Evaluation: Use the EID metadata to assess all the IDs in the EID field, looking closely at the identity vendors’ reliability. Select partners who meet high standards of data clarity and accuracy.
- Collaboration: Establish open communication with supply-side partners and tech partners to ensure they follow the best practices in line with OpenRTB 2.6 guidelines and that there’s a shared understanding of the mutually agreed upon identifiers.
- Provide feedback: As OpenRTB 2.6 adoption grows, consistent feedback from demand-side partners will help the IAB refine these standards.
Moving forward with reliable data and data transparency
As the AdTech industry moves toward a cookieless reality, OpenRTB 2.6 signifies a substantial step toward a sustainable, transparent programmatic ecosystem. With proactive adoption by supply- and demand-side partners, the future of programmatic advertising will be driven by trust and transparency.
Experian, our partners, and our clients know the benefits of our Digital Graph and its support of both authenticated and inferred signals. We believe that if the supply-side abides by the OpenRTB 2.6 specifications and the demand-side uses and analyzes this data, the programmatic exchange will operate more fairly and deliver more reach.
Latest posts

New data from Experian Marketing Services’ Simmons® ConnectSM mobile and digital panel sheds light on the way smartphone users spend time using their phone, with the average adult clocking 58 minutes daily on their device. On average, smartphone owners devote 26% of the time they spend on their phone talking and another 20% texting. Social networking eats up 16% of smartphone time while browsing the mobile web accounts for 14% of time spent. Emailing and playing games account for roughly 9% and 8% of daily smartphone time, respectively, while use of the phone’s camera and GPS each take up another 2% of our smartphone day. *Activities include use of a smartphone’s native features dedicated to each activity as well as downloaded apps whose primary function falls under the given activity. For instance, “watch video” includes the act of watching video on the smartphone’s native video player as well as use of video apps such as YouTube, Netflix, etc. iPhone versus Android users Smartphone users may constantly debate which operating system is supreme, but we see clear differences between the ways consumers use their phone depending on the operating system that runs it. For starters, iPhone users spend an hour and fifteen minutes using their phones per day, a full 26 minutes more than the typical Android phone owner. Additionally, iPhone and Android smartphone owners use their phones in markedly different ways. For instance, 28% of the time that Android users spend using their phones is dedicated to talking, whereas iPhone users spend only 22% of their smartphone time talking on the device. Android owners also devote a greater share of time visiting websites on their phone than iPhone owners. On the other hand, iPhone owners spend a disproportionately greater share of smartphone time than Android owners texting, emailing, using the camera and social networking. Note on time spent It may surprise some to read that an activity like watching video accounts for such a small share (less than 1%) of the typical adult’s daily smartphone use. However, for the charts above to sum to a single daily total it was necessary to calculate individual activity contribution using a base of all smartphone owners, including those who don’t spend any time engaging in a given activity during a typical day. The chart below provides additional insights into the time spent engaging in the major smartphone activities examining only those individuals who engaged in each activity during a 24-hour period. I’ve also added into the chart a reach and frequency metric to indicate the popularity of each activity and the number of times per day that individuals engage in them. In the chart, the activities with the largest bubbles are those in which the greatest share of smartphone owners engage during a typical day and include the usual suspects: talking (79%), texting (76%), visiting websites (62%), emailing (61%) and social networking (52%). Activities with the fewest daily participants are: watching video, which 2.3% of smartphone owners do during a typical day, and reading, which just 0.5% of smartphone owners do daily. Given that nearly 98% of smartphone users don’t watch videos on their phone during a typical day, it’s easier to understand why video comprises such a low share of the average adult’s daily smartphone use. However, the chart above reveals that those who do watch video on their phone spend, on average, 5 minutes a day watching videos spread out over 4.2 different viewing sessions. For more information on consumers’ usage of smartphones, digital tablets, computers and other traditional and digital media platforms, check out Simmons Connect.
New health information exchanges are prompting data quality efforts, as state and local healthcare agencies look to electronically share patient data.
If the time spent on the Internet for personal computers was distilled into an hour then 27 percent of it would be spent on social networking and forums across the United States, United Kingdom and Australia. In the U.S., 16 minutes out of every hour online is spent on social networking and forums, nine minutes on entertainment sites and five minutes shopping. Global comparison In the UK, 13 minutes out of every hour online is spent on social networking and forums, nine minutes on entertainment sites and six minutes shopping. Australian Internet users spend 14 minutes on social sites, nine on entertainment and four minutes shopping online. Across all three markets, time spent shopping online grew year-over-year, but the UK market emerged as having the most prolific online shoppers, spending proportionally more time on retail Websites than online users in the U.S. or Australia. British Internet users spent 10 percent of all time online shopping in 2012, compared to nine percent in the U.S. and six percent in Australia. This was in part due to a bumper winter holiday season in the UK where 370 million hours were spent shopping online, 24 percent higher than the monthly average. Consumption of news content also increased across all three markets with Australian users emerging as the most voracious consumers of news online. Six percent of all time spent online in Australia in 2012 was on a news Website, compared to five percent in the UK and four percent in the U.S. Meanwhile, the time spent on social media proportionate to other online activities declined across all three regions. The U.S., which has been the most dominant market for social media consumption in the last three years dropped from 30 percent of all time spent online to 27 percent. In Australia time spent on social dropped from 27 percent to 24 percent while in the UK it dipped from 25 percent to 22 percent year-over-year. This highlights the rise in access via 3G and 4G networks as consumers spend increasingly more time online while on the move. "Understanding consumer behavior across channels is more important than ever as more visits are being made on the move, particularly among social networking and email,” says Bill Tancer, general manager of global research for Experian Marketing Services. "With smartphones and tablets becoming more powerful, our data clearly indicates the difference between mobile and traditional desktop usage further enabling the ‘always on’ consumer mentality. Marketers need to understand these differences, as well as regionally, to ensure campaigns can be tailored for better and more effective engagement.” Mobile browsing When looking at the U.S. browsing data for mobile devices, email accounted for the largest time spent on average, for the same categories for Q1 2013. Email made up 23 percent of time spent on mobile devices for Q1-13, while social networking accounted for 15 percent. Entertainment had the third highest time spent with 13 percent, followed by shopping with 11 percent and travel with 9 percent. The mobile data does not include app usage, but does include mobile browsing within an app. Read more of the latest consumer trends in The 2013 Digital Marketer Report Learn more about consumer online behavior by visiting our Online Trends page Learn more about the author, Matt Tatham