
2024 marked a significant year. AI became integral to our workflows, commerce and retail media networks soared, and Google did not deprecate cookies. Amidst these changes, ID bridging emerged as a hot topic, raising questions around identity reliability and transparency, which necessitated industry-wide standards. We believe the latest IAB OpenRTB specifications, produced in conjunction with supply and demand-side partners, set up the advertising industry for more transparent and effective practices.
So, what exactly is ID bridging?
As signals, like third-party cookies, fade, ID bridging emerged as a way for the supply-side to offer addressability to the demand-side. ID bridging is the supply-side practice of connecting the dots between available signals, that were generated in a way that is not the expected default behavior, to understand a user’s identity and communicate it to prospective buyers. It enables the supply-side to extend user identification beyond the scope of one browser or device.
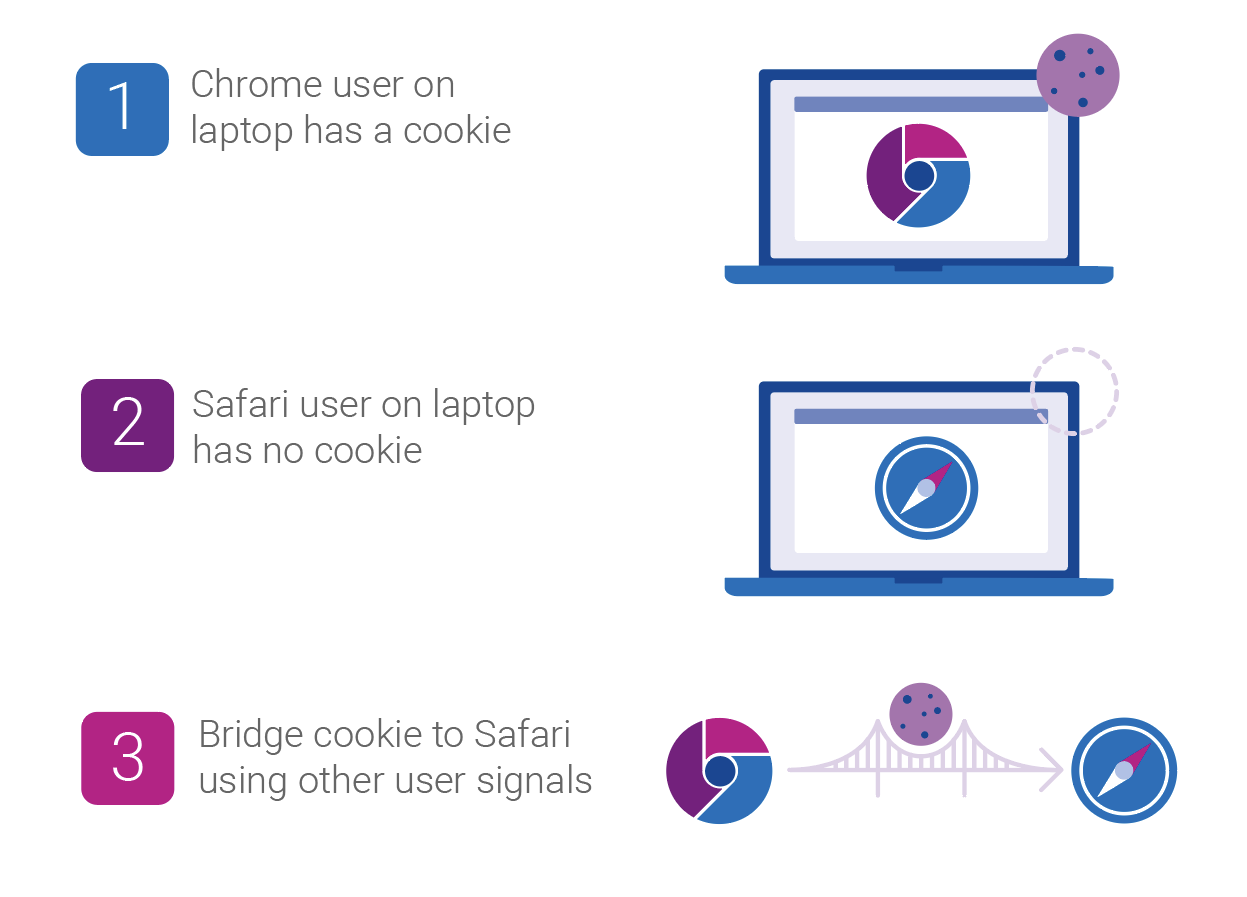
Imagine you visit a popular sports website on your laptop using Chrome. Later, you use the same device to visit the same sports website, but this time, on Safari. By using identity resolution tools, a supply-side partner can infer that both visits are likely from the same user and communicate with them as such.
ID bridging is not inherently a bad thing. However, the practice has sparked debate, as buyers want full transparency into the use of a deterministic identifier versus an inferred one. This complicates measurement and frequency capping for the demand-side. Before OpenRTB 2.6, ID bridging led to misattribution as the demand-side could not attribute ad exposures, which had been served to a bridged ID, to a conversion, which had an ID different from the ad exposure.
OpenRTB 2.6 sets us up for a more transparent future
In 2010, the IAB, along with supply and demand-side partners, formed a consortium known as the Real-Time Bidding Project for companies interested in an open protocol for the automated trading of digital media. The OpenRTB specifications they produced became that protocol, adapting with the evolution of the industry.
The latest evolution, OpenRTB 2.6, sets out standards that strive to ensure transparency in real-time bidding, mandating how the supply-side should use certain fields to more transparently provide data when inferring users’ identities.
What’s new in OpenRTB 2.6?
Here are the technical specifications for the industry to be more transparent when inferring users’ identities:
- Primary ID field: This existing field now can only contain the “buyeruid,” an identifier mutually recognized and agreed upon by both buyer and seller for a given environment. For web environments, the default is a cookie ID, while for app activity, it is a mobile advertising ID (MAID), passed directly from an application downloaded on a device. This approach ensures demand-side partners understand the ID’s source.
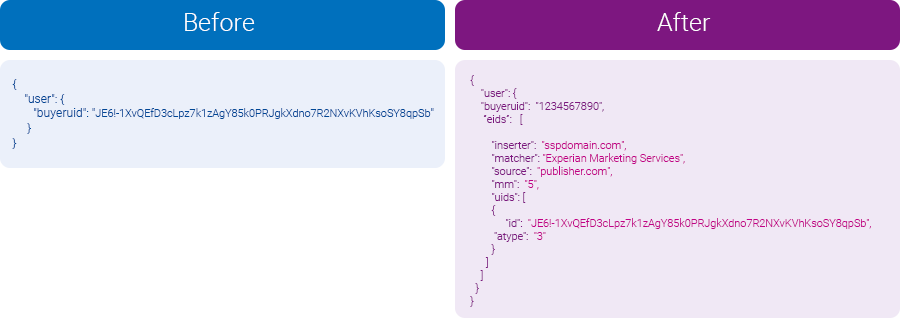
- Enhanced identifier (EID) field: The EID field, designated for alternative IDs, now accommodates all other IDs. The EID field now has additional parameters that provide buyers transparency into how the ID was created and sourced, which you can see in the visual below:
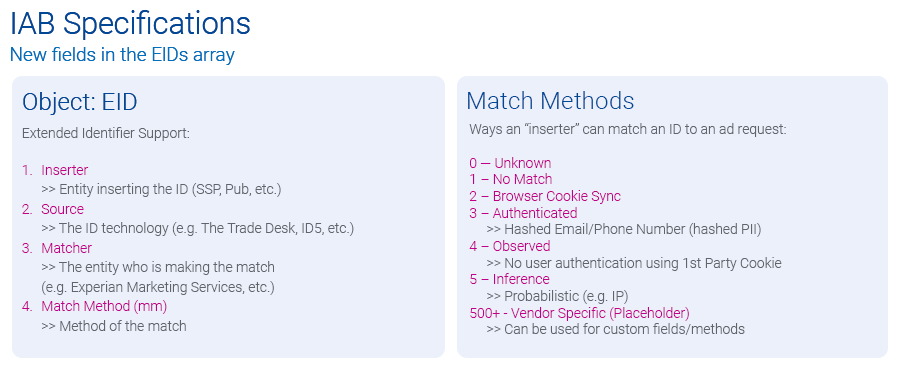
Using the above framework, a publisher who wants to send a cross-environment identifier that likely belongs to the same user would declare the ID as “mm=5,” while listing the potential third-party identity resolution partner under the “matcher” field, which the visual below depicts. This additional metadata gives the demand-side the insights they need to evaluate the reliability of each ID.
“These updates to OpenRTB add essential clarity about where user and device IDs come from, helping buyers see exactly how an ID was created and who put it into the bidstream. It’s a big step toward greater transparency and trust in the ecosystem. We’re excited to see companies already adopting these updates and can’t wait to see the industry fully embrace them by 2025.”
Hillary Slattery, Sr. Director, Programmatic, Product Management, IAB Tech Lab
Experian will continue supporting transparency
As authenticated signals decrease due to cookie deprecation and other consumer privacy measures, we will continue to see a rise in inferred identifiers. Experian’s industry-leading Digital Graph has long supported both authenticated and inferred identifiers, providing the ecosystem with connections that are accurate, scalable, and addressable. Experian will continue to support the industry with its identity resolution products and is supportive of the IAB’s efforts to bring transparency to the industry around the usage of identity signals.
Supply and demand-side benefits of adopting the new parameters in OpenRTB 2.6
- Partner collaboration: Clarity between what can be in the Primary ID field versus the EID field provides clear standards and transparency between buyers and sellers.
- Identity resolution: The supply side has an industry-approved way to bring in inferred IDs while the demand side can evaluate these IDs, expanding addressability.
- Reducing risk: With accurate metadata available in the EID field, demand-side partners can evaluate who is doing the match and make informed decisions on whether they want to act on that ID.
Next steps for the supply and demand-sides to consider
For supply-side and demand-side partners looking to utilize OpenRTB 2.6 to its full potential, here are some recommended steps:
For the supply-side:
- Follow IAB Specs and provide feedback: Ensure you understand and are following transparent practices. Ask questions on how to correctly implement the specifications.
- Vet identity partners: Choose partners who deliver the most trusted and accurate identifiers in the market.
- Be proactive: Have conversations with your partners to discuss how you plan to follow the latest specs, which identity partners you work with, and explain how you plan to provide additional signals to help buyers make better decisions.
We are beginning to see SSPs adopt this new protocol, including Sonobi and Yieldmo.
“The OpenRTB 2.6 specifications are a critical step forward in ensuring transparency and trust in programmatic advertising. By aligning with these standards, we empower our partners with the tools needed to navigate a cookieless future and drive measurable results.”
Michael Connolly, CEO, Sonobi
These additions to the OpenRTB protocol further imbue bidding transactions with transparency which will foster greater trust between partners. Moreover, the data now available is not only actionable, but auditable should a problem arise. Buyers can choose, or not, to trust an identifier based on the inserter, the provider and the method used to derive the ID. While debates within the IAB Tech Lab were spirited at times, they ultimately drove a collaborative process that shaped a solution designed to work effectively across the ecosystem.”
Mark McEachran, SVP of Product Management, Yieldmo
For the demand side:
- Evaluation: Use the EID metadata to assess all the IDs in the EID field, looking closely at the identity vendors’ reliability. Select partners who meet high standards of data clarity and accuracy.
- Collaboration: Establish open communication with supply-side partners and tech partners to ensure they follow the best practices in line with OpenRTB 2.6 guidelines and that there’s a shared understanding of the mutually agreed upon identifiers.
- Provide feedback: As OpenRTB 2.6 adoption grows, consistent feedback from demand-side partners will help the IAB refine these standards.
Moving forward with reliable data and data transparency
As the AdTech industry moves toward a cookieless reality, OpenRTB 2.6 signifies a substantial step toward a sustainable, transparent programmatic ecosystem. With proactive adoption by supply- and demand-side partners, the future of programmatic advertising will be driven by trust and transparency.
Experian, our partners, and our clients know the benefits of our Digital Graph and its support of both authenticated and inferred signals. We believe that if the supply-side abides by the OpenRTB 2.6 specifications and the demand-side uses and analyzes this data, the programmatic exchange will operate more fairly and deliver more reach.
Latest posts

Same-sex marriage is a hot button topic no matter on which side of the issue you stand. But there can be no denying that same-sex couples are finding an expanding number of options in the U.S. and abroad should they decide to legally wed. The 2010 LGBT Consumer Report explores the household arrangements and behaviors of America's LGBT consumers—in particular, those associated with marriage—compared to America's heterosexual population. You will learn that despite being less than half as likely to be married, lesbian, gay and bisexual adults are 22% more likely than their "straight" counterparts to have recently wed or to be planning nuptials for the next year. Looking for that perfect gift for the newly wed couple? You will also get some shopping tips for identifying favored retailers of lesbian, gay and bisexual shoppers. We'll start by sizing the LGBT market. An estimated 3.7% of the non-Hispanic adult population (7.1 million adults) self-identifies as LGBT, which can be broken down as follows: The average heterosexual adult lives in a household with 1.9 other individuals, including adults and kids. By comparison, the average lesbian shares her home with only 1.6 other people. Gay men live in the smallest households, sharing their home with only one other person, on average. Over a third of gay or bisexual men (38%) share their home with at least one other adult male, compared with only 24% of heterosexual men who live under the same roof as another adult male. Thirty-five percent of gay or bisexual men say they live with one (and only one) other adult male, a living arrangement that has a higher chance of consisting of a same-sex, co-habiting couple. Over half of lesbians or bisexual women (53%) share their home with at least one other adult female, compared with only 23% of heterosexual women who live under the same roof as another adult female. Forty-three percent of lesbian or bisexual women say they live with one (and only one) other adult female, a living arrangement that has a higher chance of consisting of a same-sex, co-habiting couple. Lesbian, Gay and Bisexual adults (LGB) as a group are less than half as likely as heterosexuals to be married. Only 26% of LGB adults are wed, compared with 57% of “straight” adults. Of all LGB adults, bisexuals are the most likely group to be married, with over 4 in 10 reporting they are presently wed. Lesbians are more than four and a half times more likely than gay men to be married, with 23% of lesbians having tied the knot versus only 5% of gay men. Lesbian, gay and bisexual adults as a group are 22% more likely than heterosexual adults to have either tied the knot in the last 12 months or have plans to wed in the coming year. 5.7% of lesbian, gay or bisexual adults are newly weds or “soonly” weds vs. 4.6% of heterosexual adults. Lesbian, gay and bisexual adults are twice as likely to shop at Neiman Marcus, making the department store the number one retailer with a wedding registry program among LGB shoppers. With many retailers ending their registry programs in favor of gift cards, we looked at how stores without registry programs stack up among lesbian, gay and bisexual shoppers. LGB adults are almost twice as likely to shop at J. Crew, making the store the number one retailer without a wedding registry program among LGB shoppers.
With the 82nd Academy Awards® just around the corner and only days before final voting ballots are due back to accounting firm PricewaterhouseCoopers, Experian Simmons is taking a close look at the American movie-going population. In any given month, over 56 million adults (26% of the adult population) make a trip to the cinema to take in a film. Movie-going typically reaches its peak in mid-summer, and 2009 was no exception. Experian Simmons DataStreamSM reports that in July of last year, 32% of adults went to movies, the highest level observed at any point in the year. In October of the same year, the percentage of past-month adult cinema-goers had dropped to just 19%, the lowest point observed in all of 2009. In this month’s Consumer Insights report, Experian Simmons sizes the movie-going audience, examines their receptivity to cinema ads—including pre-show commercials and product placement within films—online movie searches as well as Americans’ penchant for tuning into the Academy Awards. All data comes from the Simmons Summer 2009 National Consumer Study. Two-thirds of the adult population have gone to the movies at least once in the last 6 months. Nearly half (46%) have been in the last 90 days and a quarter (26%) have been in the last month. Young adults are, as expected, more likely to go to the movies than older adults, but adults over 50 outnumber young adults when it comes to raw number of movie-goers as you will see in the following chart. Over 147 million individuals have gone to the movies at least once in the last 6 months. With 20.8 million adults ages 18 to 24 going to the movies in the last 6 months, this age group accounts for only 14% of the movie-going population. Adults ages 50 and over, on the other hand, account for 37% of the movie-going population with over 55 million adults in this age group going to the theater at least once in the last 6 months. Among all adults who had been to the movies at least once in the last 6 months, 68% have been at least once in the last 30 days. Many movie-goers (39%) have been only once in the last month and only 7% have been four or more times. Young adults ages 18 to 24 are much more likely than the average movie-goer to have been to the theater in the last month with 75% reporting having been at least once and 10% having been 4 times or more. Experian Simmons DataStreamSM reports similar trends in past 30 day movie-going for 2008 and 2009 with the peak for this behavior occurring in both years on almost the exact same date. During the week of July 22, 2009 32% of adults reported having been to the theater during the last 30 days and during the week of July 21, 2008, 29% reported going. Cinema Blockbusters that month in ’09 included Bruno and Harry Potter and the Half-Blood Prince. In July of ’08, Mama Mia and The Dark Knight were released. When it comes to product placement in movies, frequent cinema-goers are most likely to respond. In fact, 41% of adults who went to the movies 4 or more times in the last 90 days are classified by the Simmons Movie Product Placement segmentation system as “Emulators,” those consumers who notice, remember and are driven to buy products placed into the context of a film. By comparison, only 28% of consumers who went to a movie only once in the last 90 days are Emulators. Forty-eight percent of Horror film fans say they often pay attention to commercials that show along with movie previews in movie theaters making them the most receptive to cinema advertisements followed by Romantic Comedy fans and Family movie fans. Only 39% of Foreign Language or Independent film fans say they pay attention to such ads. Nearly a quarter of all movie-goers get movie information, reviews or show times online in any given month. Aside from the obvious movie sites, you are likely to find movie information seekers on these sites: Californians like foreign language and independent films, whereas New Englanders have more of a penchant for Comedies and Southerners are among the most likely to see Horror films. Below are the top 5 metro areas for finding adults who say they usually see the three selected movie genres when they go to the theater. One-in-seven American adults tuned into the last Academy Awards® ceremony on ABC, including many non-movie-goers. Nine percent of adults who had not been to the movies even once in the past six months tuned into the last awards show and ultimately comprised 19% of all 2009 Oscar® viewers. Still, the more frequently a consumer goes to the movies, the more likely he or she is to watch the annual Academy Awards® ceremony.