
2024 marked a significant year. AI became integral to our workflows, commerce and retail media networks soared, and Google did not deprecate cookies. Amidst these changes, ID bridging emerged as a hot topic, raising questions around identity reliability and transparency, which necessitated industry-wide standards. We believe the latest IAB OpenRTB specifications, produced in conjunction with supply and demand-side partners, set up the advertising industry for more transparent and effective practices.
So, what exactly is ID bridging?
As signals, like third-party cookies, fade, ID bridging emerged as a way for the supply-side to offer addressability to the demand-side. ID bridging is the supply-side practice of connecting the dots between available signals, that were generated in a way that is not the expected default behavior, to understand a user’s identity and communicate it to prospective buyers. It enables the supply-side to extend user identification beyond the scope of one browser or device.
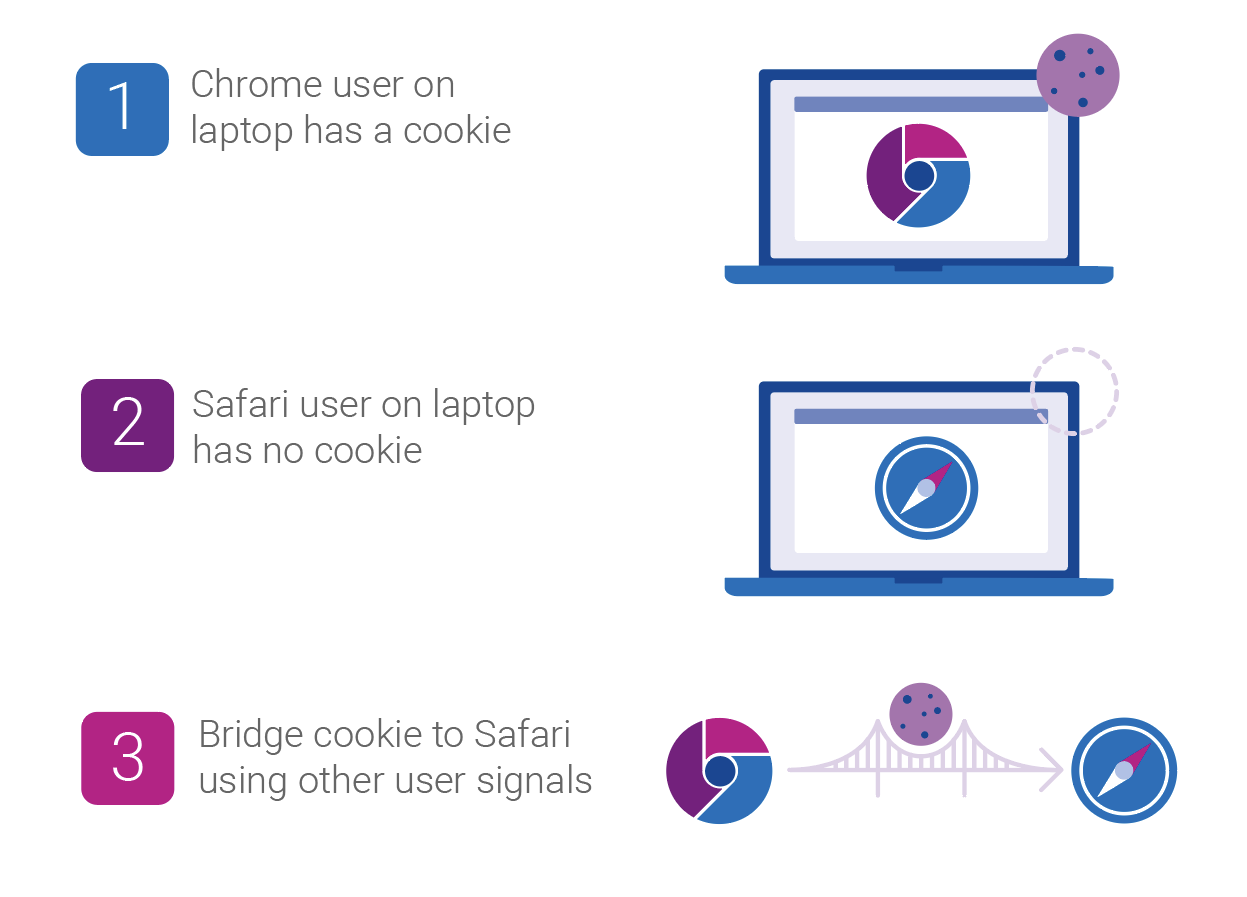
Imagine you visit a popular sports website on your laptop using Chrome. Later, you use the same device to visit the same sports website, but this time, on Safari. By using identity resolution tools, a supply-side partner can infer that both visits are likely from the same user and communicate with them as such.
ID bridging is not inherently a bad thing. However, the practice has sparked debate, as buyers want full transparency into the use of a deterministic identifier versus an inferred one. This complicates measurement and frequency capping for the demand-side. Before OpenRTB 2.6, ID bridging led to misattribution as the demand-side could not attribute ad exposures, which had been served to a bridged ID, to a conversion, which had an ID different from the ad exposure.
OpenRTB 2.6 sets us up for a more transparent future
In 2010, the IAB, along with supply and demand-side partners, formed a consortium known as the Real-Time Bidding Project for companies interested in an open protocol for the automated trading of digital media. The OpenRTB specifications they produced became that protocol, adapting with the evolution of the industry.
The latest evolution, OpenRTB 2.6, sets out standards that strive to ensure transparency in real-time bidding, mandating how the supply-side should use certain fields to more transparently provide data when inferring users’ identities.
What’s new in OpenRTB 2.6?
Here are the technical specifications for the industry to be more transparent when inferring users’ identities:
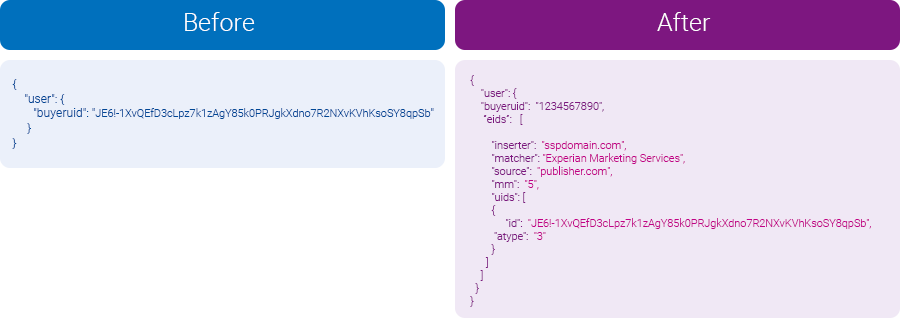
- Primary ID field: This existing field now can only contain the “buyeruid,” an identifier mutually recognized and agreed upon by both buyer and seller for a given environment. For web environments, the default is a cookie ID, while for app activity, it is a mobile advertising ID (MAID), passed directly from an application downloaded on a device. This approach ensures demand-side partners understand the ID’s source.
- Enhanced identifier (EID) field: The EID field, designated for alternative IDs, now accommodates all other IDs. The EID field now has additional parameters that provide buyers transparency into how the ID was created and sourced, which you can see in the visual below:
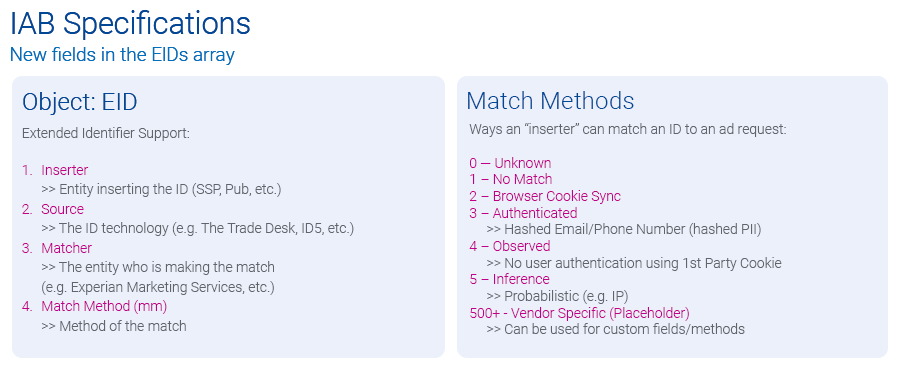
Using the above framework, a publisher who wants to send a cross-environment identifier that likely belongs to the same user would declare the ID as “mm=5,” while listing the potential third-party identity resolution partner under the “matcher” field, which the visual below depicts. This additional metadata gives the demand-side the insights they need to evaluate the reliability of each ID.
“These updates to OpenRTB add essential clarity about where user and device IDs come from, helping buyers see exactly how an ID was created and who put it into the bidstream. It’s a big step toward greater transparency and trust in the ecosystem. We’re excited to see companies already adopting these updates and can’t wait to see the industry fully embrace them by 2025.”
Hillary Slattery, Sr. Director, Programmatic, Product Management, IAB Tech Lab
Experian will continue supporting transparency
As authenticated signals decrease due to cookie deprecation and other consumer privacy measures, we will continue to see a rise in inferred identifiers. Experian’s industry-leading Digital Graph has long supported both authenticated and inferred identifiers, providing the ecosystem with connections that are accurate, scalable, and addressable. Experian will continue to support the industry with its identity resolution products and is supportive of the IAB’s efforts to bring transparency to the industry around the usage of identity signals.
Supply and demand-side benefits of adopting the new parameters in OpenRTB 2.6
- Partner collaboration: Clarity between what can be in the Primary ID field versus the EID field provides clear standards and transparency between buyers and sellers.
- Identity resolution: The supply side has an industry-approved way to bring in inferred IDs while the demand side can evaluate these IDs, expanding addressability.
- Reducing risk: With accurate metadata available in the EID field, demand-side partners can evaluate who is doing the match and make informed decisions on whether they want to act on that ID.
Next steps for the supply and demand-sides to consider
For supply-side and demand-side partners looking to utilize OpenRTB 2.6 to its full potential, here are some recommended steps:
For the supply-side:
- Follow IAB Specs and provide feedback: Ensure you understand and are following transparent practices. Ask questions on how to correctly implement the specifications.
- Vet identity partners: Choose partners who deliver the most trusted and accurate identifiers in the market.
- Be proactive: Have conversations with your partners to discuss how you plan to follow the latest specs, which identity partners you work with, and explain how you plan to provide additional signals to help buyers make better decisions.
We are beginning to see SSPs adopt this new protocol, including Sonobi and Yieldmo.
“The OpenRTB 2.6 specifications are a critical step forward in ensuring transparency and trust in programmatic advertising. By aligning with these standards, we empower our partners with the tools needed to navigate a cookieless future and drive measurable results.”
Michael Connolly, CEO, Sonobi
These additions to the OpenRTB protocol further imbue bidding transactions with transparency which will foster greater trust between partners. Moreover, the data now available is not only actionable, but auditable should a problem arise. Buyers can choose, or not, to trust an identifier based on the inserter, the provider and the method used to derive the ID. While debates within the IAB Tech Lab were spirited at times, they ultimately drove a collaborative process that shaped a solution designed to work effectively across the ecosystem.”
Mark McEachran, SVP of Product Management, Yieldmo
For the demand side:
- Evaluation: Use the EID metadata to assess all the IDs in the EID field, looking closely at the identity vendors’ reliability. Select partners who meet high standards of data clarity and accuracy.
- Collaboration: Establish open communication with supply-side partners and tech partners to ensure they follow the best practices in line with OpenRTB 2.6 guidelines and that there’s a shared understanding of the mutually agreed upon identifiers.
- Provide feedback: As OpenRTB 2.6 adoption grows, consistent feedback from demand-side partners will help the IAB refine these standards.
Moving forward with reliable data and data transparency
As the AdTech industry moves toward a cookieless reality, OpenRTB 2.6 signifies a substantial step toward a sustainable, transparent programmatic ecosystem. With proactive adoption by supply- and demand-side partners, the future of programmatic advertising will be driven by trust and transparency.
Experian, our partners, and our clients know the benefits of our Digital Graph and its support of both authenticated and inferred signals. We believe that if the supply-side abides by the OpenRTB 2.6 specifications and the demand-side uses and analyzes this data, the programmatic exchange will operate more fairly and deliver more reach.
Latest posts

We asked the experts about hashed email. What is email hashing? Do we need to hash email addresses in databases? What can we expect for hashed identifiers?

While the weather outside is frightfully hot this summer, it’s never too soon to start thinking about the holidays – and consumers are more likely to start their holiday shopping early this year. To get you ready for the 2022 holiday shopping season, we looked back at consumer shopping trends from 2019-2021. What did we learn and what trends do we expect to see this year? Let’s look back. A look back Over the last three years, average consumer spending has increased. Record 2021 holiday sales came amidst a wave of COVID-19 cases, rising inflation, labor shortages, and supply chain problems. Despite these challenges, consumers continued to let it snow when it came to spending during the holiday season. 2022 has been a year with its own economic roadblocks – the war in Ukraine, rising gas prices, and recession concerns. Yet 2021 was a banner year for holiday sales despite its obstacles, and we predict similar trends in the 2022 holiday shopping season. What trends do we expect to see for the most wonderful time of the year? 2022 predictions While consumer spending remains strong, changing economic conditions continue to shape shopper behavior. To develop our predictions for 2022 holiday shopper behavior, we focused on four key areas: When consumers shop Where consumers shop What consumers purchase Consumer media preferences Now, let's make our holiday campaign planning checklist and check it twice. When consumers shop Chestnuts roasting on an open fire. Jack Frost nipping at your nose. Those aren’t the only ways to know when the holiday season has begun. Shoppers tend to spread out their holiday purchases across multiple months and were more likely to start shopping earlier. To understand holiday retail sales trends from 2019-2021, we identified four shopper segments: Early Shoppers Traditional Shoppers Late Shoppers Random Shoppers What differences did we see between our four shopper segments? Early shoppers made almost half of their holiday purchases in October Random shoppers spread out their holiday purchases evenly across multiple months Late shoppers made almost half of their holiday purchases in December Traditional shoppers made almost half of their holiday purchases in November While December continues to dominate holiday sales, October has started to gain traction over the last three years, and November remains a core shopping month. Everybody knows a turkey and a mistletoe help to make the season bright but knowing when your consumers are most likely to shop will help deck your campaign planning halls. Jingle bell rock your way to holiday sales that shine bright with our tips to prepare for earlier shoppers: Offer targeted promotions earlier in the shopping season Target your ads based on the shopping habits of your customers throughout the season Where consumers shop There’s no place like home for the holidays but most consumers aren’t shopping from home. Despite the rise in online shopping, brick and mortar locations continue to dominate holiday sales. October is the most popular month to take a one-horse open sleigh to a store, and consumers gather around the fire to online shop in November and December. With most shoppers preferring to shop in-store, and e-commerce popularity growing, it’s critical to think about bridging the gap between your online and offline presence for the consumer. Are you offering multiple paths to purchase with solutions such as BOPIS (Buy Online, Pickup In-Store)? Go down in history like Rudolph with our tips to prepare for more in-store shopping: Focus on in-store shopping experience technology (self-checkout, VR, QR codes, scan to pay, etc.) Offer multiple paths to purchase to connect your online and physical presence through methods such as BOPIS (Buy Online, Pickup In-Store), BORIS (Buy Online, Return In-Store), and ROPO (Research Online, Purchase Offline), etc. What consumers purchase When it comes to holiday gifts, for some, only a hippopotamus will do. Compared to pre-pandemic, shoppers are spending more at apparel stores and mass retailers. Spending at specialty retailers, warehouse clubs, and on office, electronic, and games is almost the same across holiday and non-holiday shopping months. Time for toys and time for cheer may be year-round, but are there any correlations between where consumers shop (online vs. in-store) and what they purchase? Our data found that shoppers who bought from mass retailers were more likely to shop online, while shopping for apparel and warehouse clubs was done at a physical store location. Put this insight to the test by thinking through how you can target your consumer based on where they shop in-store and online. You just might find that hippopotamus at a brick and mortar mass retailer location! Consumer media preferences Do you see what I see? While we are seeing a shift to digital media channel preference, consumers still engage with traditional media channels like direct mail and the traditional newspaper. Successfully connecting with your customers involves capturing their attention through the right channel. We found that our four shopping groups prefer a mix of traditional and digital media channels. What does your media channel mix look like? Hark! The herald angels sing of ways to adapt to the change in holiday spend and media preferences: Align your activation efforts to digital, but don't forget about traditional channels Expand your targeting and activation focus beyond in-store vs. online Download our new 2024 report For a deeper dive into our predictions and actionable insights you can use to take your holiday campaign planning home for the holidays, download our new 2024 report. Experian data can help you refine your content and creative strategy to achieve maximum ROI for each campaign across all your channels. Download now

Fluctuation in consumers' behaviors and preferences during the pandemic has prompted a shift in the practices and patterns that we are accustomed to. Powerful market forces are emerging as society builds a new normal, forcing marketers to rethink their strategy, activation, and measurement. It is important for marketers to understand the forces that influence the industry, and to learn about alternative approaches that can be applied to help reach their goals. In our recent webinar, ‘How to Adjust to the New World of Advertising,’ Experian’s Chris Feo and guest speaker Tina Moffett, Principal Analyst at Forrester Research, lead an in-depth discussion of the market dynamics and developments guiding us to this new era of advertising. They talked about: The pandemic changing consumer behavior Emerging media channels Data deprecation The pandemic and increased media consumption The pandemic caused seismic shifts in consumer behaviors and business operations. Work from home became the norm, consumers made drastic changes in their routines, and businesses had to adjust to new operating models as local economies shrank and supply chains strained. As stay-at-home orders were put into effect, consumers increased their media consumption drastically as more time was spent at home in front of their devices. According to Forrester, by June 2020, 48% of US online adults subscribed to at least one streaming service, while 34% had signed up for multiple. Forrester contends that: Social and online video/OTT will grow fastest among other categories of ad spend Connected TV outpaces other video advertising channels 55% of consumers plan to continue watching movies at home rather than in theatres after the pandemic Data deprecation The ways that marketers can personalize content and measure the effectiveness of campaigns is changing with data deprecation. Consumer preferences, regulations, and technology providers are evolving the way advertisers understand consumers, causing changes to existing identity-based marketing strategies. According to Forrester, 66% of marketers are investing in first-party data collection strategies to adapt to these market forces. Marketers need to adjust Demand for a new advertising approach Changes in consumer behavior, evolving media consumption patterns, and data deprecation have marketers looking at new approaches to targeting and measurement. However, with the future uncertain in many of these areas, marketers need to test and experiment to determine which approach is best for them in particular use cases. Shifting to a new world of experimentation Advertisers need to start by assessing their current environment to determine where they have exposure today, which methods of identification they are using, and how those channels may be impacted by the market forces outlined earlier. From there, they need to start asking themselves how they can assess identity in the future or if there is another way to approach advertising in that specific channel. There are specific areas where marketers can look to make investments in terms of experimentation: Adoption of cleanrooms to support analytics and audience targeting Investment in first-party data to overcome the issue of data deprecation Shifting to a value-based, omni-channel advertising mindset to address customers’ needs Investment in data-savvy resources to manage media insights Adoption of consistent cross-platform advertising metrics and currencies to inform better planning If you missed our recent webinar ‘How to Adjust to the New World of Advertising,’ you can listen to the full discussion here.