In our Ask the Expert Series, we interview leaders from our partner organizations who are helping lead their brands to new heights in AdTech. Today’s interview is with Ben Smith, VP of Product, Data Products at Infillion.
Adapting to signal loss
What does the Experian–Infillion integration mean for advertisers looking to reach audiences as signals fade?

As cookies and mobile identifiers disappear, brands need a new way to find and reach their audiences. The Experian integration strengthens Infillion’s XGraph, a cookieless, interoperable identity graph that supports all major ID frameworks, unifying people and households across devices with privacy compliance, by providing a stronger identity foundation with household- and person-level data. This allows us to connect the dots deterministically and compliantly across devices and channels, including connected TV (CTV). The result is better match rates on your first-party data, more scalable reach in cookieless environments, and more effective frequency management across every screen.
Connecting audiences across channels
How does Experian’s Digital Graph strengthen Infillion’s ability to deliver addressable media across channels like CTV and mobile?
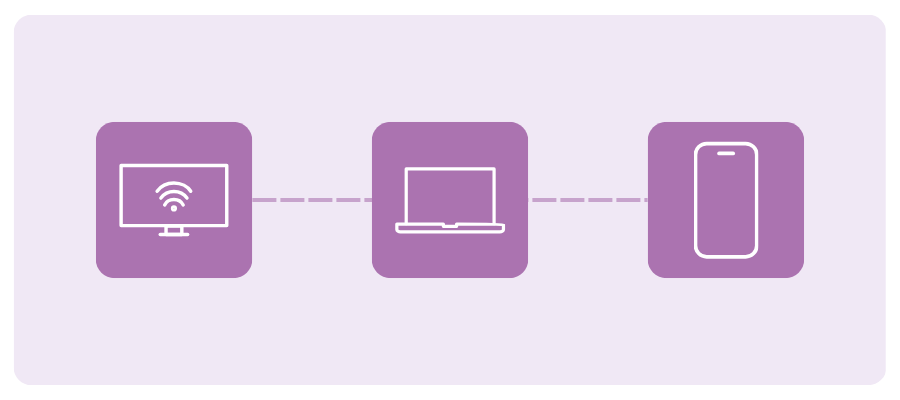
Experian strengthens the household spine of XGraph, which means we can accurately connect CTV impressions to the people and devices in that home – then extend those connections to mobile and web. This lets us plan, activate, and measure campaigns at the right level: household for CTV, and person or device for mobile and web. The outcome is smarter reach, less waste from over-frequency, and campaigns that truly work together across channels.
The value of earned attention
Infillion has long championed “guaranteed attention” in advertising. How does that philosophy translate into measurable outcomes for brands?

Our engagement formats, such as TrueX, are based on a simple principle: attention should be earned, not forced. Viewers choose to engage with the ad and complete an action, which means every impression represents real, voluntary attention rather than passive exposure. Because of that, we consistently see stronger completion rates, deeper engagement, and clearer downstream results – like lower acquisition costs, improved on-site behavior, and measurable brand lift.
To take that a step further, we measure attention through UpLift, our real-time brand lift tool. UpLift helps quantify how exposure to a campaign influences awareness, consideration, or purchase intent, providing a more complete picture of how earned attention translates into business impact.
Creative innovation and location insights
Beyond identity resolution, what are some of Infillion’s capabilities, like advanced creative formats or location-based insights, that set you apart in the market?
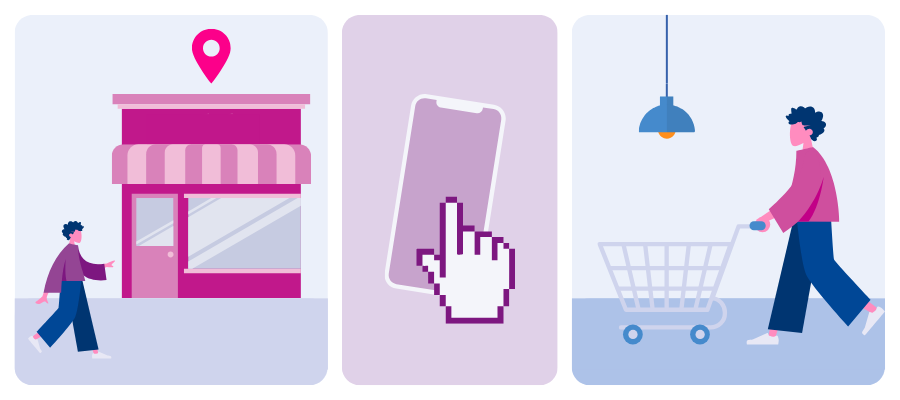
One key area is location intelligence, which combines privacy-safe geospatial insights with location-based targeting through our proprietary geofencing technology. This allows us to build custom, data-driven campaigns that connect media exposure to real-world outcomes – like store visits and dwell time – measured through Arrival, our in-house footfall attribution product.
We also build custom audiences using a mix of zero-party survey data, first-party location-based segments, and bespoke audience builds aligned to each advertiser’s specific strategy.
Then there’s creative innovation, which is a major differentiator for us. Our high-impact formats go beyond static display, such as interactive video units that let viewers explore products through hotspots or carousels, rich-media ads that feature polls, quizzes, dynamic distance, or gamified elements, and immersive experiences that encourage active participation rather than passive viewing. These creative formats not only capture attention but also generate deeper engagement and stronger performance for a variety of KPIs.
Future ready media strategies
How does Infillion’s ID-agnostic approach help brands future-proof their media strategies amid ongoing privacy and tech changes?
We don’t put all our eggs in one basket. XGraph securely unifies multiple durable identifiers alongside our proprietary TrueX supply to strengthen CTV household reach. This agnostic design allows us to adapt as platforms, regulations, and browsers evolve – so you can preserve reach and measurement capabilities without getting locked into a single ID or losing coverage when the next signal deprecates.
Raising the bar for media accountability
Looking ahead, how is Infillion evolving its platform to meet the next wave of challenges in audience engagement and media accountability?
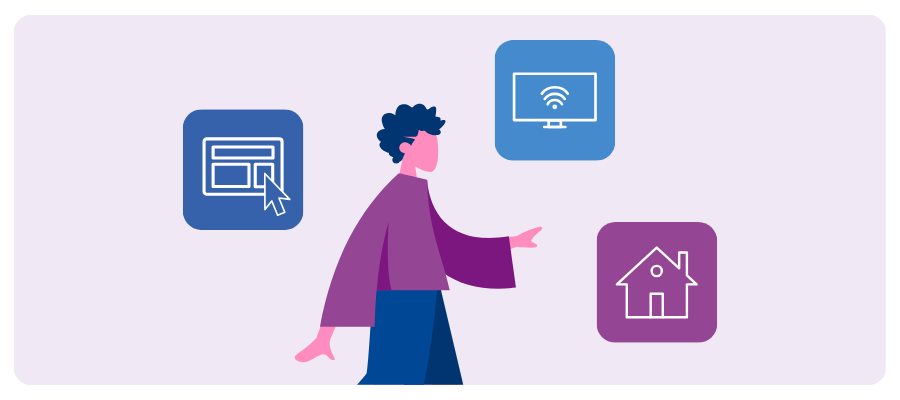
From an engagement standpoint, we’re expanding our ability to support the full customer journey, offering ad experiences that move seamlessly from awareness to consideration to conversion. That includes smarter creative that adapts to context, intelligent targeting and retargeting informed by real data, and formats designed to drive measurable outcomes rather than just impressions.
When it comes to accountability, we’re ensuring that measurement is both flexible and credible. In addition to our proprietary tools, we partner with leading third-party measurement providers to validate results and give advertisers confidence that their investment is truly performing. Within our DSP, we emphasize full transparency and log-level data access, ensuring advertisers can see exactly what’s happening on every impression.
All of this builds toward the next era of agentic media buying – one enabled by our MCP suite and modular, component-based tools. This evolution brings greater accountability and next-generation audience engagement to an increasingly automated, intelligent media landscape. Our goal is to help brands connect more meaningfully with audiences while holding every impression – and every outcome – to a higher standard of transparency and effectiveness.
Driving impact across the funnel
What is a success story or use cases that demonstrate the impact of the Experian–Infillion integration?
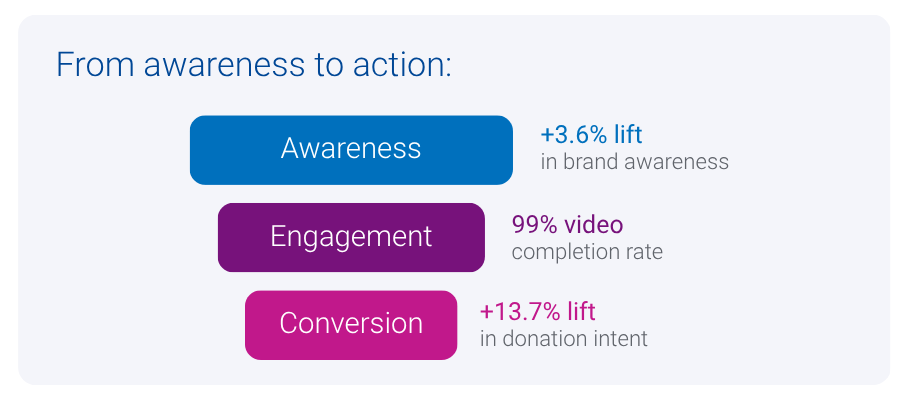
We recently partnered with a national veterans’ organization to raise awareness of its programs for injured or ill veterans and their families. Using the Experian integration, we combined persistent household- and person-level identifiers with cross-device activation to reach veteran and donor audiences more precisely across CTV, display, and rich media. The campaign achieved standout results – industry-leading engagement rates, a 99% video completion rate, and measurable lifts in both brand awareness (3.6 % increase) and donation consideration (13.7% lift). It’s a clear example of how stronger identity and smarter activation can drive meaningful outcomes across the full funnel.
Contact us
Identity resolution FAQs
Identity resolution ensures accurate connections between devices, households, and individuals. Experian’s Offline Identity Resolution and Digital Graph strengthen these connections for improved targeting and consistent measurement across CTV, mobile, and web.
Solutions like Experian’s Digital Graph enable brands to connect first-party data to household and person-level identifiers, ensuring scalable reach and compliant audience targeting legacy signals fade.
Focusing on earned attention (where audiences actively choose to engage) leads to stronger completion rates, improves on-site behavior, and drives measurable increases in brand awareness and consideration.
By linking CTV impressions to households and extending those connections to mobile and web, Experian’s identity solutions ensure campaigns work together seamlessly, reducing over-frequency and improving overall reach.
About our expert

Ben Smith
VP Product, Data Products, Infillion
Ben Smith leads Infillion’s Data Products organization, delivering identity, audience, and measurement solutions across the platform. Previously, he was CEO and co-founder of Fysical, a location intelligence startup acquired by Infillion in 2019.
About Infillion
Infillion is the first fully composable advertising platform, built to solve the challenges of complexity, fragmentation, and opacity in the digital media ecosystem. With MediaMath at its core, Infillion’s modular approach enables advertisers to seamlessly integrate or independently deploy key components—including demand, data, creative, and supply. This flexibility allows brands, agencies, commerce and retail media networks, and resellers to create tailored, high-performance solutions without the constraints of traditional, all-or-nothing legacy systems.
Latest posts

Same-sex marriage is a hot button topic no matter on which side of the issue you stand. But there can be no denying that same-sex couples are finding an expanding number of options in the U.S. and abroad should they decide to legally wed. The 2010 LGBT Consumer Report explores the household arrangements and behaviors of America's LGBT consumers—in particular, those associated with marriage—compared to America's heterosexual population. You will learn that despite being less than half as likely to be married, lesbian, gay and bisexual adults are 22% more likely than their "straight" counterparts to have recently wed or to be planning nuptials for the next year. Looking for that perfect gift for the newly wed couple? You will also get some shopping tips for identifying favored retailers of lesbian, gay and bisexual shoppers. We'll start by sizing the LGBT market. An estimated 3.7% of the non-Hispanic adult population (7.1 million adults) self-identifies as LGBT, which can be broken down as follows: The average heterosexual adult lives in a household with 1.9 other individuals, including adults and kids. By comparison, the average lesbian shares her home with only 1.6 other people. Gay men live in the smallest households, sharing their home with only one other person, on average. Over a third of gay or bisexual men (38%) share their home with at least one other adult male, compared with only 24% of heterosexual men who live under the same roof as another adult male. Thirty-five percent of gay or bisexual men say they live with one (and only one) other adult male, a living arrangement that has a higher chance of consisting of a same-sex, co-habiting couple. Over half of lesbians or bisexual women (53%) share their home with at least one other adult female, compared with only 23% of heterosexual women who live under the same roof as another adult female. Forty-three percent of lesbian or bisexual women say they live with one (and only one) other adult female, a living arrangement that has a higher chance of consisting of a same-sex, co-habiting couple. Lesbian, Gay and Bisexual adults (LGB) as a group are less than half as likely as heterosexuals to be married. Only 26% of LGB adults are wed, compared with 57% of “straight” adults. Of all LGB adults, bisexuals are the most likely group to be married, with over 4 in 10 reporting they are presently wed. Lesbians are more than four and a half times more likely than gay men to be married, with 23% of lesbians having tied the knot versus only 5% of gay men. Lesbian, gay and bisexual adults as a group are 22% more likely than heterosexual adults to have either tied the knot in the last 12 months or have plans to wed in the coming year. 5.7% of lesbian, gay or bisexual adults are newly weds or “soonly” weds vs. 4.6% of heterosexual adults. Lesbian, gay and bisexual adults are twice as likely to shop at Neiman Marcus, making the department store the number one retailer with a wedding registry program among LGB shoppers. With many retailers ending their registry programs in favor of gift cards, we looked at how stores without registry programs stack up among lesbian, gay and bisexual shoppers. LGB adults are almost twice as likely to shop at J. Crew, making the store the number one retailer without a wedding registry program among LGB shoppers.
With the 82nd Academy Awards® just around the corner and only days before final voting ballots are due back to accounting firm PricewaterhouseCoopers, Experian Simmons is taking a close look at the American movie-going population. In any given month, over 56 million adults (26% of the adult population) make a trip to the cinema to take in a film. Movie-going typically reaches its peak in mid-summer, and 2009 was no exception. Experian Simmons DataStreamSM reports that in July of last year, 32% of adults went to movies, the highest level observed at any point in the year. In October of the same year, the percentage of past-month adult cinema-goers had dropped to just 19%, the lowest point observed in all of 2009. In this month’s Consumer Insights report, Experian Simmons sizes the movie-going audience, examines their receptivity to cinema ads—including pre-show commercials and product placement within films—online movie searches as well as Americans’ penchant for tuning into the Academy Awards. All data comes from the Simmons Summer 2009 National Consumer Study. Two-thirds of the adult population have gone to the movies at least once in the last 6 months. Nearly half (46%) have been in the last 90 days and a quarter (26%) have been in the last month. Young adults are, as expected, more likely to go to the movies than older adults, but adults over 50 outnumber young adults when it comes to raw number of movie-goers as you will see in the following chart. Over 147 million individuals have gone to the movies at least once in the last 6 months. With 20.8 million adults ages 18 to 24 going to the movies in the last 6 months, this age group accounts for only 14% of the movie-going population. Adults ages 50 and over, on the other hand, account for 37% of the movie-going population with over 55 million adults in this age group going to the theater at least once in the last 6 months. Among all adults who had been to the movies at least once in the last 6 months, 68% have been at least once in the last 30 days. Many movie-goers (39%) have been only once in the last month and only 7% have been four or more times. Young adults ages 18 to 24 are much more likely than the average movie-goer to have been to the theater in the last month with 75% reporting having been at least once and 10% having been 4 times or more. Experian Simmons DataStreamSM reports similar trends in past 30 day movie-going for 2008 and 2009 with the peak for this behavior occurring in both years on almost the exact same date. During the week of July 22, 2009 32% of adults reported having been to the theater during the last 30 days and during the week of July 21, 2008, 29% reported going. Cinema Blockbusters that month in ’09 included Bruno and Harry Potter and the Half-Blood Prince. In July of ’08, Mama Mia and The Dark Knight were released. When it comes to product placement in movies, frequent cinema-goers are most likely to respond. In fact, 41% of adults who went to the movies 4 or more times in the last 90 days are classified by the Simmons Movie Product Placement segmentation system as “Emulators,” those consumers who notice, remember and are driven to buy products placed into the context of a film. By comparison, only 28% of consumers who went to a movie only once in the last 90 days are Emulators. Forty-eight percent of Horror film fans say they often pay attention to commercials that show along with movie previews in movie theaters making them the most receptive to cinema advertisements followed by Romantic Comedy fans and Family movie fans. Only 39% of Foreign Language or Independent film fans say they pay attention to such ads. Nearly a quarter of all movie-goers get movie information, reviews or show times online in any given month. Aside from the obvious movie sites, you are likely to find movie information seekers on these sites: Californians like foreign language and independent films, whereas New Englanders have more of a penchant for Comedies and Southerners are among the most likely to see Horror films. Below are the top 5 metro areas for finding adults who say they usually see the three selected movie genres when they go to the theater. One-in-seven American adults tuned into the last Academy Awards® ceremony on ABC, including many non-movie-goers. Nine percent of adults who had not been to the movies even once in the past six months tuned into the last awards show and ultimately comprised 19% of all 2009 Oscar® viewers. Still, the more frequently a consumer goes to the movies, the more likely he or she is to watch the annual Academy Awards® ceremony.