Loading...

How Experian and Audigent are working together to boost PMP advertising

Published: April 11, 2023 by Experian Marketing Services

Advertisers are always looking for ways to improve the targeting and effectiveness of their campaigns. One strategy that’s gaining popularity lately is using curated private marketplace (PMP) deals, allowing advertisers to buy premium ad inventory in a private auction environment. But how do data providers and PMPs work together to make PMP advertising more successful?

What is a private marketplace (PMP)?

Advertising PMPs, or private marketplace deals, are a type of programmatic advertising where advertisers and publishers negotiate and set up a direct deal between themselves to buy or sell advertising inventory in a private auction environment. In PMP deals, publishers can make their premium inventory available to a select group of advertisers, who can bid on it in a private auction using demand-side platforms (DSPs). These private auctions typically offer higher-quality inventory and a more targeted audience than open exchange auctions, which are accessible to all advertisers. However, traditional PMPs had their limitations, including often being limited to accessing inventory from a single publisher group.

Audigent takes PMP advertising to the next level with SmartPMPs

How Experian and Audigent partner in PMP advertising.

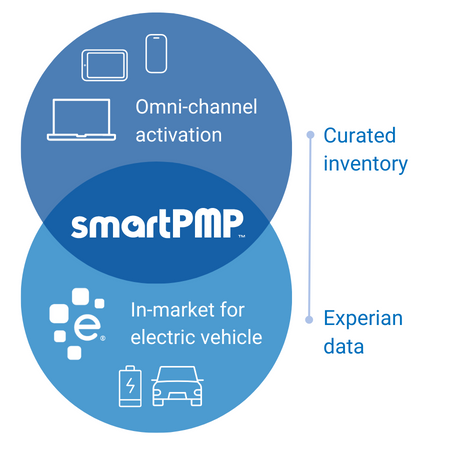
Audigent’s key differentiator is that instead of activating audience data from the DSP, which is the industry standard, they integrate directly with supply-side platforms (SSPs). By taking this route, audience data and inventory from hundreds or even thousands of publishers can now be packaged together into a single deal ID / SmartPMP. SmartPMPs empower media buyers with the ability to access and buy against unique, customizable data segments on premium curated publisher inventory in combinations that otherwise would not have been available.

Activating data via the supply-side also enables supply-side optimizations. This means that instead of simply being a data provider, Audigent plays an active role in the success of media buyers’ programmatic campaigns by optimizing toward performance goals in coordination with demand-side buyers. The result is the full alignment of demand- and supply-side technologies for the first time in programmatic.

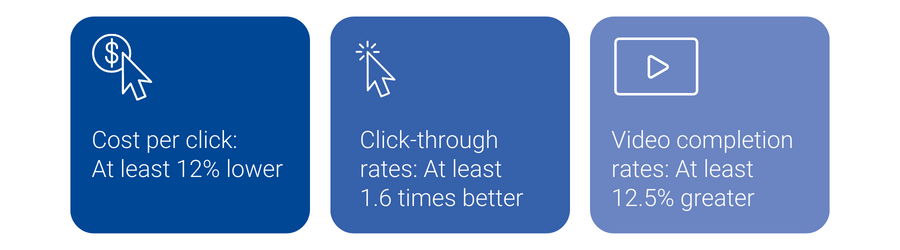
SmartPMPs drive campaign performance

Audigent performance data compared to the programmatic open exchange:

Audigent performance data compared to the programmatic open exchange.

How Experian and Audigent partner in PMP advertising

Experian and Audigent collaborate using Consumer View audience data. By supplying valuable insights into users’ interests, behaviors, and demographics, we help advertisers create more targeted and personalized ad campaigns with Audigent. This can lead to higher engagement rates, greater brand awareness, and increased conversions for Audigent and Experian clients.

By activating Experian data via Audigent SmartPMPs, advertisers unlock the ability to reach highly engaged users across premium, curated inventory sources on key channels like connected TV (CTV), display, video, and more.

Unlock the potential of programmatic advertising with us

Our strategic collaboration with Audigent is transforming the programmatic advertising space. Our partnership enables our customers to tailor their ads directly to their desired audience. This elevated personalization results in higher conversion rates and optimized campaigns for superior ROI performance.

Contact us for more information about our digital audience segments on the Audigent platform. To learn more about our partner Audigent, visit www.audigent.com.


Latest posts

Loading…
Print Coupon Use Strong Despite Increase In Digital Coupons

In the digital age, print coupons are dinosaurs, right? Not one bit. In fact, according to Experian Simmons, users of printed coupons — those obtained from newspapers, magazines, mail, etc.—outnumber users of digital coupons by a margin of almost 3-to-1. As of February 14, 2011 (the latest date for which data was available at the time of this post), 68% of all U.S. adults said their household uses print coupons, a number that has remained relatively unchanged during the past five years. 68% of all U.S. adults said their household uses print coupons, a number that has remained relatively unchanged during the past five years. By comparison, Experian Simmons also reports that 22% of all U.S. adults say their household uses digital coupons obtained from email or the Internet. That figure may be lower than the usage reported for any measured type of print coupon, including those handed out in or near stores, but adoption of digital coupons is growing: in 2005, just 12% of American adults used digital coupons. Smartphones adoption will continue to propel digital coupon use to historic highs in the months and years to come. According to an analysis featured in the 2010 U.S. Household Consumer Trend and Benchmark Report, 34% of U.S. iPhone owners use digital coupons compared with just 21% of non-iPhone owners. Interestingly, use of print coupons among iPhone owners doesn’t suffer a bit. In fact, as of February 14, 2011, 68% of iPhone owners reported that their household used print coupons versus 64% of non-iPhone owners, making it obvious that merchants should give their customers an option of using both print and digital coupons. For further consumer insights, download the 2010 U.S. Household Consumer Trend and Benchmark Report, which includes trends on economic outlook by household income, charitable contributions and planned automobile purchases.

Mar 31,2011 by

Cinderella Teams Have Contrasting Styles Both on the Court and in the Marketplace

Spiders, Rams, Seminoles, Golden Eagles, and Bulldogs. This is one way to describe the diverse collection of Cinderella teams that have advanced to the Sweet 16 in this year's NCAA men's basketball tournament. Four of these teams, the University of Richmond, Virginia Commonwealth University (VCU), Florida State, and Marquette, take their double-digit seeds to the next round in hopes of reaching the Elite 8. Butler, last year's Cinderella story, is seeking a visit to the Final Four for the second straight year.  Interestingly, Richmond, VA is the home market for two of the Sweet 16 teams. These are the University of Richmond and VCU. Even more interesting is the fact that these two teams are on a collision course. With wins in the next round they would meet in the Elite 8 for a prized spot in the Final Four. With their surprise victories in the tournament so far, what these teams have in common is being labeled “bracket busters.” A more extensive market analysis uncovers other similarities, plus some notable differences. Here are highlights from profiles of the home market areas for this year's Cinderella teams using data from Experian's Mosaic consumer lifestyle segmentation system and Experian Simmons market research. The following statistics are based on the home markets of the five Cinderella teams. All four Cinderella teams hail from markets with above average interest in college basketball.  Milwaukee, home of 11th seeded Marquette, has the highest concentration of adults who are interested in college basketball (28.1%). This is 11 percent relatively higher than percentage for the total U.S. Milwaukee also has the highest percentage of adults who said they watched last year's men's NCAA Division I tournament (17.3%). This is a relative six percent higher than the total U.S.  The 10th seeded Florida State Seminoles hail from Tallahassee, which has the second highest percentage of adults with an interest in college basketball (26.9%). Richmond, where both 11th seeded VCU and 12th seeded Richmond are based, is just behind Tallahassee when it comes to the percentage of adults who are interested in college basketball (26.7%). Indianapolis has the lowest percent of residents who are interested in college basketball (26.3%), but that's still a relative four percent higher than the U.S. as a whole. Although interest should be very high this year, Richmond and Indianapolis (15.8% each) have the lowest percentage of adults who watched last year's tournament. Cinderella Team Market Snapshots Richmond, VA Home market of: Richmond Spiders, VCU Rams Sweet 16 opponents: Kansas, Florida State The top two segments in Richmond representing 30% of the market's households are: Metro Minority Communities (18.1%) comprised of married couples and single-parent minorities earning above average incomes from a mix of service industry and white-collar jobs in transportation, health care, education, and public administration. Urban Commuter Families (11.5%) comprised of upscale, college educated Baby Boomer families and couples living in single detached homes in city neighborhoods on the metropolitan fringe. Other interesting facts: Most over-represented segment is Metro Minority Communities (3.8 times the national average) Percent of adults with interest in college basketball is 26.7% Percent of adults who watched last year's men's college basketball tournament is 15.8% Tallahassee, FL Home market of: Florida State Seminoles Sweet 16 opponent: VCU Rams Similar to Richmond, the top two segments in Tallahassee are Metro Minority Communities (14.8%) and Urban Commuter Families (6.9%). The two segments that account for the next highest share of households are: Struggling City Centers (6.7%) comprised of young, single and single-parent minority renters living in low-income city neighborhoods. Rural Southern Living (6.5%) comprised of lower-income blue-collar couples and families living in sparsely settled mobile home communities. Other interesting facts: Most over-represented market segment is College Town Communities (6.2 times the national average) Percent of adults with interest in college basketball is 26.9% Percent of adults who watched last year's men's college basketball tournament is 16.8% Milwaukee, WI Home market of: Marquette Golden Eagles Sweet 16 opponent: North Carolina Tarheels The top segment in Milwaukee representing 11.2% of households is Urban Commuter Families (as described above). The two segments that account for the next highest share of households are: Small-town Success (10.5%) comprised of white collar, college educated, middle-aged working couples living in newly developed subdivisions outside the nation's beltways. Steadfast Conservative (9.3%) comprised of high-school educated mature singles and couples living in middle-class urban blue-collar neighborhoods. Other interesting facts: Most over-represented market segment is Successful Suburbia (3.6 times the national average) Percent of adults with interest in college basketball is 28.1% Percent of adults who watched last year's men's college basketball tournament is 17.3% Indianapolis, IN Home market of: Butler Bulldogs Sweet 16 opponent: Wisconsin Badgers There are four equal size segments that account for just over 30% of Indianapolis households. These include Steadfast Conservative (8.9%), Urban Commuter Families (7.8%), and Small-town Success (7.1%). All three of these segments are also among the top five in Richmond, Tallahassee, and Milwaukee. What makes Indianapolis unique from the other three markets is a higher percentage of New Suburbia Families (7.2%). These are young, affluent working couples with pre-school children concentrated in fast-growing, metro fringe communities. Other interesting facts: Most over-represented market segment is Successful Suburbia (2.8 times the national average) Percent of adults with interest in college basketball is 26.3% Percent of adults who watched last year's men's college basketball tournament is 15.8%

Mar 23,2011 by

Catching Office Online NCAA Tournament Streamers in the Act

Tournament play begins this week in the 2011 NCAA Men's Division I Basketball Tournament, which means office productivity is likely to take a hit as fans jump online to watch live streams of games being played during working hours. With online viewing options expanded to mobile and other digital platforms this year, fans have more avenues than ever to get their March Madness fix. In fact, according to a recent estimate by Challenger, Gray & Christmas, total online tournament viewership during work hours is likely to reach 8.4 million hours during this year's tournament. In this latest installment of Experian Marketing Services' continuing March Madness consumer coverage, we'll profile the work life of online game streamers. Is there one down the hall or in the next cube? The answer is almost certainly “yes,” but the “who” may surprise you.  According to Experian Simmons, just over 5% of all U.S. adults and nearly a quarter of adult NCAA men's tournament viewers (24%) qualify as likely online game streamers. For the purpose of this analysis, likely online game streamers is defined as those U.S. adults who watched the last NCAA men's basketball tournament who also sought out sports information online or watched online video in the last 30 days. These likely online game streamers must have also visited either cbssports.com or espn.com in the last 30 days. Fully 79% of likely online game streamers are employed either full-or or part-time, with 59% working 40 or more hours a week. Department managers and IT staff-have reason to be concerned about a loss in productivity during March Madness: fully 79% of likely online game streamers are employed either full-or or part-time, with 59% working 40 or more hours a week. Don't be so quick to suspect that colleague who always shows up late and goes home early as a game streamer. A safer bet would be the guy who's always at his desk when you get in and still there when you head out. In fact, one-in-ten adults who work more than 40 hours a week (11%) are likely online game streamers, meaning they're more than twice as likely as the average adult to be checking out the game online. Remote employees who work at home often get a bad rap with office “suits” sometimes assuming their pajama-clad colleagues fall prey to distractions. Actually though, Americans who work from home are no more or less likely to be likely online streamers than those who don't work from home. Likewise, the self-employed are no more or less likely to be online game streamers than laborers who work for “the man.” Interestingly, Experian Simmons found a direct correlation between company size and a worker's chance of being a likely online game streamer. Specifically: Those who work in companies with fewer than 100 employees are 17% less likely than the average American worker to be likely online game streamers. Those who work in companies with between 100 and 499 employees are just two percent less likely than average to be likely streamers while those employed by companies with between 500 and 999 employees are eight percent more likely to be online game streamers. Employees of companies with 1,000 or more employees are the most likely culprits with the group on average being 17% more likely to be likely online game streamers. As such, it's no surprise that Fortune 500 companies are the most at risk of having offices full of online streamers during March Madness. Employees of Fortune 500 companies are fully 66% more likely to be online game streamers than those who Americans employed by a non-Fortune 500 company. Finally, the best insight into whether your office mates are streaming basketball games online instead of working is by looking at their paycheck (not that we encourage that of course). Specifically, as income rises, so does one's chance of being an online game streamer: Employed Americans who personally earn less than $25,000 annually are the least likely to be online game streamers, scoring 50% below average on this metric. Those who earn between $25,000 and $49,999 are only 15% less likely to be game streamers. If you know or suspect that your colleague earns upwards of $50,000 a year, it's a good idea to keep an eye on them for the rest of the month; workers with incomes between $50,000 and $74,999 are 33% more likely than average to be likely game streamers and those who earn between $75,000 and $99,999 are 75% more likely to be likely game streamers. Your colleagues earning $100,000 or more annually are the most likely to be streaming online, with those personally taking home between $100,000 and $149,000 being a whopping 164% more likely than the average employee to be streaming games online. And those earning $150,000 or more annually being fully 176% more likely to be online game streamers. Moreover, one-in-five adults who earn $150,000 a year or more fall into our likely online game streamers segment compared with just 5% of all U.S. adults. The first match-up to be played during the traditional workday tips off at 12:15 EDT on Thursday March 17th when West Virginia takes on the winner of the second round-one play-in game. Armed with this information, you should be able to catch-or join-your office's online game streamers in the act.

Mar 17,2011 by

Subscribe to our newsletter

Enter your name and email for the latest updates

This site is protected by reCAPTCHA and the Google Privacy Policy and Terms of Service apply.

About Experian Marketing Services

At Experian Marketing Services, we use data and insights to help brands have more meaningful interactions with people. As leaders in the evolution of the advertising landscape, Experian Marketing Services can help you identify your customers and the right potential customers, uncover the most appropriate communication channels, develop messages that resonate, and measure the effectiveness of marketing activities and campaigns.

Visit our website

Subscribe to our newsletter

Stay up to date on the latest industry news and receive expert tips from our marketing experts.
Subscribe now!