Loading...

How Experian and Audigent are working together to boost PMP advertising

Published: April 11, 2023 by Experian Marketing Services

Advertisers are always looking for ways to improve the targeting and effectiveness of their campaigns. One strategy that’s gaining popularity lately is using curated private marketplace (PMP) deals, allowing advertisers to buy premium ad inventory in a private auction environment. But how do data providers and PMPs work together to make PMP advertising more successful?

What is a private marketplace (PMP)?

Advertising PMPs, or private marketplace deals, are a type of programmatic advertising where advertisers and publishers negotiate and set up a direct deal between themselves to buy or sell advertising inventory in a private auction environment. In PMP deals, publishers can make their premium inventory available to a select group of advertisers, who can bid on it in a private auction using demand-side platforms (DSPs). These private auctions typically offer higher-quality inventory and a more targeted audience than open exchange auctions, which are accessible to all advertisers. However, traditional PMPs had their limitations, including often being limited to accessing inventory from a single publisher group.

Audigent takes PMP advertising to the next level with SmartPMPs

How Experian and Audigent partner in PMP advertising.

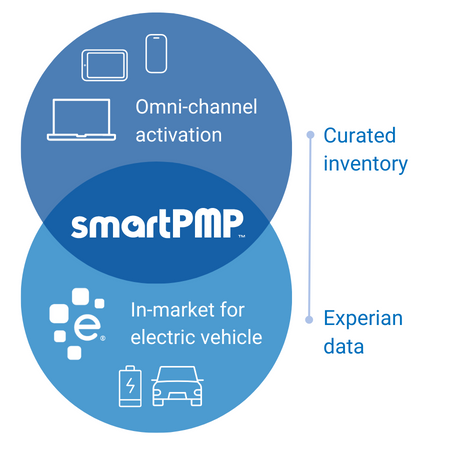
Audigent’s key differentiator is that instead of activating audience data from the DSP, which is the industry standard, they integrate directly with supply-side platforms (SSPs). By taking this route, audience data and inventory from hundreds or even thousands of publishers can now be packaged together into a single deal ID / SmartPMP. SmartPMPs empower media buyers with the ability to access and buy against unique, customizable data segments on premium curated publisher inventory in combinations that otherwise would not have been available.

Activating data via the supply-side also enables supply-side optimizations. This means that instead of simply being a data provider, Audigent plays an active role in the success of media buyers’ programmatic campaigns by optimizing toward performance goals in coordination with demand-side buyers. The result is the full alignment of demand- and supply-side technologies for the first time in programmatic.

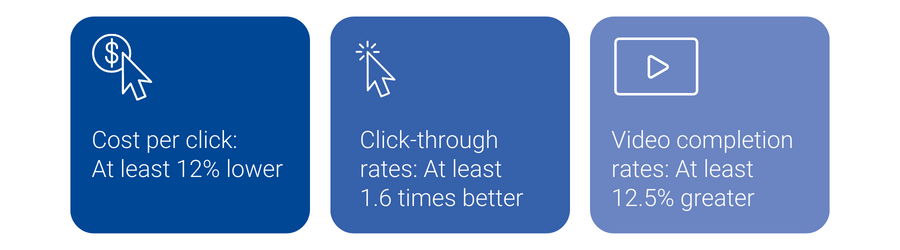
SmartPMPs drive campaign performance

Audigent performance data compared to the programmatic open exchange:

Audigent performance data compared to the programmatic open exchange.

How Experian and Audigent partner in PMP advertising

Experian and Audigent collaborate using Consumer View audience data. By supplying valuable insights into users’ interests, behaviors, and demographics, we help advertisers create more targeted and personalized ad campaigns with Audigent. This can lead to higher engagement rates, greater brand awareness, and increased conversions for Audigent and Experian clients.

By activating Experian data via Audigent SmartPMPs, advertisers unlock the ability to reach highly engaged users across premium, curated inventory sources on key channels like connected TV (CTV), display, video, and more.

Unlock the potential of programmatic advertising with us

Our strategic collaboration with Audigent is transforming the programmatic advertising space. Our partnership enables our customers to tailor their ads directly to their desired audience. This elevated personalization results in higher conversion rates and optimized campaigns for superior ROI performance.

Contact us for more information about our digital audience segments on the Audigent platform. To learn more about our partner Audigent, visit www.audigent.com.


Latest posts

Loading…
Demographic and Preferences of Coffee Drinkers in America

Coffee drinkers in America Coffee plays such an integral part of every day life in America that it may be safe to say that coffee helps the United States go round. In fact, fully 60% of all U.S. households use either whole or ground coffee beans at home. Experian Simmons extensively reviewed the American coffee drinker for this report which features detailed insights into the coffee-drinking American. In addition, we compare the patrons of Dunkin’ Donuts and Starbucks, the leading players in the battle for brew. Coffee in the Home The average U.S. household that uses whole or ground coffee consumes 4.2 cups per day. In total that’s about 280.5 million cups of coffee consumed at home by Americans each day or about 102 billion cups per year. Among households that use coffee, 89% stock regular coffee and 46% stock decaf.* Among households that use coffee, 84% use pre-ground coffee and 26% use whole bean coffee at least some of the time.* Instant Flavored Coffee Over a quarter of households (27%) stock instant coffee. Sixteen percent of households use instant flavored coffee. The most commonly used flavors among instant flavored coffee drinkers are: Older Americans More Likely to Drink Coffee Fifty-seven percent of adults ages 18-24 live in households that use coffee, but 25 to 34 year olds are the least likely to stock coffee in their cupboards with only 54% reporting they use whole or ground bean coffee at home. Coffee Use Increases with Household Income Seventy percent of Americans who report annual household incomes of $150,000+ drink coffee compared with 54% of those with household income less than $25,000. Dunkin' Donuts Vs. Starbucks Dunkin' Donuts 11% of American adults go to DD Between 9.15.08 and 9.15.09 the share of DD customers who go there 6+ times a month is up 11%* DD consumers are 41% more likely than the average adult to be registered Independents and 9% less likely to be registered Republicans Starbucks 13% of American adults go to Starbucks Between 9.15.08 and 9.15.09 the share of Starbucks customers who go there 6+ times a month is down 22% Starbucks consumers are 11% more likely to be registered Independents and 11% more likely to be registered Republicans Coffee Drinkers Are Coffee Drinkers A majority of coffee-drinking Americans are loyal to their franchise. However, there are a considerable number of Dunkin’ Donuts and Starbucks consumers who jump between coffee houses. How Often Americans Order Their Coffee The majority of both Dunkin’ Donuts and Starbucks customers visit each chain between one and five times in a typical month. Learn more about Simmons consumer research and studies.

Dec 01,2009 by

Coupons Boost Holiday Sales Revenue

Two-thirds of U.S. Households Use Coupons Two-thirds of American households (67%) use coupons. And while the vast majority of households using coupons (87%) say they use them to save money, 30% also say that coupons are a way for them to try out new products. Newspapers are still the number one coupon source with 70% of coupon households still getting their coupons from a newspaper. The Internet is growing as a coupon source. A quarter of coupon households get coupons online today, up 46% in the last three years. What Americans Buy With Their coupons Nearly half of all American households use coupons to buy food/grocery products making them the most common items purchased with coupons followed by cleaning products and beauty/grooming products. Seven percent of households buy tobacco using coupons. Where Are Coupons Redeemed? Given that half of U.S. households use coupons for food/grocery products, it’s no surprise that 60% of all households redeem coupons in supermarket, grocery or convenient stores. While only a quarter of all households use coupons at restaurants/fast food chains, that number has risen by 9% since 2006, when 23% of households redeemed coupons at restaurants. Coupons Attract New Consumers With the start of the holiday shopping season around the corner retailers want to make sure consumers visit their store and/or website. One way to drive consumer traffic is with coupons. Close to 50 percent of American adults say they are likely to be drawn to a store they don’t normally shop at by a coupon. The Experian Simmons retail shopping segment known as Mall Maniacs make up just 12% of all shoppers, but that group is 82% more likely to be drawn to a new store by a coupon. Percentage of U.S. Adult Population by Shopping Segment Mall Maniacs and Status Strivers are 66% and 26% more likely, respectively, to appreciate getting emails that announce new products and services. Identifying these consumers is key to maximize online marketing dollars. Additionally, with more and more consumers shopping online, companies should ensure that coupons are redeemable both online and in-stores.

Nov 23,2009 by

Shopping Preferences and Purchase Behaviors of NHL Fans

Definition of an NHL and Non-NHL fan The behaviors and preferences of National Hockey League (NHL) and non-NHL fans are compared in this report. Below are the definitions of each consumer type: NHL fans are 18+ adults who are either “very”, “somewhat”, or “a little bit” interested in NHL Non-NHL fans are 18+ adults who are “not at all” interested in NHL Who Are NHL Fans? Compared to 2006, there are 11 percent more American adults who are NHL fans*. And with 52 percent of its fans under the age of 45, the NHL’s fan base is – for the most part – young. NHL Fans Are Educated and Well Paid NHL fans are more likely than non-NHL fans to have graduated college and attained a graduate degree. The benefits of their higher education is clear as NHL fans are 64 percent more likely than non-NHL fans to personally earn an income of $150,000 or more annually. Next we’ll examine a few luxuries NHL fans enjoy: home-ownership, watches, and vehicles. Home Owners Seventy-seven percent of NHL fans own their place of residence. The graph below charts the percentage of NHL and non-NHL fans who own any resident type (includes house, condominium, co-op and mobile home). As illustrated, there are more NHL fans than non-fans who own homes that value at $300,000 or more. Watches Twenty-six percent of NHL fans purchased a watch for themselves or someone else in the last 12 months and their tastes are not cheap. NHL fans are 2.6 times more likely than non-fans to have spent $500 or more on a timepiece. Vehicles Similar to their watch purchasing behavior, NHL fans are willing to splurge on their vehicles. For their most recent vehicle purchase, NHL fans were 13 percent more likely than non-NHL fans to spend over $30,000. Internet Purchases NHL fans spend big online. During the last 12 months, NHL fans spent a total $9.9 billion on Internet purchases. Among those who made a purchase in the last year, NHL fans are 25 percent more likely than non-NHL fans to spend $1,000 or more online during the year. In fact, 41 percent of NHL fans who shop the Internet spend at least $500 online a year. Business Purchase Decision Makers The previous slides established that NHL fans have expensive taste and aren’t troubled spending extra to purchase personal items. However, can the same be said for business-related purchases? Indeed it can. Not only are there more NHL fans than non-fans making business purchase decisions, they’re also 54 percent more likely than non-fans to spend $100,000 or more on office products. Conclusion The National Hockey League has a growing fan base that doesn’t mind spending extra for products and services.

Oct 05,2009 by

Subscribe to our newsletter

Enter your name and email for the latest updates

This site is protected by reCAPTCHA and the Google Privacy Policy and Terms of Service apply.

About Experian Marketing Services

At Experian Marketing Services, we use data and insights to help brands have more meaningful interactions with people. As leaders in the evolution of the advertising landscape, Experian Marketing Services can help you identify your customers and the right potential customers, uncover the most appropriate communication channels, develop messages that resonate, and measure the effectiveness of marketing activities and campaigns.

Visit our website

Subscribe to our newsletter

Stay up to date on the latest industry news and receive expert tips from our marketing experts.
Subscribe now!