Loading...

UAT TEST HS – Shopping for the right data

Published: March 21, 2025 by Hayley Schneider

In a perfect world, we’d all have a single, go-to grocery store that carried everything on our shopping list – fresh produce, gourmet coffee beans, rare spices, and maybe even that special-grade olive oil, right alongside our wholesale bulk purchases at unbeatable prices. It would be convenient and efficient, and it’d save a lot of driving around town.

The changing data marketplace: From one-stop shop to specialized selection

For a long time, data buyers enjoyed something similar in their world: a small set of large-scale data marketplaces that offered a wide array of audiences, making it easy to load up on whatever you needed in one place. Not only are there fewer places to pick everything up, but new factors like privacy and signal deprecation are placing a spotlight on quality and addressability.

Just as our dinner plans are growing more ambitious insofar as we want health, flavor, value, and convenience all in one place – so are our data strategies. Instead of a single steak-and-potatoes meal, today’s data marketplace operators might be cooking up a complex menu of campaigns.

“Experian has been a longstanding partner of DISH Media, and we’re excited to be an early adopter of their marketplace which leverages the foundation of their identity solutions to ensure maximum cross-channel reach as we look to expand the breadth and depth of data we use for addressable TV.”

Kemal Bokhari, Head of Data, Measurement & Analytics, DISH Media

As a result, data buyers are beginning to shop around. Some still rely on large-scale marketplaces for familiar staples, but now they have reasons to explore other options. Some are turning to providers known for offering top-tier, transparently sourced segments. Others are focusing on specialty providers that excel in one area.

A more selective approach to data buying

In this environment, choosing where to “shop” for data is becoming more deliberate and selective. Data buyers aren’t just thinking about broad scale; they’re looking to prioritize quality, durability, data privacy, and differentiation. They need to place higher value on data marketplaces that can maintain audience addressability over time, despite signal loss. Sometimes, that means accepting a smaller assortment in exchange for tighter vetting and more reliable targeting. Other times it means mixing and matching – stopping by one marketplace for premium segments and another for cost-friendly, wide-reaching data sets. Either way, they can benefit from having more choices.

“Experian has been a longstanding partner of DISH Media, and we’re excited to be an early adopter of their marketplace which leverages the foundation of their identity solutions to ensure maximum cross-channel reach as we look to expand the breadth and depth of data we use for addressable TV.”

Kemal Bokhari, Head of Data, Measurement & Analytics, DISH Media

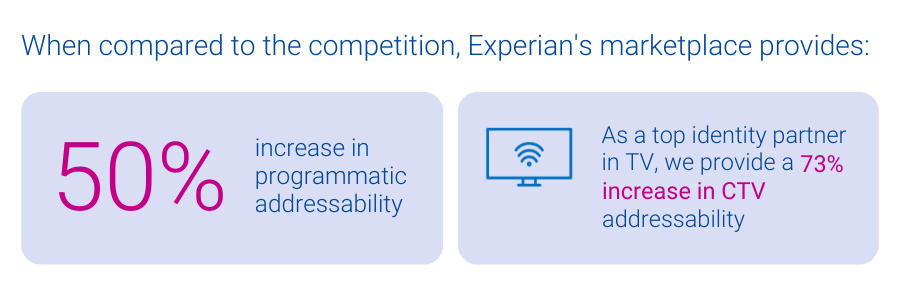
Experian’s marketplace: A trusted source for high-quality data

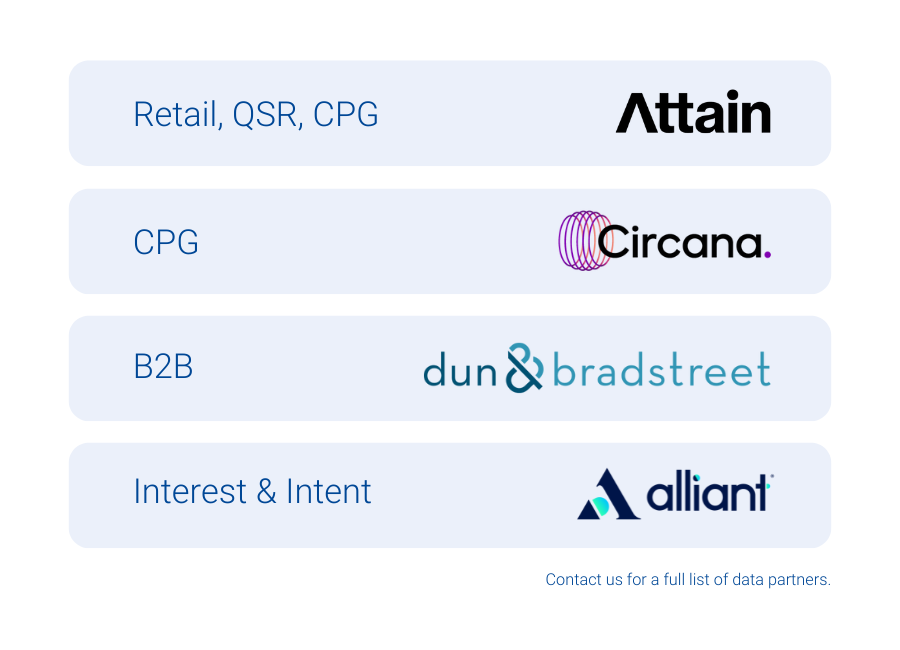
Experian’s vetted and curated blend of data partners and vertically-aligned audiences offers a trusted specialty store for data buyers. Experian’s marketplace, powered by identity graphs that include 126 million households, 250 million individuals, and 4 billion active digital IDs, enables partner audiences to be easily activated and maintain high addressability across display, mobile, and connected TV (CTV) channels. In particular, Experian’s marketplace provides:

Enhanced addressability and match rates

All audiences delivered from the marketplace benefit from our best-in-class offline and digital identity graphs, which ensure addressability across all channels like display, mobile, and CTV. Unlike other data marketplaces, Experian ensures all identifiers associated with an audience have been active and are targetable, improving the accuracy of audience planning.

50% increase in programmatic addressability As a top identity partner in TV, we provide a 73% increase in CTV addressability
Experian marketplace -> Experian delivers audiences -> Destination platform activates campaign

The future of data marketplaces: Precision and flexibility matter

The evolution of data marketplaces reflects the industry’s shifting priorities. Data buyers seek specificity, reliability, and adaptability to align with their diverse campaign needs. The best data strategy, much like the best grocery run, isn’t about grabbing everything in one place – it’s about carefully selecting the right ingredients to create the perfect recipe for success. This shift underscores the importance of flexibility and precision as data buyers navigate a landscape shaped by privacy regulations, signal loss, and evolving consumer expectations.

Experian marketplace partners

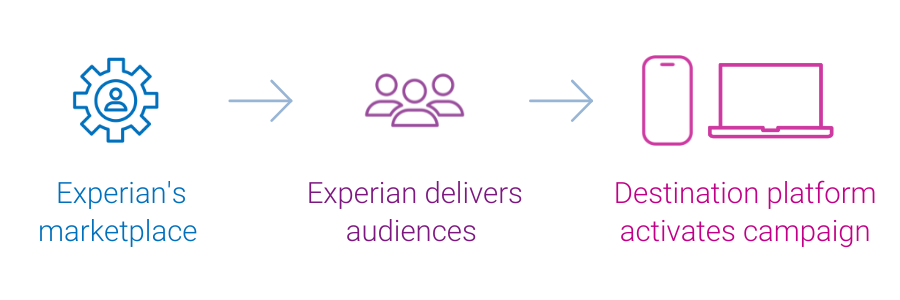
As data marketplaces adapt to meet these demands, they are redefining what it means to deliver value. Experian’s marketplace enables buyers to strike the perfect balance between reach and quality by offering enhanced match rates, precise audience planning, and seamless distribution. In this new era, data buyers have the tools and options to craft campaigns that are impactful and aligned with the increasingly selective and privacy-conscious digital landscape. The key is recognizing that today’s data strategy is about utilizing the strengths of many to create a cohesive and effective whole.

If you’re interested in learning more about Experian’s marketplace or becoming an active buyer or seller in our marketplace, please contact us.


Latest posts

Loading…
Print Coupon Use Strong Despite Increase In Digital Coupons

In the digital age, print coupons are dinosaurs, right? Not one bit. In fact, according to Experian Simmons, users of printed coupons — those obtained from newspapers, magazines, mail, etc.—outnumber users of digital coupons by a margin of almost 3-to-1. As of February 14, 2011 (the latest date for which data was available at the time of this post), 68% of all U.S. adults said their household uses print coupons, a number that has remained relatively unchanged during the past five years. 68% of all U.S. adults said their household uses print coupons, a number that has remained relatively unchanged during the past five years. By comparison, Experian Simmons also reports that 22% of all U.S. adults say their household uses digital coupons obtained from email or the Internet. That figure may be lower than the usage reported for any measured type of print coupon, including those handed out in or near stores, but adoption of digital coupons is growing: in 2005, just 12% of American adults used digital coupons. Smartphones adoption will continue to propel digital coupon use to historic highs in the months and years to come. According to an analysis featured in the 2010 U.S. Household Consumer Trend and Benchmark Report, 34% of U.S. iPhone owners use digital coupons compared with just 21% of non-iPhone owners. Interestingly, use of print coupons among iPhone owners doesn’t suffer a bit. In fact, as of February 14, 2011, 68% of iPhone owners reported that their household used print coupons versus 64% of non-iPhone owners, making it obvious that merchants should give their customers an option of using both print and digital coupons. For further consumer insights, download the 2010 U.S. Household Consumer Trend and Benchmark Report, which includes trends on economic outlook by household income, charitable contributions and planned automobile purchases.

Mar 31,2011 by

Cinderella Teams Have Contrasting Styles Both on the Court and in the Marketplace

Spiders, Rams, Seminoles, Golden Eagles, and Bulldogs. This is one way to describe the diverse collection of Cinderella teams that have advanced to the Sweet 16 in this year's NCAA men's basketball tournament. Four of these teams, the University of Richmond, Virginia Commonwealth University (VCU), Florida State, and Marquette, take their double-digit seeds to the next round in hopes of reaching the Elite 8. Butler, last year's Cinderella story, is seeking a visit to the Final Four for the second straight year.  Interestingly, Richmond, VA is the home market for two of the Sweet 16 teams. These are the University of Richmond and VCU. Even more interesting is the fact that these two teams are on a collision course. With wins in the next round they would meet in the Elite 8 for a prized spot in the Final Four. With their surprise victories in the tournament so far, what these teams have in common is being labeled “bracket busters.” A more extensive market analysis uncovers other similarities, plus some notable differences. Here are highlights from profiles of the home market areas for this year's Cinderella teams using data from Experian's Mosaic consumer lifestyle segmentation system and Experian Simmons market research. The following statistics are based on the home markets of the five Cinderella teams. All four Cinderella teams hail from markets with above average interest in college basketball.  Milwaukee, home of 11th seeded Marquette, has the highest concentration of adults who are interested in college basketball (28.1%). This is 11 percent relatively higher than percentage for the total U.S. Milwaukee also has the highest percentage of adults who said they watched last year's men's NCAA Division I tournament (17.3%). This is a relative six percent higher than the total U.S.  The 10th seeded Florida State Seminoles hail from Tallahassee, which has the second highest percentage of adults with an interest in college basketball (26.9%). Richmond, where both 11th seeded VCU and 12th seeded Richmond are based, is just behind Tallahassee when it comes to the percentage of adults who are interested in college basketball (26.7%). Indianapolis has the lowest percent of residents who are interested in college basketball (26.3%), but that's still a relative four percent higher than the U.S. as a whole. Although interest should be very high this year, Richmond and Indianapolis (15.8% each) have the lowest percentage of adults who watched last year's tournament. Cinderella Team Market Snapshots Richmond, VA Home market of: Richmond Spiders, VCU Rams Sweet 16 opponents: Kansas, Florida State The top two segments in Richmond representing 30% of the market's households are: Metro Minority Communities (18.1%) comprised of married couples and single-parent minorities earning above average incomes from a mix of service industry and white-collar jobs in transportation, health care, education, and public administration. Urban Commuter Families (11.5%) comprised of upscale, college educated Baby Boomer families and couples living in single detached homes in city neighborhoods on the metropolitan fringe. Other interesting facts: Most over-represented segment is Metro Minority Communities (3.8 times the national average) Percent of adults with interest in college basketball is 26.7% Percent of adults who watched last year's men's college basketball tournament is 15.8% Tallahassee, FL Home market of: Florida State Seminoles Sweet 16 opponent: VCU Rams Similar to Richmond, the top two segments in Tallahassee are Metro Minority Communities (14.8%) and Urban Commuter Families (6.9%). The two segments that account for the next highest share of households are: Struggling City Centers (6.7%) comprised of young, single and single-parent minority renters living in low-income city neighborhoods. Rural Southern Living (6.5%) comprised of lower-income blue-collar couples and families living in sparsely settled mobile home communities. Other interesting facts: Most over-represented market segment is College Town Communities (6.2 times the national average) Percent of adults with interest in college basketball is 26.9% Percent of adults who watched last year's men's college basketball tournament is 16.8% Milwaukee, WI Home market of: Marquette Golden Eagles Sweet 16 opponent: North Carolina Tarheels The top segment in Milwaukee representing 11.2% of households is Urban Commuter Families (as described above). The two segments that account for the next highest share of households are: Small-town Success (10.5%) comprised of white collar, college educated, middle-aged working couples living in newly developed subdivisions outside the nation's beltways. Steadfast Conservative (9.3%) comprised of high-school educated mature singles and couples living in middle-class urban blue-collar neighborhoods. Other interesting facts: Most over-represented market segment is Successful Suburbia (3.6 times the national average) Percent of adults with interest in college basketball is 28.1% Percent of adults who watched last year's men's college basketball tournament is 17.3% Indianapolis, IN Home market of: Butler Bulldogs Sweet 16 opponent: Wisconsin Badgers There are four equal size segments that account for just over 30% of Indianapolis households. These include Steadfast Conservative (8.9%), Urban Commuter Families (7.8%), and Small-town Success (7.1%). All three of these segments are also among the top five in Richmond, Tallahassee, and Milwaukee. What makes Indianapolis unique from the other three markets is a higher percentage of New Suburbia Families (7.2%). These are young, affluent working couples with pre-school children concentrated in fast-growing, metro fringe communities. Other interesting facts: Most over-represented market segment is Successful Suburbia (2.8 times the national average) Percent of adults with interest in college basketball is 26.3% Percent of adults who watched last year's men's college basketball tournament is 15.8%

Mar 23,2011 by

Catching Office Online NCAA Tournament Streamers in the Act

Tournament play begins this week in the 2011 NCAA Men's Division I Basketball Tournament, which means office productivity is likely to take a hit as fans jump online to watch live streams of games being played during working hours. With online viewing options expanded to mobile and other digital platforms this year, fans have more avenues than ever to get their March Madness fix. In fact, according to a recent estimate by Challenger, Gray & Christmas, total online tournament viewership during work hours is likely to reach 8.4 million hours during this year's tournament. In this latest installment of Experian Marketing Services' continuing March Madness consumer coverage, we'll profile the work life of online game streamers. Is there one down the hall or in the next cube? The answer is almost certainly “yes,” but the “who” may surprise you.  According to Experian Simmons, just over 5% of all U.S. adults and nearly a quarter of adult NCAA men's tournament viewers (24%) qualify as likely online game streamers. For the purpose of this analysis, likely online game streamers is defined as those U.S. adults who watched the last NCAA men's basketball tournament who also sought out sports information online or watched online video in the last 30 days. These likely online game streamers must have also visited either cbssports.com or espn.com in the last 30 days. Fully 79% of likely online game streamers are employed either full-or or part-time, with 59% working 40 or more hours a week. Department managers and IT staff-have reason to be concerned about a loss in productivity during March Madness: fully 79% of likely online game streamers are employed either full-or or part-time, with 59% working 40 or more hours a week. Don't be so quick to suspect that colleague who always shows up late and goes home early as a game streamer. A safer bet would be the guy who's always at his desk when you get in and still there when you head out. In fact, one-in-ten adults who work more than 40 hours a week (11%) are likely online game streamers, meaning they're more than twice as likely as the average adult to be checking out the game online. Remote employees who work at home often get a bad rap with office “suits” sometimes assuming their pajama-clad colleagues fall prey to distractions. Actually though, Americans who work from home are no more or less likely to be likely online streamers than those who don't work from home. Likewise, the self-employed are no more or less likely to be online game streamers than laborers who work for “the man.” Interestingly, Experian Simmons found a direct correlation between company size and a worker's chance of being a likely online game streamer. Specifically: Those who work in companies with fewer than 100 employees are 17% less likely than the average American worker to be likely online game streamers. Those who work in companies with between 100 and 499 employees are just two percent less likely than average to be likely streamers while those employed by companies with between 500 and 999 employees are eight percent more likely to be online game streamers. Employees of companies with 1,000 or more employees are the most likely culprits with the group on average being 17% more likely to be likely online game streamers. As such, it's no surprise that Fortune 500 companies are the most at risk of having offices full of online streamers during March Madness. Employees of Fortune 500 companies are fully 66% more likely to be online game streamers than those who Americans employed by a non-Fortune 500 company. Finally, the best insight into whether your office mates are streaming basketball games online instead of working is by looking at their paycheck (not that we encourage that of course). Specifically, as income rises, so does one's chance of being an online game streamer: Employed Americans who personally earn less than $25,000 annually are the least likely to be online game streamers, scoring 50% below average on this metric. Those who earn between $25,000 and $49,999 are only 15% less likely to be game streamers. If you know or suspect that your colleague earns upwards of $50,000 a year, it's a good idea to keep an eye on them for the rest of the month; workers with incomes between $50,000 and $74,999 are 33% more likely than average to be likely game streamers and those who earn between $75,000 and $99,999 are 75% more likely to be likely game streamers. Your colleagues earning $100,000 or more annually are the most likely to be streaming online, with those personally taking home between $100,000 and $149,000 being a whopping 164% more likely than the average employee to be streaming games online. And those earning $150,000 or more annually being fully 176% more likely to be online game streamers. Moreover, one-in-five adults who earn $150,000 a year or more fall into our likely online game streamers segment compared with just 5% of all U.S. adults. The first match-up to be played during the traditional workday tips off at 12:15 EDT on Thursday March 17th when West Virginia takes on the winner of the second round-one play-in game. Armed with this information, you should be able to catch-or join-your office's online game streamers in the act.

Mar 17,2011 by

Subscribe to our newsletter

Enter your name and email for the latest updates

This site is protected by reCAPTCHA and the Google Privacy Policy and Terms of Service apply.

About Experian Marketing Services

At Experian Marketing Services, we use data and insights to help brands have more meaningful interactions with people. As leaders in the evolution of the advertising landscape, Experian Marketing Services can help you identify your customers and the right potential customers, uncover the most appropriate communication channels, develop messages that resonate, and measure the effectiveness of marketing activities and campaigns.

Visit our website

Subscribe to our newsletter

Stay up to date on the latest industry news and receive expert tips from our marketing experts.
Subscribe now!