In our Ask the Expert Series, we interview leaders from our partner organizations who are helping lead their brands to new heights in AdTech. Today’s interview is with Ben Smith, VP of Product, Data Products at Infillion.
Adapting to signal loss
What does the Experian–Infillion integration mean for advertisers looking to reach audiences as signals fade?

As cookies and mobile identifiers disappear, brands need a new way to find and reach their audiences. The Experian integration strengthens Infillion’s XGraph, a cookieless, interoperable identity graph that supports all major ID frameworks, unifying people and households across devices with privacy compliance, by providing a stronger identity foundation with household- and person-level data. This allows us to connect the dots deterministically and compliantly across devices and channels, including connected TV (CTV). The result is better match rates on your first-party data, more scalable reach in cookieless environments, and more effective frequency management across every screen.
Connecting audiences across channels
How does Experian’s Digital Graph strengthen Infillion’s ability to deliver addressable media across channels like CTV and mobile?
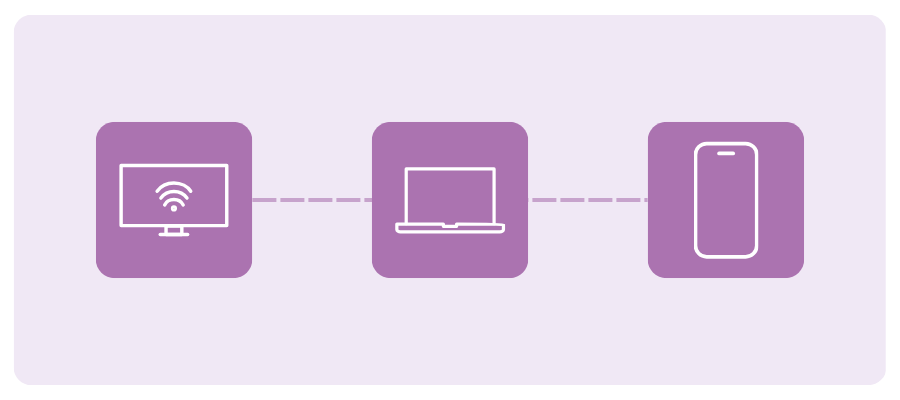
Experian strengthens the household spine of XGraph, which means we can accurately connect CTV impressions to the people and devices in that home – then extend those connections to mobile and web. This lets us plan, activate, and measure campaigns at the right level: household for CTV, and person or device for mobile and web. The outcome is smarter reach, less waste from over-frequency, and campaigns that truly work together across channels.
The value of earned attention
Infillion has long championed “guaranteed attention” in advertising. How does that philosophy translate into measurable outcomes for brands?
Our engagement formats, such as TrueX, are based on a simple principle: attention should be earned, not forced. Viewers choose to engage with the ad and complete an action, which means every impression represents real, voluntary attention rather than passive exposure. Because of that, we consistently see stronger completion rates, deeper engagement, and clearer downstream results – like lower acquisition costs, improved on-site behavior, and measurable brand lift.
To take that a step further, we measure attention through UpLift, our real-time brand lift tool. UpLift helps quantify how exposure to a campaign influences awareness, consideration, or purchase intent, providing a more complete picture of how earned attention translates into business impact.
Creative innovation and location insights
Beyond identity resolution, what are some of Infillion’s capabilities, like advanced creative formats or location-based insights, that set you apart in the market?
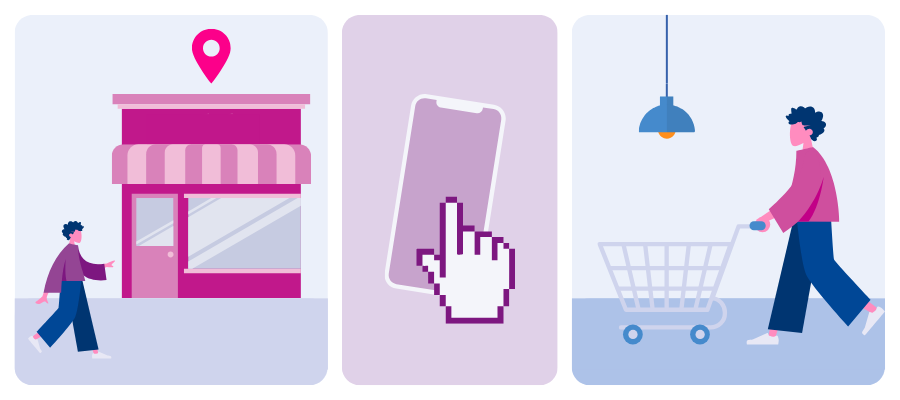
One key area is location intelligence, which combines privacy-safe geospatial insights with location-based targeting through our proprietary geofencing technology. This allows us to build custom, data-driven campaigns that connect media exposure to real-world outcomes – like store visits and dwell time – measured through Arrival, our in-house footfall attribution product.
We also build custom audiences using a mix of zero-party survey data, first-party location-based segments, and bespoke audience builds aligned to each advertiser’s specific strategy.
Then there’s creative innovation, which is a major differentiator for us. Our high-impact formats go beyond static display, such as interactive video units that let viewers explore products through hotspots or carousels, rich-media ads that feature polls, quizzes, dynamic distance, or gamified elements, and immersive experiences that encourage active participation rather than passive viewing. These creative formats not only capture attention but also generate deeper engagement and stronger performance for a variety of KPIs.
Future ready media strategies
How does Infillion’s ID-agnostic approach help brands future-proof their media strategies amid ongoing privacy and tech changes?
We don’t put all our eggs in one basket. XGraph securely unifies multiple durable identifiers alongside our proprietary TrueX supply to strengthen CTV household reach. This agnostic design allows us to adapt as platforms, regulations, and browsers evolve – so you can preserve reach and measurement capabilities without getting locked into a single ID or losing coverage when the next signal deprecates.
Raising the bar for media accountability
Looking ahead, how is Infillion evolving its platform to meet the next wave of challenges in audience engagement and media accountability?
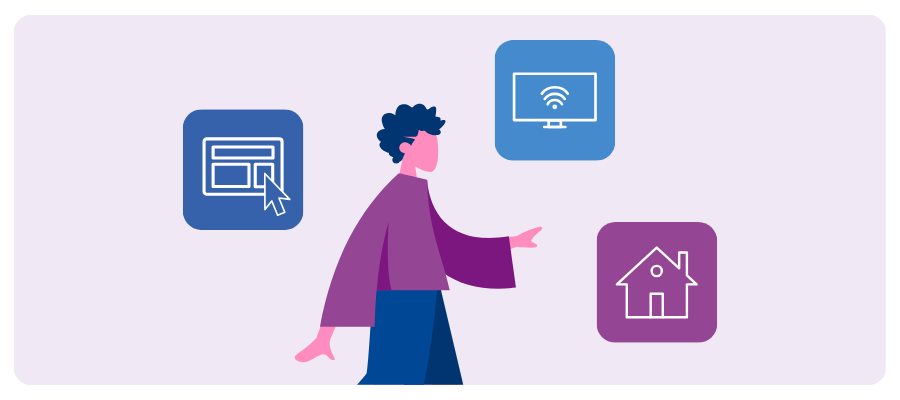
From an engagement standpoint, we’re expanding our ability to support the full customer journey, offering ad experiences that move seamlessly from awareness to consideration to conversion. That includes smarter creative that adapts to context, intelligent targeting and retargeting informed by real data, and formats designed to drive measurable outcomes rather than just impressions.
When it comes to accountability, we’re ensuring that measurement is both flexible and credible. In addition to our proprietary tools, we partner with leading third-party measurement providers to validate results and give advertisers confidence that their investment is truly performing. Within our DSP, we emphasize full transparency and log-level data access, ensuring advertisers can see exactly what’s happening on every impression.
All of this builds toward the next era of agentic media buying – one enabled by our MCP suite and modular, component-based tools. This evolution brings greater accountability and next-generation audience engagement to an increasingly automated, intelligent media landscape. Our goal is to help brands connect more meaningfully with audiences while holding every impression – and every outcome – to a higher standard of transparency and effectiveness.
Driving impact across the funnel
What is a success story or use cases that demonstrate the impact of the Experian–Infillion integration?
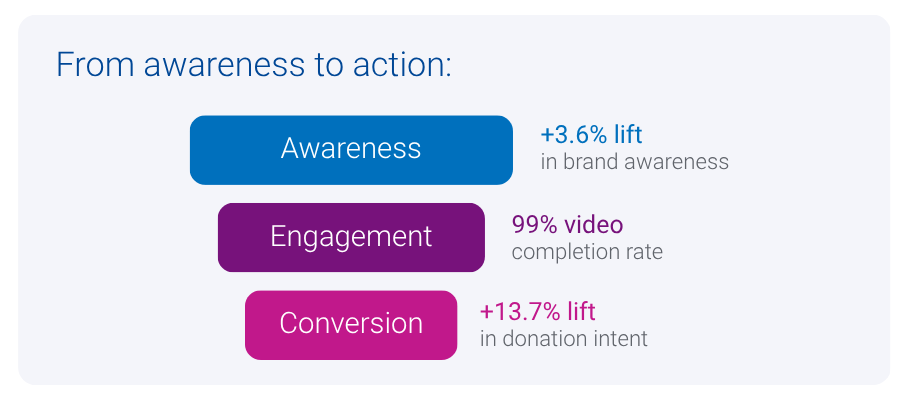
We recently partnered with a national veterans’ organization to raise awareness of its programs for injured or ill veterans and their families. Using the Experian integration, we combined persistent household- and person-level identifiers with cross-device activation to reach veteran and donor audiences more precisely across CTV, display, and rich media. The campaign achieved standout results – industry-leading engagement rates, a 99% video completion rate, and measurable lifts in both brand awareness (3.6 % increase) and donation consideration (13.7% lift). It’s a clear example of how stronger identity and smarter activation can drive meaningful outcomes across the full funnel.
Contact us
Identity resolution FAQs
Identity resolution ensures accurate connections between devices, households, and individuals. Experian’s Offline Identity Resolution and Digital Graph strengthen these connections for improved targeting and consistent measurement across CTV, mobile, and web.
Solutions like Experian’s Digital Graph enable brands to connect first-party data to household and person-level identifiers, ensuring scalable reach and compliant audience targeting legacy signals fade.
Focusing on earned attention (where audiences actively choose to engage) leads to stronger completion rates, improves on-site behavior, and drives measurable increases in brand awareness and consideration.
By linking CTV impressions to households and extending those connections to mobile and web, Experian’s identity solutions ensure campaigns work together seamlessly, reducing over-frequency and improving overall reach.
About our expert

Ben Smith
VP Product, Data Products, Infillion
Ben Smith leads Infillion’s Data Products organization, delivering identity, audience, and measurement solutions across the platform. Previously, he was CEO and co-founder of Fysical, a location intelligence startup acquired by Infillion in 2019.
About Infillion
Infillion is the first fully composable advertising platform, built to solve the challenges of complexity, fragmentation, and opacity in the digital media ecosystem. With MediaMath at its core, Infillion’s modular approach enables advertisers to seamlessly integrate or independently deploy key components—including demand, data, creative, and supply. This flexibility allows brands, agencies, commerce and retail media networks, and resellers to create tailored, high-performance solutions without the constraints of traditional, all-or-nothing legacy systems.
Latest posts

New data from Experian Marketing Services’ Simmons® ConnectSM mobile and digital panel sheds light on the way smartphone users spend time using their phone, with the average adult clocking 58 minutes daily on their device. On average, smartphone owners devote 26% of the time they spend on their phone talking and another 20% texting. Social networking eats up 16% of smartphone time while browsing the mobile web accounts for 14% of time spent. Emailing and playing games account for roughly 9% and 8% of daily smartphone time, respectively, while use of the phone’s camera and GPS each take up another 2% of our smartphone day. *Activities include use of a smartphone’s native features dedicated to each activity as well as downloaded apps whose primary function falls under the given activity. For instance, “watch video” includes the act of watching video on the smartphone’s native video player as well as use of video apps such as YouTube, Netflix, etc. iPhone versus Android users Smartphone users may constantly debate which operating system is supreme, but we see clear differences between the ways consumers use their phone depending on the operating system that runs it. For starters, iPhone users spend an hour and fifteen minutes using their phones per day, a full 26 minutes more than the typical Android phone owner. Additionally, iPhone and Android smartphone owners use their phones in markedly different ways. For instance, 28% of the time that Android users spend using their phones is dedicated to talking, whereas iPhone users spend only 22% of their smartphone time talking on the device. Android owners also devote a greater share of time visiting websites on their phone than iPhone owners. On the other hand, iPhone owners spend a disproportionately greater share of smartphone time than Android owners texting, emailing, using the camera and social networking. Note on time spent It may surprise some to read that an activity like watching video accounts for such a small share (less than 1%) of the typical adult’s daily smartphone use. However, for the charts above to sum to a single daily total it was necessary to calculate individual activity contribution using a base of all smartphone owners, including those who don’t spend any time engaging in a given activity during a typical day. The chart below provides additional insights into the time spent engaging in the major smartphone activities examining only those individuals who engaged in each activity during a 24-hour period. I’ve also added into the chart a reach and frequency metric to indicate the popularity of each activity and the number of times per day that individuals engage in them. In the chart, the activities with the largest bubbles are those in which the greatest share of smartphone owners engage during a typical day and include the usual suspects: talking (79%), texting (76%), visiting websites (62%), emailing (61%) and social networking (52%). Activities with the fewest daily participants are: watching video, which 2.3% of smartphone owners do during a typical day, and reading, which just 0.5% of smartphone owners do daily. Given that nearly 98% of smartphone users don’t watch videos on their phone during a typical day, it’s easier to understand why video comprises such a low share of the average adult’s daily smartphone use. However, the chart above reveals that those who do watch video on their phone spend, on average, 5 minutes a day watching videos spread out over 4.2 different viewing sessions. For more information on consumers’ usage of smartphones, digital tablets, computers and other traditional and digital media platforms, check out Simmons Connect.
New health information exchanges are prompting data quality efforts, as state and local healthcare agencies look to electronically share patient data.
If the time spent on the Internet for personal computers was distilled into an hour then 27 percent of it would be spent on social networking and forums across the United States, United Kingdom and Australia. In the U.S., 16 minutes out of every hour online is spent on social networking and forums, nine minutes on entertainment sites and five minutes shopping. Global comparison In the UK, 13 minutes out of every hour online is spent on social networking and forums, nine minutes on entertainment sites and six minutes shopping. Australian Internet users spend 14 minutes on social sites, nine on entertainment and four minutes shopping online. Across all three markets, time spent shopping online grew year-over-year, but the UK market emerged as having the most prolific online shoppers, spending proportionally more time on retail Websites than online users in the U.S. or Australia. British Internet users spent 10 percent of all time online shopping in 2012, compared to nine percent in the U.S. and six percent in Australia. This was in part due to a bumper winter holiday season in the UK where 370 million hours were spent shopping online, 24 percent higher than the monthly average. Consumption of news content also increased across all three markets with Australian users emerging as the most voracious consumers of news online. Six percent of all time spent online in Australia in 2012 was on a news Website, compared to five percent in the UK and four percent in the U.S. Meanwhile, the time spent on social media proportionate to other online activities declined across all three regions. The U.S., which has been the most dominant market for social media consumption in the last three years dropped from 30 percent of all time spent online to 27 percent. In Australia time spent on social dropped from 27 percent to 24 percent while in the UK it dipped from 25 percent to 22 percent year-over-year. This highlights the rise in access via 3G and 4G networks as consumers spend increasingly more time online while on the move. "Understanding consumer behavior across channels is more important than ever as more visits are being made on the move, particularly among social networking and email,” says Bill Tancer, general manager of global research for Experian Marketing Services. "With smartphones and tablets becoming more powerful, our data clearly indicates the difference between mobile and traditional desktop usage further enabling the ‘always on’ consumer mentality. Marketers need to understand these differences, as well as regionally, to ensure campaigns can be tailored for better and more effective engagement.” Mobile browsing When looking at the U.S. browsing data for mobile devices, email accounted for the largest time spent on average, for the same categories for Q1 2013. Email made up 23 percent of time spent on mobile devices for Q1-13, while social networking accounted for 15 percent. Entertainment had the third highest time spent with 13 percent, followed by shopping with 11 percent and travel with 9 percent. The mobile data does not include app usage, but does include mobile browsing within an app. Read more of the latest consumer trends in The 2013 Digital Marketer Report Learn more about consumer online behavior by visiting our Online Trends page Learn more about the author, Matt Tatham