In our Ask the Expert Series, we interview leaders from our partner organizations who are helping lead their brands to new heights in AdTech. Today’s interview is with Ben Smith, VP of Product, Data Products at Infillion.
Adapting to signal loss
What does the Experian–Infillion integration mean for advertisers looking to reach audiences as signals fade?

As cookies and mobile identifiers disappear, brands need a new way to find and reach their audiences. The Experian integration strengthens Infillion’s XGraph, a cookieless, interoperable identity graph that supports all major ID frameworks, unifying people and households across devices with privacy compliance, by providing a stronger identity foundation with household- and person-level data. This allows us to connect the dots deterministically and compliantly across devices and channels, including connected TV (CTV). The result is better match rates on your first-party data, more scalable reach in cookieless environments, and more effective frequency management across every screen.
Connecting audiences across channels
How does Experian’s Digital Graph strengthen Infillion’s ability to deliver addressable media across channels like CTV and mobile?

Experian strengthens the household spine of XGraph, which means we can accurately connect CTV impressions to the people and devices in that home – then extend those connections to mobile and web. This lets us plan, activate, and measure campaigns at the right level: household for CTV, and person or device for mobile and web. The outcome is smarter reach, less waste from over-frequency, and campaigns that truly work together across channels.
The value of earned attention
Infillion has long championed “guaranteed attention” in advertising. How does that philosophy translate into measurable outcomes for brands?

Our engagement formats, such as TrueX, are based on a simple principle: attention should be earned, not forced. Viewers choose to engage with the ad and complete an action, which means every impression represents real, voluntary attention rather than passive exposure. Because of that, we consistently see stronger completion rates, deeper engagement, and clearer downstream results – like lower acquisition costs, improved on-site behavior, and measurable brand lift.
To take that a step further, we measure attention through UpLift, our real-time brand lift tool. UpLift helps quantify how exposure to a campaign influences awareness, consideration, or purchase intent, providing a more complete picture of how earned attention translates into business impact.
Creative innovation and location insights
Beyond identity resolution, what are some of Infillion’s capabilities, like advanced creative formats or location-based insights, that set you apart in the market?

One key area is location intelligence, which combines privacy-safe geospatial insights with location-based targeting through our proprietary geofencing technology. This allows us to build custom, data-driven campaigns that connect media exposure to real-world outcomes – like store visits and dwell time – measured through Arrival, our in-house footfall attribution product.
We also build custom audiences using a mix of zero-party survey data, first-party location-based segments, and bespoke audience builds aligned to each advertiser’s specific strategy.
Then there’s creative innovation, which is a major differentiator for us. Our high-impact formats go beyond static display, such as interactive video units that let viewers explore products through hotspots or carousels, rich-media ads that feature polls, quizzes, dynamic distance, or gamified elements, and immersive experiences that encourage active participation rather than passive viewing. These creative formats not only capture attention but also generate deeper engagement and stronger performance for a variety of KPIs.
Future ready media strategies
How does Infillion’s ID-agnostic approach help brands future-proof their media strategies amid ongoing privacy and tech changes?

We don’t put all our eggs in one basket. XGraph securely unifies multiple durable identifiers alongside our proprietary TrueX supply to strengthen CTV household reach. This agnostic design allows us to adapt as platforms, regulations, and browsers evolve – so you can preserve reach and measurement capabilities without getting locked into a single ID or losing coverage when the next signal deprecates.
Raising the bar for media accountability
Looking ahead, how is Infillion evolving its platform to meet the next wave of challenges in audience engagement and media accountability?
From an engagement standpoint, we’re expanding our ability to support the full customer journey, offering ad experiences that move seamlessly from awareness to consideration to conversion. That includes smarter creative that adapts to context, intelligent targeting and retargeting informed by real data, and formats designed to drive measurable outcomes rather than just impressions.
When it comes to accountability, we’re ensuring that measurement is both flexible and credible. In addition to our proprietary tools, we partner with leading third-party measurement providers to validate results and give advertisers confidence that their investment is truly performing. Within our DSP, we emphasize full transparency and log-level data access, ensuring advertisers can see exactly what’s happening on every impression.
All of this builds toward the next era of agentic media buying – one enabled by our MCP suite and modular, component-based tools. This evolution brings greater accountability and next-generation audience engagement to an increasingly automated, intelligent media landscape. Our goal is to help brands connect more meaningfully with audiences while holding every impression – and every outcome – to a higher standard of transparency and effectiveness.
Driving impact across the funnel
What is a success story or use cases that demonstrate the impact of the Experian–Infillion integration?
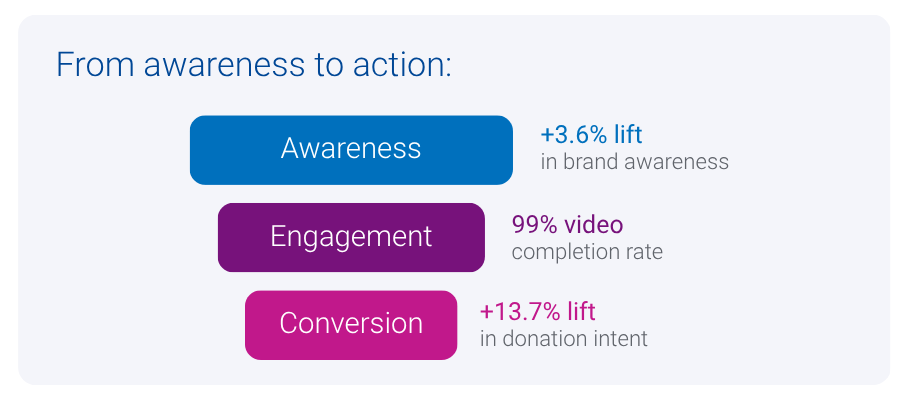
We recently partnered with a national veterans’ organization to raise awareness of its programs for injured or ill veterans and their families. Using the Experian integration, we combined persistent household- and person-level identifiers with cross-device activation to reach veteran and donor audiences more precisely across CTV, display, and rich media. The campaign achieved standout results – industry-leading engagement rates, a 99% video completion rate, and measurable lifts in both brand awareness (3.6 % increase) and donation consideration (13.7% lift). It’s a clear example of how stronger identity and smarter activation can drive meaningful outcomes across the full funnel.
Contact us
Identity resolution FAQs
Identity resolution ensures accurate connections between devices, households, and individuals. Experian’s Offline Identity Resolution and Digital Graph strengthen these connections for improved targeting and consistent measurement across CTV, mobile, and web.
Solutions like Experian’s Digital Graph enable brands to connect first-party data to household and person-level identifiers, ensuring scalable reach and compliant audience targeting legacy signals fade.
Focusing on earned attention (where audiences actively choose to engage) leads to stronger completion rates, improves on-site behavior, and drives measurable increases in brand awareness and consideration.
By linking CTV impressions to households and extending those connections to mobile and web, Experian’s identity solutions ensure campaigns work together seamlessly, reducing over-frequency and improving overall reach.
About our expert

Ben Smith
VP Product, Data Products, Infillion
Ben Smith leads Infillion’s Data Products organization, delivering identity, audience, and measurement solutions across the platform. Previously, he was CEO and co-founder of Fysical, a location intelligence startup acquired by Infillion in 2019.
About Infillion
Infillion is the first fully composable advertising platform, built to solve the challenges of complexity, fragmentation, and opacity in the digital media ecosystem. With MediaMath at its core, Infillion’s modular approach enables advertisers to seamlessly integrate or independently deploy key components—including demand, data, creative, and supply. This flexibility allows brands, agencies, commerce and retail media networks, and resellers to create tailored, high-performance solutions without the constraints of traditional, all-or-nothing legacy systems.
Latest posts

As we ring in the New Year this week, Americans will be tossing back a few adult beverages in celebration. While alcohol consumption certainly increases around holidays and other times of celebration, many Americans imbibe year-round. So where across this great land of ours are you most likely to find adults willing and able to raise a glass (or two) and where are you most likely to be surrounded by teetotalers? Experian Simmons has the answer. Leveraging data from our SimmonsLOCAL study, we examined the drinking patterns of adults of legal drinking age in the 106 Designated Market Areas (DMAs) with populations of at least 500,000 adults age 21 and older. We then ranked those markets by the number of alcoholic beverages consumed by the average adult during a typical month. The chart below lists the DMAs that consume the most alcoholic beverages per capita in a typical month. First place goes to Boston, where the average adult of legal drinking age regularly kicks back 14.4 drinks a month. (Celebrations in Beantown are probably already underway.) Rank DMA Average drinks per month 1 Boston 14.4 2 Austin 13.8 3 Providence-New Bedford 13.4 4 Madison 13.2 4 Hartford & New Haven 13.2 6 Philadelphia 13.1 7 Chicago 13 8 Denver 12.9 9 Tallahassee-Thomasville 12.8 9 Milwaukee 12.8 11 Minneapolis-St. Paul 12.6 11 West Palm Beach-Ft. Pierce 12.6 11 Seattle-Tacoma 12.6 11 Tucson (Sierra Vista) 12.6 15 Green Bay-Appleton 12.5 16 San Diego 12.4 16 Baltimore 12.4 16 Washington, DC 12.4 16 Albany-Schenectady-Troy 12.4 20 New Orleans 12.3 20 St. Louis 12.3 20 Colorado Springs-Pueblo 12.3 23 Burlington-Plattsburgh 12.2 23 Syracuse 12.2 23 Norfolk-Portsmouth-Newport News 12.2 23 Spokane 12.2 23 Portland-Auburn 12.2 Source: Experian Simmons Adult residents of the markets listed below surely know how to have a good time-it's just unlikely to include a cocktail. The chart below lists the DMAs that consume the fewest alcoholic beverages per capita in a typical month. Residents of Chattanooga consume only 6 alcoholic beverages per month, on average, making it the least imbibing market-and probably the one that feels the best the morning after a big gathering. Rank DMA Average drinks per month 106 Chattanooga 6 105 Salt Lake City 7.2 105 Florence-Myrtle Beach 7.2 105 Charleston-Huntington 7.2 105 Tri-Cities, TN-VA 7.2 101 Knoxville 7.4 100 Lexington 7.9 99 Birmingham 8 98 Huntsville-Decatur 8.5 97 Nashville 8.9 97 Evansville 8.9 95 Paducah-Cape Girardeau-Harrisburg-Mt Vernon 9.1 94 Springfield, MO 9.2 94 Tulsa 9.2 94 Greenville-New Bern-Washington 9.2 91 Memphis 9.3 90 Greenville-Spartanburg-Asheville-Anderson 9.4 90 Jackson, MS 9.4 90 Wichita-Hutchinson Plus 9.4 86 Little Rock-Pine Bluff 9.5 86 Louisville 9.5 86 Ft. Smith-Fayetteville-Springdale-Rogers 9.5 83 Fresno-Visalia 9.6 82 Greensboro-High Point-Winston Salem 9.7 82 Roanoke-Lynchburg 9.7 Source: Experian Simmons For more information on SimmonsLOCAL's vivid reporting of consumer behaviors, attitudes, lifestyles and media consumption in 209 Designated Market Areas down to the ZIP code level, visit our website.
Registered Republicans and Democrats have different TV program preferences. But a majority of highly rated Nielsen programs seem to clearly skew Republican. Which TV programs does each group prefer, and what are the common threads among the two groups?
Discount stores appear to be weathering the recession better than some of their full-price counterparts, as they carry first-quality designer merchandise at competitive prices.