
This holiday shopping season, marketers will look to take advantage of the surge in spending across channels like connected TV (CTV), programmatic, and mobile. Despite challenges such as privacy regulations and Google’s new cookie deprecation plan, this moment presents a unique opportunity for marketers to reshape their traditional approaches to consumer engagement and capitalize on these changes.
As we approach the holiday season, understanding how consumers spend, where they shop, and how their shopping habits are changing are key components to consider when crafting your holiday advertising campaigns. Our 2024 Holiday spending trends and insights report utilizes our expertise in data and insights to highlight emerging consumer behaviors and spending patterns. In our report, we share what these trends mean for marketers and how Experian can help, so you can refine your messaging and target the right audience through the best channels.
In this blog post, we cover three insights from our report. Watch our video for a recap below.
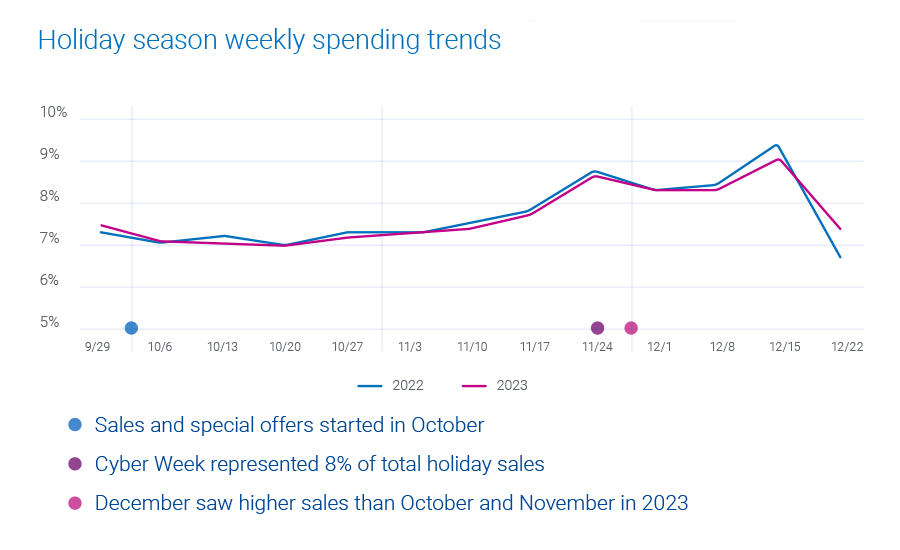
1. Consumers are shopping evenly throughout the holiday season
35% of holiday shopping was done in December, peaking at 9% of total holiday sales the week before Christmas. Cyber Week, the five-day period between Thanksgiving and Cyber Monday, and the week before Christmas brought the highest weekly sales for the past two holiday seasons.
What this means for marketers
Prepare for an extended promotional period. Schedule your marketing campaigns and sales initiatives to maximize impact during the extended season, focusing on the peaks of Cyber Week and the week before Christmas.
How Experian can help you target these shoppers
Experian’s data, ranked #1 in accuracy by Truthset, offers advertisers the ability to reach people based on demographic, geographic, and behavioral attributes (e.g. websites visited and purchase history). Our audiences are available on-the-shelf of most major platforms, making it easy for you to activate and target holiday shoppers.
We recently released 19 new holiday-focused audience segments. Here are a few you can activate:
- Black Friday Shoppers
- Cyber Monday Shoppers
- Big Box/Club Store Shoppers
- Luxury Gift Shoppers
- Discount Holiday Shoppers
- Holiday Airline Travel
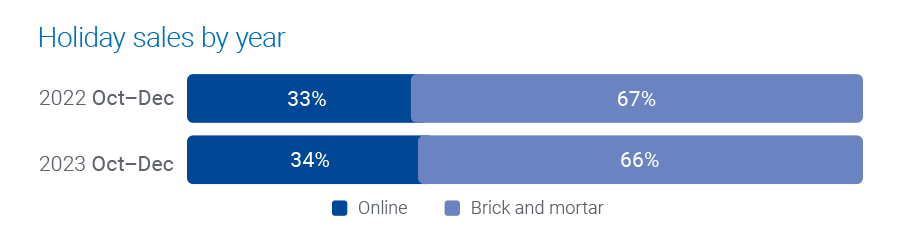
2. Online shopping is leveling out
Online holiday spending continues to remain around a third of all holiday shopping spending.
We are starting to see online shopping slow and level out – people are going back in-store. The high amount of online shopping we saw during the pandemic is starting to return to pre-pandemic behaviors.
Consumers are spending more in-store at department and discount stores but are shopping online for office/electronics/games, mass retailers, and apparel.
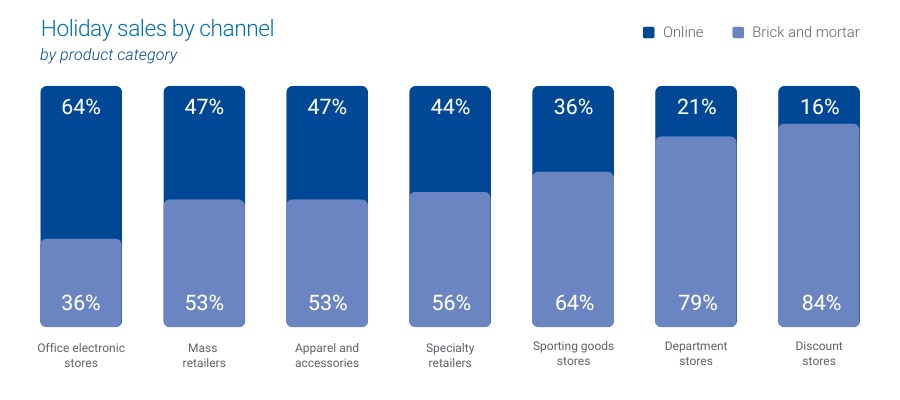
- 84% of holiday shopping was done in-store for discount stores.
- 79% of holiday shopping was done in-store for department stores.
- 64% of holiday shopping was done online for office, electronics, and games stores.
What this means for marketers
Digital and physical experiences work together. Retailers should have a multi-channel plan to reach consumers, tailoring their approach to their target audience and product and creating engaging in-store experiences to drive visitors.
How Experian can help you target and measure across channels
We connect online and offline data to enable precise targeting and measurement of marketing efforts across multiple channels. Read our case study with Cuebiq to learn how they used our Activity Feed solution to deliver in-store lift analyses to their clients.
3. CTV is the top channel to reach consumers
Over two-thirds of the U.S. population now use CTV, and the average time spent among adults is expected to surpass two hours per day in 2024. CTV offers a creative ad experience similar to its linear counterpart but provides more sophisticated targeting and analytics capabilities.
What this means for marketers
As CTV viewing continues to dominate, the importance of cross-device targeting and measurement increases.
How Experian can help you reach shoppers across devices
Later this year, we’ll add support for IPv6 in our Digital Graph as well as phone-based UID2s. This is in addition to our current coverage of IPv4 and email-based UID2s. As a result, all IP signals and UID2s will be resolved back to Experian’s household and individual profiles and their associated devices, which means marketers and platforms can better understand the full customer journey and reach people across their devices.
Download our 2024 Holiday spending trends and insights report
This holiday season is about more than just transactions – it’s about cultivating meaningful connections with your audience. Download our 2024 Holiday spending trends and insights report to access all of our predictions for this year’s holiday season.
When you work with Experian for your holiday shopping campaigns, you’re getting:
- Accurate consumer insights: Better understand your customers’ behavioral and demographic attributes with our #1 ranked data covering the full U.S. population.
- Signal-agnostic identity solutions: Our deep understanding of people in the offline and digital worlds provides you a persistent linkage of personally identifiable information (PII) data and digital IDs, ensuring you accurate cross-device targeting, addressability and measurement.
- Secure connectivity: Bring data and identity to life in a way that meets your needs by securely sharing data between partners, utilizing the integrations we have across the ecosystem, and using our marketing data in flexible ways.
Make the most of this holiday shopping season with Experian. Contact us today to get started.
Latest posts

With the busy holiday marketing season in full swing, Experian Marketing Services has released its online retail round-up for the week ending Dec. 8.
Twenty years ago this week, the first mobile text message, or SMS, was sent by British engineer Neil Papworth. Today, Americans are texting more than ever and among young adults, many of whom were not yet born when the first message was sent, texting is almost as common a mobile activity as talking. And why wouldn’t it be? According to the latest Simmons National Consumer Study, 48% of adults ages 18-to-24 say that a conversation via text message is just as meaningful as a telephone call. A similar share of adults ages 25-to-34 feel the same way. Regardless of age, texting is still, technically, the second most common activity that Americans engage in on their cell phone after talking. During a typical week, 95% of mobile adults talk on their mobile phone, while 59% text. Among adults ages 18-to-24, however, 89% talk on their phone and 85% text. Despite the increasing availability of mobile chat or instant message applications, texting remains the dominant means for exchanging short messages. Only 8% of all mobile adults use their phone to IM or chat. The fastest thumbs To get a more in-depth understanding of the texting habits of adults today, we leveraged data from the Simmons Connect mobile panel of 1,485 U.S. smartphone owners. Hands down, young adults text more than any age other age group. During a typical month, in fact, smartphone-owners ages 18-to-24 send 2,022 mobile text messages and receive another 1,831 for a combined total of 3,852 texts sent and received. With every age bracket we move up, the number of mobile texts drops by roughly 40%. For instance, smartphone owners ages 25-to-34 send, on average, 1,110 text messages a month and receive another 1,130 for a combined total of 2,240 messages. We are also able to leverage the Simmons Connect smartphone panel to understand mobile calling behaviors. The data shows that while young adults hold the record for the most text messages sent and received, they actually make and receive few calls, by comparison. During a typical month, smartphone owners ages 18-to-24 make 119 calls on their mobile phone and answer another 64 calls. Adults ages 35-to-44 make and receive the most calls on their mobile phones in a given month. (Call counts do not include inbound and outbound calls that go unanswered.) Text around the clock Unlike television and radio, which have peak hours for reaching consumers, mobile text messages reach Americans throughout the day, providing advertisers with a medium to connect with consumers any time they want or need. No surprise, young adults are the most likely to send and receive mobile text messages throughout the day. The smartphone panel data shows that during every hour between 8:00 A.M. and midnight, more than half of young smartphone owners are both sending and receiving mobile text messages. Even when most of us are asleep, young adults’ smartphones continue buzzing from inbound texts. In fact, 37% of 18-to-24 year-old smartphone owners receive texts at 4:00 in the morning. By comparison, just 20% of smartphone-owners ages 25-to-34 years-old receive texts at this late (or early) hour as do 17% of those 35-to-44, 15% of those 45-to-54 and 10% of those ages 55 and older. Better to send or to receive? During overnight hours, the share of young smartphone owners who send texts surpasses the share who receives them. However, by 8:00 A.M., the difference between those two figures narrows to the point that they are nearly equal. In fact, from noon until 11:00 P.M., young adults are more likely to send mobile text messages than they are to receive them. Call or text? While texting is still a secondary use of mobile phones after calling, that’s not the case all day, especially among young adults. In fact, while smartphone owners ages 18-to-24 are more likely to make an outbound call than they are to send a text from their phone between 7:00 A.M. and 10:00 P.M., they are more likely to send a text between 11:00 P.M. and 6:00 A.M., during hours when they might understandably wake the recipient. That should help us all sleep a little better.
Black Friday online traffic increased 7% in 2012 versus 2011 as the top 500 retail sites received more than 193.8 million total US visits. So far this Holiday week of online traffic to the top retail sites is up 10% on average. Online retail traffic was up 1% on Black Friday compared to Thanksgiving Day 2012 traffic this year. Amazon.com remained the top visited retail site on Black Friday while Walmart was the second most visited retail site. BestBuy moved up to the 3rd most visited site while Target was the 4th most visited site. JC Penney moved up from being the 8th most visited retail site on Thanksgiving Day to the 5th most visited on Black Friday. Among the top 5 sites, JC Penney saw the biggest day-over-day growth at 26%. Looking at the top 20 retail sites on Black Friday, the Apple Store site saw the biggest day-over-day growth at 99%. Check back for CyberMonday insight and a weekly recap of this week. Learn more about the author, Matt Tatham