
This holiday shopping season, marketers will look to take advantage of the surge in spending across channels like connected TV (CTV), programmatic, and mobile. Despite challenges such as privacy regulations and Google’s new cookie deprecation plan, this moment presents a unique opportunity for marketers to reshape their traditional approaches to consumer engagement and capitalize on these changes.
As we approach the holiday season, understanding how consumers spend, where they shop, and how their shopping habits are changing are key components to consider when crafting your holiday advertising campaigns. Our 2024 Holiday spending trends and insights report utilizes our expertise in data and insights to highlight emerging consumer behaviors and spending patterns. In our report, we share what these trends mean for marketers and how Experian can help, so you can refine your messaging and target the right audience through the best channels.
In this blog post, we cover three insights from our report. Watch our video for a recap below.
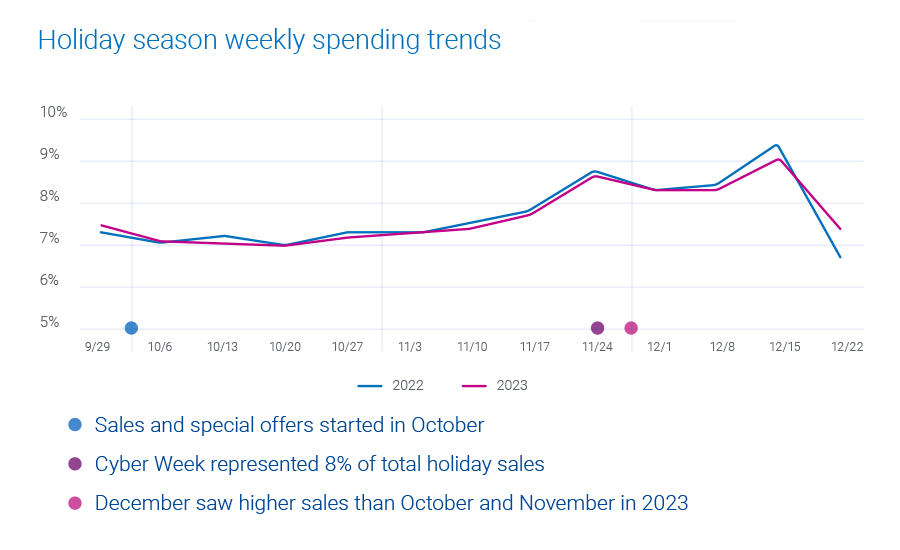
1. Consumers are shopping evenly throughout the holiday season
35% of holiday shopping was done in December, peaking at 9% of total holiday sales the week before Christmas. Cyber Week, the five-day period between Thanksgiving and Cyber Monday, and the week before Christmas brought the highest weekly sales for the past two holiday seasons.
What this means for marketers
Prepare for an extended promotional period. Schedule your marketing campaigns and sales initiatives to maximize impact during the extended season, focusing on the peaks of Cyber Week and the week before Christmas.
How Experian can help you target these shoppers
Experian’s data, ranked #1 in accuracy by Truthset, offers advertisers the ability to reach people based on demographic, geographic, and behavioral attributes (e.g. websites visited and purchase history). Our audiences are available on-the-shelf of most major platforms, making it easy for you to activate and target holiday shoppers.
We recently released 19 new holiday-focused audience segments. Here are a few you can activate:
- Black Friday Shoppers
- Cyber Monday Shoppers
- Big Box/Club Store Shoppers
- Luxury Gift Shoppers
- Discount Holiday Shoppers
- Holiday Airline Travel
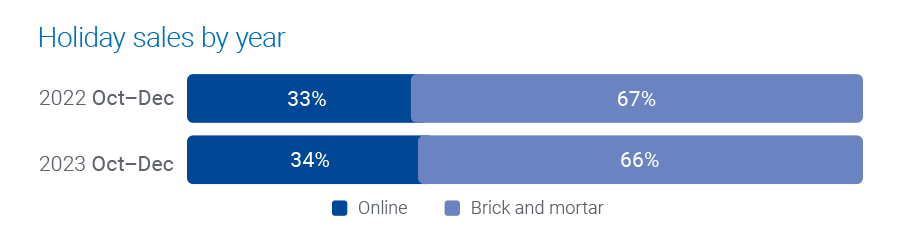
2. Online shopping is leveling out
Online holiday spending continues to remain around a third of all holiday shopping spending.
We are starting to see online shopping slow and level out – people are going back in-store. The high amount of online shopping we saw during the pandemic is starting to return to pre-pandemic behaviors.
Consumers are spending more in-store at department and discount stores but are shopping online for office/electronics/games, mass retailers, and apparel.
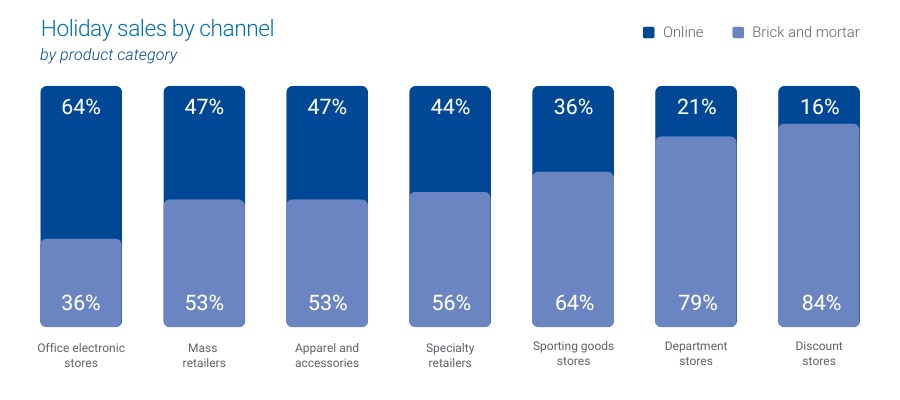
- 84% of holiday shopping was done in-store for discount stores.
- 79% of holiday shopping was done in-store for department stores.
- 64% of holiday shopping was done online for office, electronics, and games stores.
What this means for marketers
Digital and physical experiences work together. Retailers should have a multi-channel plan to reach consumers, tailoring their approach to their target audience and product and creating engaging in-store experiences to drive visitors.
How Experian can help you target and measure across channels
We connect online and offline data to enable precise targeting and measurement of marketing efforts across multiple channels. Read our case study with Cuebiq to learn how they used our Activity Feed solution to deliver in-store lift analyses to their clients.
3. CTV is the top channel to reach consumers
Over two-thirds of the U.S. population now use CTV, and the average time spent among adults is expected to surpass two hours per day in 2024. CTV offers a creative ad experience similar to its linear counterpart but provides more sophisticated targeting and analytics capabilities.
What this means for marketers
As CTV viewing continues to dominate, the importance of cross-device targeting and measurement increases.
How Experian can help you reach shoppers across devices
Later this year, we’ll add support for IPv6 in our Digital Graph as well as phone-based UID2s. This is in addition to our current coverage of IPv4 and email-based UID2s. As a result, all IP signals and UID2s will be resolved back to Experian’s household and individual profiles and their associated devices, which means marketers and platforms can better understand the full customer journey and reach people across their devices.
Download our 2024 Holiday spending trends and insights report
This holiday season is about more than just transactions – it’s about cultivating meaningful connections with your audience. Download our 2024 Holiday spending trends and insights report to access all of our predictions for this year’s holiday season.
When you work with Experian for your holiday shopping campaigns, you’re getting:
- Accurate consumer insights: Better understand your customers’ behavioral and demographic attributes with our #1 ranked data covering the full U.S. population.
- Signal-agnostic identity solutions: Our deep understanding of people in the offline and digital worlds provides you a persistent linkage of personally identifiable information (PII) data and digital IDs, ensuring you accurate cross-device targeting, addressability and measurement.
- Secure connectivity: Bring data and identity to life in a way that meets your needs by securely sharing data between partners, utilizing the integrations we have across the ecosystem, and using our marketing data in flexible ways.
Make the most of this holiday shopping season with Experian. Contact us today to get started.
Latest posts

The Simmons Multi-Media Engagement Study is a unique syndicated research program that measures – across multiple dimensions – the relationship between media vehicles and their audiences. This strategic tool provides measures of the cognitive and emotional engagement consumers have with major media properties, which includes broadcast, cable, and syndicated television, major magazines, and Internet sites. The Fall 2009 release of the Simmons Multi-Media Engagement Study utilizes a patented behavioral integration model to map the engagement levels of nearly 800 media vehicle users back to the respondents in the Experian Simmons National Consumer Study, allowing the analysis of media engagement to be filtered by consumer behaviors including users of over 8,000 brands in over 460 product categories. The following slides will demonstrate some powerful examples leveraging the Spring 2009 MME study. Among all U.S. adults, Consumer Reports magazine is the most Trustworthy media vehicle. In fact, 6 of the top 10 Trustworthy media vehicles are print magazines. The other top vehicles include 3 websites and 1 cable television network. When broken down by gender, there are 4 vehicles that remain consistent across the gender breaks, although their rank orders do change. Among media properties that index at 110 or higher for new car intenders*, we can determine which are best for communicating a message of trust. Below are the top vehicles ranked by the percent of new car intenders saying “I trust this to tell the truth.” When ranking print magazines by Ad Attention/Receptivity – the dimension that measures how likely consumers are to notice and pay attention to ads as well as buy advertised products – we find that the top of the list is dominated by niche publications, whose audiences are focused and whose ads are typically targeted. In a similar vein, those magazines that focus on a mass-market audience tend to have the lowest Ad Attention/Receptivity scores. Looking at the statement, “I get valuable information from the ads in this magazine,” we can see some interesting differences between consumers by region. For instance, while American Baby is tops in 3 of the 4 census regions, it is fourth in the Midwest. Smart Money magazine makes the list only in the Northeast and House Beautiful only in the West. Likewise, Family Handyman appears in both the Midwest and South, but not in the Northeast or West. Among print magazines that index at 110 or higher for readers planning to retire in the next year, we can determine which magazines would be ideal for placing ads promoting plans and hobbies for their future free time. The following magazines rank top for future retirees who say “This magazine has ads for things I care about.” The Personal Time Out dimension helps identify vehicles that people like to relax with and to spend their free time using. While there are similarities across users of all ages, these top websites for each age group show that younger users prefer social media and entertainment-oriented sites, while more mature users lean towards lifestyle sites when they just want to kick back. Of the Facebook.com users who say, “I like to kick back and wind down with Facebook.com,” we can look at what retailers they are most likely to shop compared to other online adults. Facebook.com users who like to kick back and wind down on the site are 172% more likely to shop at Express and 130% more likely to shop at Victoria’s Secret or Banana Republic. Should these retailers advertise on Facebook, they could benefit by including messages of escape and time-out. When it comes to word of mouth, synergy is a powerful tool. While 69% of all viewers of The Oprah Winfrey Show say, “This program gives me something to talk about,” this number increases to 81% among those viewers who either read O, The Oprah Magazine or visit Oprah.com. Incredibly, when looking at Oprah viewers who visit her website and also read her magazine, fully 96% say The Oprah Winfrey Show gives them something to talk about, an increase of 39% over all program viewers.
African Americans represent 11% of the U.S. adult population and, as a group, constitute the nation’s largest racial minority market. African Americans are also more optimistic about their financial situation than the general population, and with good reason. According to the Selig Center for Economic Growth, African American buying power reached $913 billion in 2008, up from $590 billion in 2000. By 2013, African American buying power will reach an astonishing $1.2 trillion, meaning that almost nine cents out of every dollar spent in the United States will come from African American consumers. In celebration of Black History Month, Experian Simmons examines the attitudes, behaviors and media consumption of our country’s African American consumers using data from Simmons DataStreamSM, the Simmons National Consumer Study, New Media Study, Multi-Media Engagement Study and Experian MicromarketerG3 as well as findings from our friends at Experian Hitwise. When it comes to attitudes towards personal financial outlook, African Americans are more likely than the average American adult to say that in the next 12 months they will be better off financially. As of December 28th, 2009, 36% of African Americans said they would be better off financially in the next 12 months, compared with 31% of all adults who felt the same. African Americans are trend setters. Below are the top indexing statements on apparel, auto, food and social interaction among African American adults compared to the total adult population. Index relative to total adult population in parentheses. House Beautiful magazine is a great publication for reaching African Americans who respond to print ads. Readers of House Beautiful, for instance, are 37% more likely to be African American and House Beautiful scores 83% higher than the average magazine among African American readers who say they are likely to buy product or services advertised in the magazine. Where in the United States is the best place to find African American consumers with household incomes of $100,000 or more? Hinesville-Fort Stewart, Georgia is tops followed by Fresno and Stockton, California. African American consumers are more likely than the average online adult to use a wide range of emerging technologies and media. For instance, online African American consumers are 20% more likely than average to watch movies online, 19% more likely to listen to Internet radio and 18% more likely to use social tags or bookmarks. Below are the top sites ranked by the percentage of visits coming from the top African American Mosaic lifestyle segments. The list is dominated by social networking sites.
Coffee drinkers in America Coffee plays such an integral part of every day life in America that it may be safe to say that coffee helps the United States go round. In fact, fully 60% of all U.S. households use either whole or ground coffee beans at home. Experian Simmons extensively reviewed the American coffee drinker for this report which features detailed insights into the coffee-drinking American. In addition, we compare the patrons of Dunkin’ Donuts and Starbucks, the leading players in the battle for brew. Coffee in the Home The average U.S. household that uses whole or ground coffee consumes 4.2 cups per day. In total that’s about 280.5 million cups of coffee consumed at home by Americans each day or about 102 billion cups per year. Among households that use coffee, 89% stock regular coffee and 46% stock decaf.* Among households that use coffee, 84% use pre-ground coffee and 26% use whole bean coffee at least some of the time.* Instant Flavored Coffee Over a quarter of households (27%) stock instant coffee. Sixteen percent of households use instant flavored coffee. The most commonly used flavors among instant flavored coffee drinkers are: Older Americans More Likely to Drink Coffee Fifty-seven percent of adults ages 18-24 live in households that use coffee, but 25 to 34 year olds are the least likely to stock coffee in their cupboards with only 54% reporting they use whole or ground bean coffee at home. Coffee Use Increases with Household Income Seventy percent of Americans who report annual household incomes of $150,000+ drink coffee compared with 54% of those with household income less than $25,000. Dunkin' Donuts Vs. Starbucks Dunkin' Donuts 11% of American adults go to DD Between 9.15.08 and 9.15.09 the share of DD customers who go there 6+ times a month is up 11%* DD consumers are 41% more likely than the average adult to be registered Independents and 9% less likely to be registered Republicans Starbucks 13% of American adults go to Starbucks Between 9.15.08 and 9.15.09 the share of Starbucks customers who go there 6+ times a month is down 22% Starbucks consumers are 11% more likely to be registered Independents and 11% more likely to be registered Republicans Coffee Drinkers Are Coffee Drinkers A majority of coffee-drinking Americans are loyal to their franchise. However, there are a considerable number of Dunkin’ Donuts and Starbucks consumers who jump between coffee houses. How Often Americans Order Their Coffee The majority of both Dunkin’ Donuts and Starbucks customers visit each chain between one and five times in a typical month. Learn more about Simmons consumer research and studies.