The holiday season is just around the corner, and retailers and marketers are gearing up for the busiest shopping period of the year. It’s crucial to understand how consumer behavior is evolving and what emerging trends to expect. Experian’s 2023 Holiday spending trends and insights report analyzes recent trends, consumer spending habits, and anticipates what’s to come in 2023 to help you deliver a top-notch shopping experience this holiday season.
In this blog post, we’ll cover three key insights from our report.
1. Consumers are shopping earlier
It’s no secret that December has always been the go-to month for consumers when it comes to holiday spending. However, holiday shopping now starts earlier, particularly with online sales.
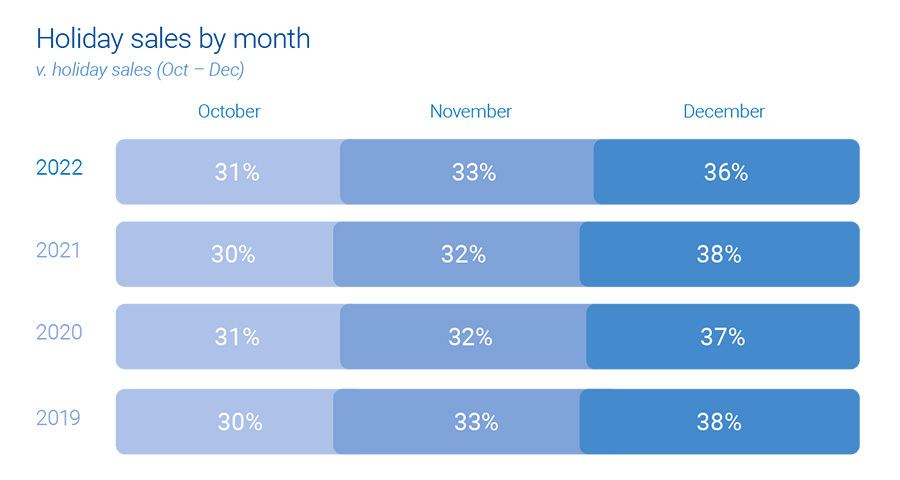
This can be attributed to a surge in promotions and deals, enticing shoppers to open their wallets ahead of time, giving a significant boost to holiday sales. Notably, Cyber Week sales have proven to be an influential factor, accounting for 8% of total consumer holiday spending.
Experian tip
Reach the right shoppers with your promotions with sell-side targeting. This powerful approach gives you control over where your ads are placed while ensuring maximum visibility through direct connections with publishers. Whether on mobile, web, or CTV, this seamless ad experience will engage your audience effectively.
2. Online sales are on the rise
The popularity of online holiday sales is continuously growing, surpassing in-store shopping. There has been a consistent 1% year-over-year increase in online sales, while in-store sales have seen a 1% decrease.
“It’s easier for consumers to comparison shop for large ticket items online that they might find at a mass retailer or office supply store. Consumers prefer to have larger, bulkier items shipped directly to their home for minimal cost. By shopping online, consumers can save time since they don’t need to wait in checkout lines.”
Anna Liparoto, Sr. Account Executive, Retail & CPG
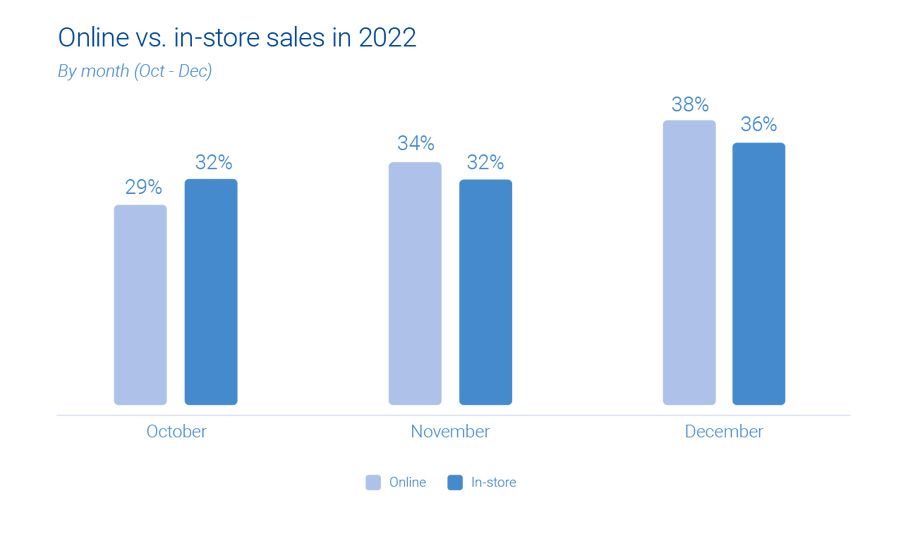
Although online sales currently make up only one-third of all holiday shopping, there is immense potential for further expansion. Mass retailers and office, electronics, and games industries particularly excel in online holiday sales. While in-store purchases remain the primary choice for holiday shoppers, consumer online and offline activities intersect before the final purchase.
Experian tip
Take advantage of the surge in online shopping by diversifying your marketing channels. An agnostic identity graph can bring together device and media data, capturing valuable user insights. By gaining a holistic view of your target audience, you’ll be able to optimize your ad spend and allocate resources effectively, ultimately boosting your return on investment.
“Omnichannel targeting during the upcoming holiday season will continue to prove to be the best way to reach scale and maximize ROI across all marketing channels.”
Joe LigÉ, Head of Enterprise Demand Partnerships
3. 2023 holiday spending will be on par with 2022
During the holiday season in 2022, consumer spending showed an anticipated increase, although the growth rate was slightly lower compared to previous years. October saw a surge in average consumer spending, indicating a swift response to early discounts and promotions offered by retailers.
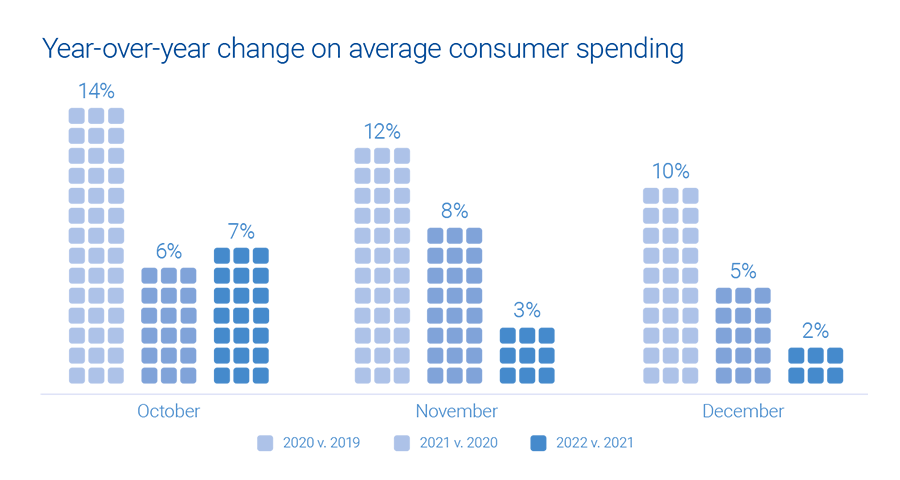
As the holiday season progressed, holiday spending gradually slowed down and reached a level similar to that of the previous year. Overall, there was a modest 2% growth. Looking into the future, if economic conditions remain stable in the second half of 2023, we can expect holiday spending to align with the figures from last year.
Experian tip
To truly maximize impact, consider data enrichment. By diving deeper into your target audience’s preferences and behaviors, you can better tailor your strategies and seamlessly integrate the enriched data across various channels. This allows you to unlock the true potential of your ad inventory, creating more meaningful connections with your audience.
Download our 2024 report
Get ready for the holiday shopping season with Experian’s 2024 Holiday spending trends and insights report. Inside you’ll find:
- Analysis of past trends and what they mean for 2024
- Exclusive predictions for the upcoming holiday season
- The top audiences to activate this holiday season
To access to all of our predictions for this year’s holiday shopping season, download our 2024 Holiday spending trends and insights report today.
Latest posts

As we ring in the New Year this week, Americans will be tossing back a few adult beverages in celebration. While alcohol consumption certainly increases around holidays and other times of celebration, many Americans imbibe year-round. So where across this great land of ours are you most likely to find adults willing and able to raise a glass (or two) and where are you most likely to be surrounded by teetotalers? Experian Simmons has the answer. Leveraging data from our SimmonsLOCAL study, we examined the drinking patterns of adults of legal drinking age in the 106 Designated Market Areas (DMAs) with populations of at least 500,000 adults age 21 and older. We then ranked those markets by the number of alcoholic beverages consumed by the average adult during a typical month. The chart below lists the DMAs that consume the most alcoholic beverages per capita in a typical month. First place goes to Boston, where the average adult of legal drinking age regularly kicks back 14.4 drinks a month. (Celebrations in Beantown are probably already underway.) Rank DMA Average drinks per month 1 Boston 14.4 2 Austin 13.8 3 Providence-New Bedford 13.4 4 Madison 13.2 4 Hartford & New Haven 13.2 6 Philadelphia 13.1 7 Chicago 13 8 Denver 12.9 9 Tallahassee-Thomasville 12.8 9 Milwaukee 12.8 11 Minneapolis-St. Paul 12.6 11 West Palm Beach-Ft. Pierce 12.6 11 Seattle-Tacoma 12.6 11 Tucson (Sierra Vista) 12.6 15 Green Bay-Appleton 12.5 16 San Diego 12.4 16 Baltimore 12.4 16 Washington, DC 12.4 16 Albany-Schenectady-Troy 12.4 20 New Orleans 12.3 20 St. Louis 12.3 20 Colorado Springs-Pueblo 12.3 23 Burlington-Plattsburgh 12.2 23 Syracuse 12.2 23 Norfolk-Portsmouth-Newport News 12.2 23 Spokane 12.2 23 Portland-Auburn 12.2 Source: Experian Simmons Adult residents of the markets listed below surely know how to have a good time-it's just unlikely to include a cocktail. The chart below lists the DMAs that consume the fewest alcoholic beverages per capita in a typical month. Residents of Chattanooga consume only 6 alcoholic beverages per month, on average, making it the least imbibing market-and probably the one that feels the best the morning after a big gathering. Rank DMA Average drinks per month 106 Chattanooga 6 105 Salt Lake City 7.2 105 Florence-Myrtle Beach 7.2 105 Charleston-Huntington 7.2 105 Tri-Cities, TN-VA 7.2 101 Knoxville 7.4 100 Lexington 7.9 99 Birmingham 8 98 Huntsville-Decatur 8.5 97 Nashville 8.9 97 Evansville 8.9 95 Paducah-Cape Girardeau-Harrisburg-Mt Vernon 9.1 94 Springfield, MO 9.2 94 Tulsa 9.2 94 Greenville-New Bern-Washington 9.2 91 Memphis 9.3 90 Greenville-Spartanburg-Asheville-Anderson 9.4 90 Jackson, MS 9.4 90 Wichita-Hutchinson Plus 9.4 86 Little Rock-Pine Bluff 9.5 86 Louisville 9.5 86 Ft. Smith-Fayetteville-Springdale-Rogers 9.5 83 Fresno-Visalia 9.6 82 Greensboro-High Point-Winston Salem 9.7 82 Roanoke-Lynchburg 9.7 Source: Experian Simmons For more information on SimmonsLOCAL's vivid reporting of consumer behaviors, attitudes, lifestyles and media consumption in 209 Designated Market Areas down to the ZIP code level, visit our website.
Registered Republicans and Democrats have different TV program preferences. But a majority of highly rated Nielsen programs seem to clearly skew Republican. Which TV programs does each group prefer, and what are the common threads among the two groups?
Discount stores appear to be weathering the recession better than some of their full-price counterparts, as they carry first-quality designer merchandise at competitive prices.