
The holiday season is just around the corner, and retailers and marketers are gearing up for the busiest shopping period of the year. It’s crucial to understand how consumer behavior is evolving and what emerging trends to expect. Experian’s 2023 Holiday spending trends and insights report analyzes recent trends, consumer spending habits, and anticipates what’s to come in 2023 to help you deliver a top-notch shopping experience this holiday season.
In this blog post, we’ll cover three key insights from our report.
1. Consumers are shopping earlier
It’s no secret that December has always been the go-to month for consumers when it comes to holiday spending. However, holiday shopping now starts earlier, particularly with online sales.

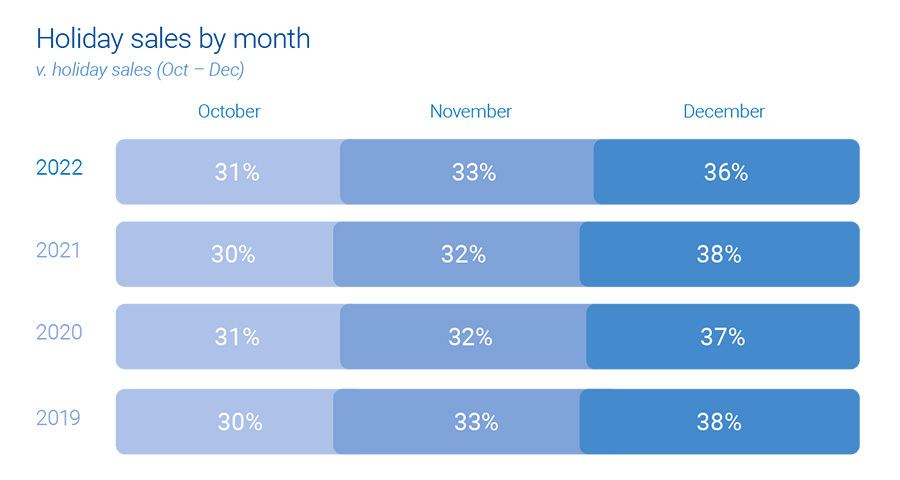
This can be attributed to a surge in promotions and deals, enticing shoppers to open their wallets ahead of time, giving a significant boost to holiday sales. Notably, Cyber Week sales have proven to be an influential factor, accounting for 8% of total consumer holiday spending.
Experian tip
Reach the right shoppers with your promotions with sell-side targeting. This powerful approach gives you control over where your ads are placed while ensuring maximum visibility through direct connections with publishers. Whether on mobile, web, or CTV, this seamless ad experience will engage your audience effectively.
2. Online sales are on the rise
The popularity of online holiday sales is continuously growing, surpassing in-store shopping. There has been a consistent 1% year-over-year increase in online sales, while in-store sales have seen a 1% decrease.
“It’s easier for consumers to comparison shop for large ticket items online that they might find at a mass retailer or office supply store. Consumers prefer to have larger, bulkier items shipped directly to their home for minimal cost. By shopping online, consumers can save time since they don’t need to wait in checkout lines.”
Anna Liparoto, Sr. Account Executive, Retail & CPG

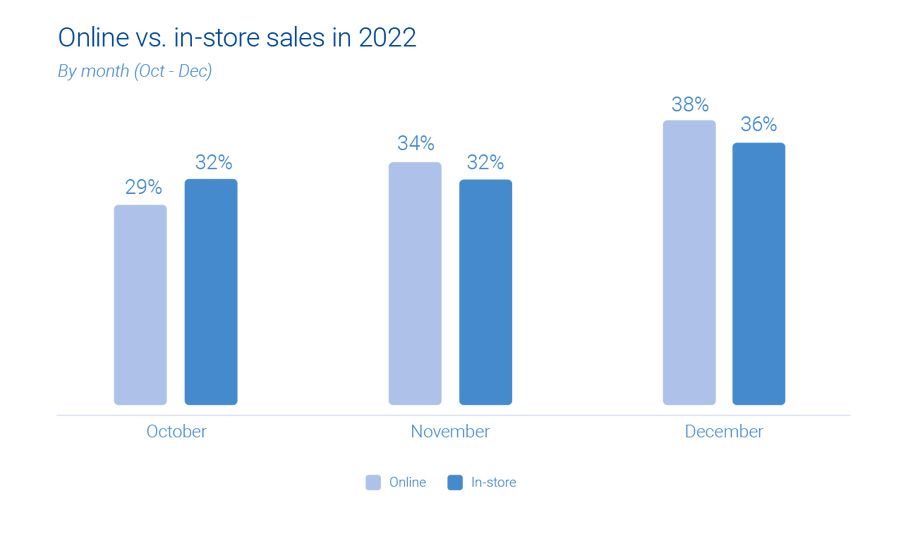
Although online sales currently make up only one-third of all holiday shopping, there is immense potential for further expansion. Mass retailers and office, electronics, and games industries particularly excel in online holiday sales. While in-store purchases remain the primary choice for holiday shoppers, consumer online and offline activities intersect before the final purchase.
Experian tip
Take advantage of the surge in online shopping by diversifying your marketing channels. An agnostic identity graph can bring together device and media data, capturing valuable user insights. By gaining a holistic view of your target audience, you’ll be able to optimize your ad spend and allocate resources effectively, ultimately boosting your return on investment.
“Omnichannel targeting during the upcoming holiday season will continue to prove to be the best way to reach scale and maximize ROI across all marketing channels.”
Joe LigÉ, Head of Enterprise Demand Partnerships
3. 2023 holiday spending will be on par with 2022
During the holiday season in 2022, consumer spending showed an anticipated increase, although the growth rate was slightly lower compared to previous years. October saw a surge in average consumer spending, indicating a swift response to early discounts and promotions offered by retailers.

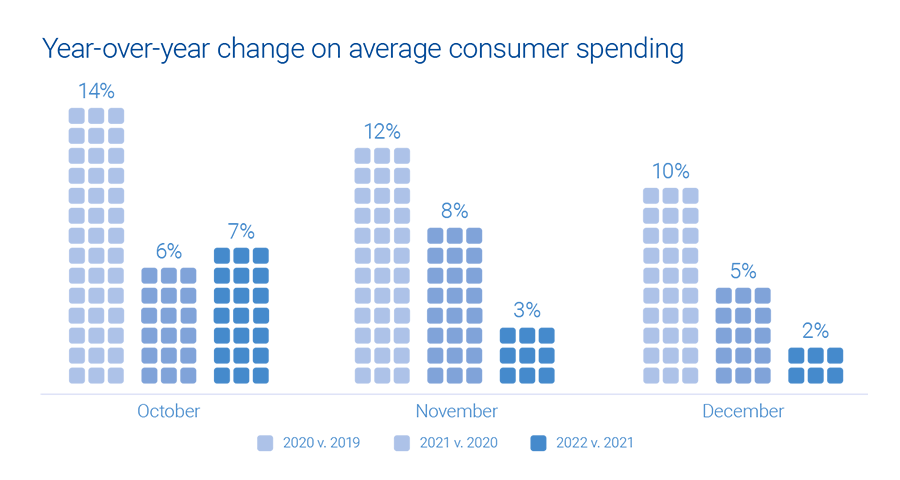
As the holiday season progressed, holiday spending gradually slowed down and reached a level similar to that of the previous year. Overall, there was a modest 2% growth. Looking into the future, if economic conditions remain stable in the second half of 2023, we can expect holiday spending to align with the figures from last year.
Experian tip
To truly maximize impact, consider data enrichment. By diving deeper into your target audience’s preferences and behaviors, you can better tailor your strategies and seamlessly integrate the enriched data across various channels. This allows you to unlock the true potential of your ad inventory, creating more meaningful connections with your audience.
Download our 2024 report
Get ready for the holiday shopping season with Experian’s 2024 Holiday spending trends and insights report. Inside you’ll find:
- Analysis of past trends and what they mean for 2024
- Exclusive predictions for the upcoming holiday season
- The top audiences to activate this holiday season
To access to all of our predictions for this year’s holiday shopping season, download our 2024 Holiday spending trends and insights report today.
Latest posts

Coffee drinkers in America Coffee plays such an integral part of every day life in America that it may be safe to say that coffee helps the United States go round. In fact, fully 60% of all U.S. households use either whole or ground coffee beans at home. Experian Simmons extensively reviewed the American coffee drinker for this report which features detailed insights into the coffee-drinking American. In addition, we compare the patrons of Dunkin’ Donuts and Starbucks, the leading players in the battle for brew. Coffee in the Home The average U.S. household that uses whole or ground coffee consumes 4.2 cups per day. In total that’s about 280.5 million cups of coffee consumed at home by Americans each day or about 102 billion cups per year. Among households that use coffee, 89% stock regular coffee and 46% stock decaf.* Among households that use coffee, 84% use pre-ground coffee and 26% use whole bean coffee at least some of the time.* Instant Flavored Coffee Over a quarter of households (27%) stock instant coffee. Sixteen percent of households use instant flavored coffee. The most commonly used flavors among instant flavored coffee drinkers are: Older Americans More Likely to Drink Coffee Fifty-seven percent of adults ages 18-24 live in households that use coffee, but 25 to 34 year olds are the least likely to stock coffee in their cupboards with only 54% reporting they use whole or ground bean coffee at home. Coffee Use Increases with Household Income Seventy percent of Americans who report annual household incomes of $150,000+ drink coffee compared with 54% of those with household income less than $25,000. Dunkin' Donuts Vs. Starbucks Dunkin' Donuts 11% of American adults go to DD Between 9.15.08 and 9.15.09 the share of DD customers who go there 6+ times a month is up 11%* DD consumers are 41% more likely than the average adult to be registered Independents and 9% less likely to be registered Republicans Starbucks 13% of American adults go to Starbucks Between 9.15.08 and 9.15.09 the share of Starbucks customers who go there 6+ times a month is down 22% Starbucks consumers are 11% more likely to be registered Independents and 11% more likely to be registered Republicans Coffee Drinkers Are Coffee Drinkers A majority of coffee-drinking Americans are loyal to their franchise. However, there are a considerable number of Dunkin’ Donuts and Starbucks consumers who jump between coffee houses. How Often Americans Order Their Coffee The majority of both Dunkin’ Donuts and Starbucks customers visit each chain between one and five times in a typical month. Learn more about Simmons consumer research and studies.

Two-thirds of U.S. Households Use Coupons Two-thirds of American households (67%) use coupons. And while the vast majority of households using coupons (87%) say they use them to save money, 30% also say that coupons are a way for them to try out new products. Newspapers are still the number one coupon source with 70% of coupon households still getting their coupons from a newspaper. The Internet is growing as a coupon source. A quarter of coupon households get coupons online today, up 46% in the last three years. What Americans Buy With Their coupons Nearly half of all American households use coupons to buy food/grocery products making them the most common items purchased with coupons followed by cleaning products and beauty/grooming products. Seven percent of households buy tobacco using coupons. Where Are Coupons Redeemed? Given that half of U.S. households use coupons for food/grocery products, it’s no surprise that 60% of all households redeem coupons in supermarket, grocery or convenient stores. While only a quarter of all households use coupons at restaurants/fast food chains, that number has risen by 9% since 2006, when 23% of households redeemed coupons at restaurants. Coupons Attract New Consumers With the start of the holiday shopping season around the corner retailers want to make sure consumers visit their store and/or website. One way to drive consumer traffic is with coupons. Close to 50 percent of American adults say they are likely to be drawn to a store they don’t normally shop at by a coupon. The Experian Simmons retail shopping segment known as Mall Maniacs make up just 12% of all shoppers, but that group is 82% more likely to be drawn to a new store by a coupon. Percentage of U.S. Adult Population by Shopping Segment Mall Maniacs and Status Strivers are 66% and 26% more likely, respectively, to appreciate getting emails that announce new products and services. Identifying these consumers is key to maximize online marketing dollars. Additionally, with more and more consumers shopping online, companies should ensure that coupons are redeemable both online and in-stores.

Definition of an NHL and Non-NHL fan The behaviors and preferences of National Hockey League (NHL) and non-NHL fans are compared in this report. Below are the definitions of each consumer type: NHL fans are 18+ adults who are either “very”, “somewhat”, or “a little bit” interested in NHL Non-NHL fans are 18+ adults who are “not at all” interested in NHL Who Are NHL Fans? Compared to 2006, there are 11 percent more American adults who are NHL fans*. And with 52 percent of its fans under the age of 45, the NHL’s fan base is – for the most part – young. NHL Fans Are Educated and Well Paid NHL fans are more likely than non-NHL fans to have graduated college and attained a graduate degree. The benefits of their higher education is clear as NHL fans are 64 percent more likely than non-NHL fans to personally earn an income of $150,000 or more annually. Next we’ll examine a few luxuries NHL fans enjoy: home-ownership, watches, and vehicles. Home Owners Seventy-seven percent of NHL fans own their place of residence. The graph below charts the percentage of NHL and non-NHL fans who own any resident type (includes house, condominium, co-op and mobile home). As illustrated, there are more NHL fans than non-fans who own homes that value at $300,000 or more. Watches Twenty-six percent of NHL fans purchased a watch for themselves or someone else in the last 12 months and their tastes are not cheap. NHL fans are 2.6 times more likely than non-fans to have spent $500 or more on a timepiece. Vehicles Similar to their watch purchasing behavior, NHL fans are willing to splurge on their vehicles. For their most recent vehicle purchase, NHL fans were 13 percent more likely than non-NHL fans to spend over $30,000. Internet Purchases NHL fans spend big online. During the last 12 months, NHL fans spent a total $9.9 billion on Internet purchases. Among those who made a purchase in the last year, NHL fans are 25 percent more likely than non-NHL fans to spend $1,000 or more online during the year. In fact, 41 percent of NHL fans who shop the Internet spend at least $500 online a year. Business Purchase Decision Makers The previous slides established that NHL fans have expensive taste and aren’t troubled spending extra to purchase personal items. However, can the same be said for business-related purchases? Indeed it can. Not only are there more NHL fans than non-fans making business purchase decisions, they’re also 54 percent more likely than non-fans to spend $100,000 or more on office products. Conclusion The National Hockey League has a growing fan base that doesn’t mind spending extra for products and services.