
The holiday season is just around the corner, and retailers and marketers are gearing up for the busiest shopping period of the year. It’s crucial to understand how consumer behavior is evolving and what emerging trends to expect. Experian’s 2023 Holiday spending trends and insights report analyzes recent trends, consumer spending habits, and anticipates what’s to come in 2023 to help you deliver a top-notch shopping experience this holiday season.
In this blog post, we’ll cover three key insights from our report.
1. Consumers are shopping earlier
It’s no secret that December has always been the go-to month for consumers when it comes to holiday spending. However, holiday shopping now starts earlier, particularly with online sales.
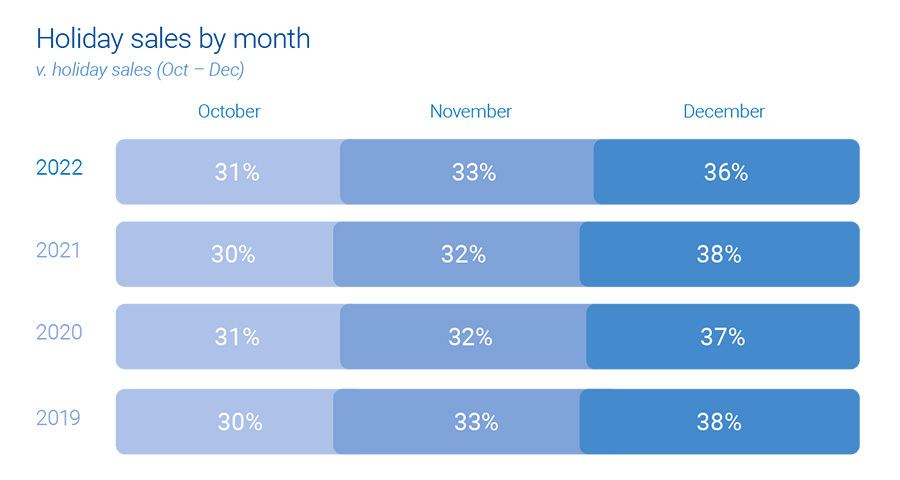
This can be attributed to a surge in promotions and deals, enticing shoppers to open their wallets ahead of time, giving a significant boost to holiday sales. Notably, Cyber Week sales have proven to be an influential factor, accounting for 8% of total consumer holiday spending.
Experian tip
Reach the right shoppers with your promotions with sell-side targeting. This powerful approach gives you control over where your ads are placed while ensuring maximum visibility through direct connections with publishers. Whether on mobile, web, or CTV, this seamless ad experience will engage your audience effectively.
2. Online sales are on the rise
The popularity of online holiday sales is continuously growing, surpassing in-store shopping. There has been a consistent 1% year-over-year increase in online sales, while in-store sales have seen a 1% decrease.
“It’s easier for consumers to comparison shop for large ticket items online that they might find at a mass retailer or office supply store. Consumers prefer to have larger, bulkier items shipped directly to their home for minimal cost. By shopping online, consumers can save time since they don’t need to wait in checkout lines.”
Anna Liparoto, Sr. Account Executive, Retail & CPG
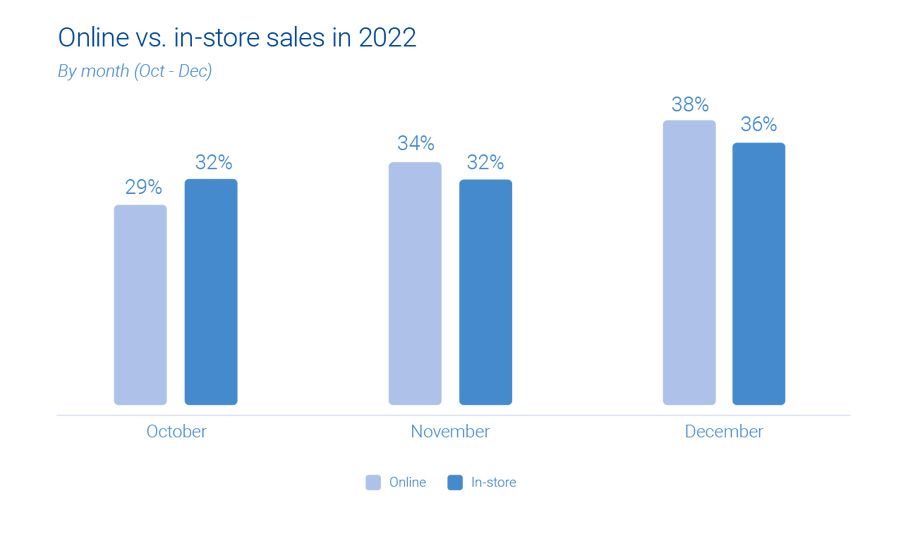
Although online sales currently make up only one-third of all holiday shopping, there is immense potential for further expansion. Mass retailers and office, electronics, and games industries particularly excel in online holiday sales. While in-store purchases remain the primary choice for holiday shoppers, consumer online and offline activities intersect before the final purchase.
Experian tip
Take advantage of the surge in online shopping by diversifying your marketing channels. An agnostic identity graph can bring together device and media data, capturing valuable user insights. By gaining a holistic view of your target audience, you’ll be able to optimize your ad spend and allocate resources effectively, ultimately boosting your return on investment.
“Omnichannel targeting during the upcoming holiday season will continue to prove to be the best way to reach scale and maximize ROI across all marketing channels.”
Joe LigÉ, Head of Enterprise Demand Partnerships
3. 2023 holiday spending will be on par with 2022
During the holiday season in 2022, consumer spending showed an anticipated increase, although the growth rate was slightly lower compared to previous years. October saw a surge in average consumer spending, indicating a swift response to early discounts and promotions offered by retailers.
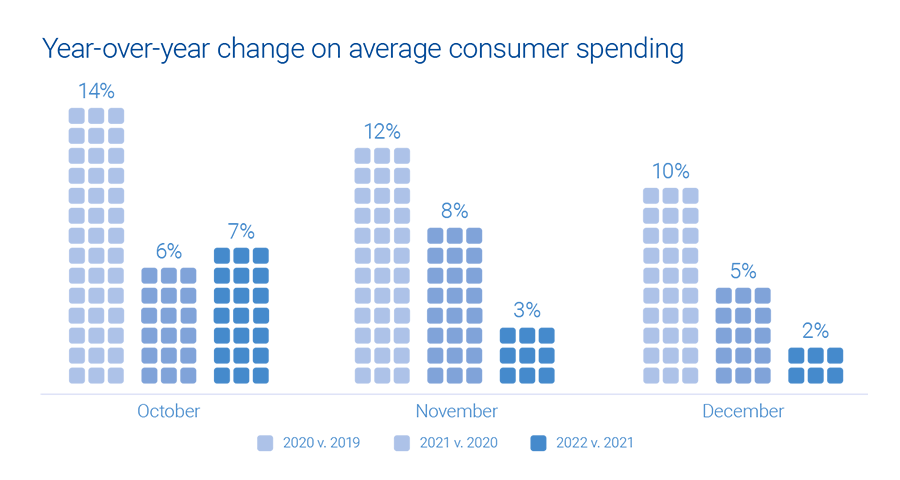
As the holiday season progressed, holiday spending gradually slowed down and reached a level similar to that of the previous year. Overall, there was a modest 2% growth. Looking into the future, if economic conditions remain stable in the second half of 2023, we can expect holiday spending to align with the figures from last year.
Experian tip
To truly maximize impact, consider data enrichment. By diving deeper into your target audience’s preferences and behaviors, you can better tailor your strategies and seamlessly integrate the enriched data across various channels. This allows you to unlock the true potential of your ad inventory, creating more meaningful connections with your audience.
Download our 2024 report
Get ready for the holiday shopping season with Experian’s 2024 Holiday spending trends and insights report. Inside you’ll find:
- Analysis of past trends and what they mean for 2024
- Exclusive predictions for the upcoming holiday season
- The top audiences to activate this holiday season
To access to all of our predictions for this year’s holiday shopping season, download our 2024 Holiday spending trends and insights report today.
Latest posts

Same-sex marriage is a hot button topic no matter on which side of the issue you stand. But there can be no denying that same-sex couples are finding an expanding number of options in the U.S. and abroad should they decide to legally wed. The 2010 LGBT Consumer Report explores the household arrangements and behaviors of America's LGBT consumers—in particular, those associated with marriage—compared to America's heterosexual population. You will learn that despite being less than half as likely to be married, lesbian, gay and bisexual adults are 22% more likely than their "straight" counterparts to have recently wed or to be planning nuptials for the next year. Looking for that perfect gift for the newly wed couple? You will also get some shopping tips for identifying favored retailers of lesbian, gay and bisexual shoppers. We'll start by sizing the LGBT market. An estimated 3.7% of the non-Hispanic adult population (7.1 million adults) self-identifies as LGBT, which can be broken down as follows: The average heterosexual adult lives in a household with 1.9 other individuals, including adults and kids. By comparison, the average lesbian shares her home with only 1.6 other people. Gay men live in the smallest households, sharing their home with only one other person, on average. Over a third of gay or bisexual men (38%) share their home with at least one other adult male, compared with only 24% of heterosexual men who live under the same roof as another adult male. Thirty-five percent of gay or bisexual men say they live with one (and only one) other adult male, a living arrangement that has a higher chance of consisting of a same-sex, co-habiting couple. Over half of lesbians or bisexual women (53%) share their home with at least one other adult female, compared with only 23% of heterosexual women who live under the same roof as another adult female. Forty-three percent of lesbian or bisexual women say they live with one (and only one) other adult female, a living arrangement that has a higher chance of consisting of a same-sex, co-habiting couple. Lesbian, Gay and Bisexual adults (LGB) as a group are less than half as likely as heterosexuals to be married. Only 26% of LGB adults are wed, compared with 57% of “straight” adults. Of all LGB adults, bisexuals are the most likely group to be married, with over 4 in 10 reporting they are presently wed. Lesbians are more than four and a half times more likely than gay men to be married, with 23% of lesbians having tied the knot versus only 5% of gay men. Lesbian, gay and bisexual adults as a group are 22% more likely than heterosexual adults to have either tied the knot in the last 12 months or have plans to wed in the coming year. 5.7% of lesbian, gay or bisexual adults are newly weds or “soonly” weds vs. 4.6% of heterosexual adults. Lesbian, gay and bisexual adults are twice as likely to shop at Neiman Marcus, making the department store the number one retailer with a wedding registry program among LGB shoppers. With many retailers ending their registry programs in favor of gift cards, we looked at how stores without registry programs stack up among lesbian, gay and bisexual shoppers. LGB adults are almost twice as likely to shop at J. Crew, making the store the number one retailer without a wedding registry program among LGB shoppers.
With the 82nd Academy Awards® just around the corner and only days before final voting ballots are due back to accounting firm PricewaterhouseCoopers, Experian Simmons is taking a close look at the American movie-going population. In any given month, over 56 million adults (26% of the adult population) make a trip to the cinema to take in a film. Movie-going typically reaches its peak in mid-summer, and 2009 was no exception. Experian Simmons DataStreamSM reports that in July of last year, 32% of adults went to movies, the highest level observed at any point in the year. In October of the same year, the percentage of past-month adult cinema-goers had dropped to just 19%, the lowest point observed in all of 2009. In this month’s Consumer Insights report, Experian Simmons sizes the movie-going audience, examines their receptivity to cinema ads—including pre-show commercials and product placement within films—online movie searches as well as Americans’ penchant for tuning into the Academy Awards. All data comes from the Simmons Summer 2009 National Consumer Study. Two-thirds of the adult population have gone to the movies at least once in the last 6 months. Nearly half (46%) have been in the last 90 days and a quarter (26%) have been in the last month. Young adults are, as expected, more likely to go to the movies than older adults, but adults over 50 outnumber young adults when it comes to raw number of movie-goers as you will see in the following chart. Over 147 million individuals have gone to the movies at least once in the last 6 months. With 20.8 million adults ages 18 to 24 going to the movies in the last 6 months, this age group accounts for only 14% of the movie-going population. Adults ages 50 and over, on the other hand, account for 37% of the movie-going population with over 55 million adults in this age group going to the theater at least once in the last 6 months. Among all adults who had been to the movies at least once in the last 6 months, 68% have been at least once in the last 30 days. Many movie-goers (39%) have been only once in the last month and only 7% have been four or more times. Young adults ages 18 to 24 are much more likely than the average movie-goer to have been to the theater in the last month with 75% reporting having been at least once and 10% having been 4 times or more. Experian Simmons DataStreamSM reports similar trends in past 30 day movie-going for 2008 and 2009 with the peak for this behavior occurring in both years on almost the exact same date. During the week of July 22, 2009 32% of adults reported having been to the theater during the last 30 days and during the week of July 21, 2008, 29% reported going. Cinema Blockbusters that month in ’09 included Bruno and Harry Potter and the Half-Blood Prince. In July of ’08, Mama Mia and The Dark Knight were released. When it comes to product placement in movies, frequent cinema-goers are most likely to respond. In fact, 41% of adults who went to the movies 4 or more times in the last 90 days are classified by the Simmons Movie Product Placement segmentation system as “Emulators,” those consumers who notice, remember and are driven to buy products placed into the context of a film. By comparison, only 28% of consumers who went to a movie only once in the last 90 days are Emulators. Forty-eight percent of Horror film fans say they often pay attention to commercials that show along with movie previews in movie theaters making them the most receptive to cinema advertisements followed by Romantic Comedy fans and Family movie fans. Only 39% of Foreign Language or Independent film fans say they pay attention to such ads. Nearly a quarter of all movie-goers get movie information, reviews or show times online in any given month. Aside from the obvious movie sites, you are likely to find movie information seekers on these sites: Californians like foreign language and independent films, whereas New Englanders have more of a penchant for Comedies and Southerners are among the most likely to see Horror films. Below are the top 5 metro areas for finding adults who say they usually see the three selected movie genres when they go to the theater. One-in-seven American adults tuned into the last Academy Awards® ceremony on ABC, including many non-movie-goers. Nine percent of adults who had not been to the movies even once in the past six months tuned into the last awards show and ultimately comprised 19% of all 2009 Oscar® viewers. Still, the more frequently a consumer goes to the movies, the more likely he or she is to watch the annual Academy Awards® ceremony.