At Experian, we understand the critical role that audience targeting plays in the success of marketing campaigns. That’s why we’re excited to share this curated list, aimed at helping agencies and media buyers plan their campaigns and effectively reach their audiences with precision and confidence.
Here’s a look at the Experian audiences that were the most popular in Q2 2023. Which ones will you add to your Q2 campaign planning?
Our top 10 audiences for Q2
Fitness enthusiast
Lifestyle and Interests (Affinity) > Health & Fitness > Fitness Enthusiast
In-store high spender on baby products
Retail Shoppers: Purchase Based > Shopping Behavior > Baby Products: In Store High Spenders
Has a bachelor’s degree
Demographics > Education > Bachelor Degree
In-market for an SUV and CUV
Autos, Cars and Trucks > In Market-Body Styles > SUV and CUV
In-market for a mid-size truck
Autos, Cars and Trucks > In Market-Body Styles > Mid-Size Truck
Homeowner
Demographics > Homeowners/Renters > Homeowner
In-market for a small, mid-size SUV
Autos, Cars and Trucks > In Market-Body Styles > Small Mid-Size SUV
In-market for a full-size truck
Autos, Cars and Trucks > In Market-Body Styles > Full-Size Trucks
In-market for a full-size SUV
Autos, Cars and Trucks > In Market-Body Styles > Full-Size SUVs
Household income level
Demographics > Household Income (HHI) > $75,000+
Our top 5 audiences by vertical
Which audience segments were the most popular by advertiser vertical?
Advanced TV
Household income level
Demographics > Household Income (HHI) > $75,000-$99,999
Interested in dogs
Lifestyle and Interests (Affinity) > Pets > Dogs (FLA / Fair Lending Friendly)1
Homeowner
Demographics > Homeowner/Renter > Homeowner
Household income level
Demographics > Household Income (HHI) > $100,000-$124,999
Interested in arts and entertainment
Lifestyle and Interests (Affinity) > Art and Entertainment > Visual Art and Design (FLA / Fair Lending Friendly)
Agency
Dog owner
Lifestyle And Interests (Affinity) > Pets > Dog Owners
Cat owner
Lifestyle And Interests (Affinity) > Pets > Cat Owners
Active investor
Lifestyle And Interests (Affinity) > Investors > Active Investor
Mutual fund investor
Lifestyle And Interests (Affinity) > Investors > Mutual Fund Investor
In-market for a full-size SUV
Autos, Cars and Trucks > In Market-Body Styles > Full-Size SUVs
Auto
In-market for a new car
Autos, Cars and Trucks > In Market-New/Used > New Car
In-market for a used car
Autos, Cars and Trucks > In Market-New/Used > Buyer Used
In-market for a Honda
Autos, Cars And Trucks > In Market-Make And Models > Honda
In-market for an auto loan
Financial FLA Friendly > In Market Auto Loan
In-market for an auto lease
Financial FLA Friendly > In Market Auto Lease
Did you know?
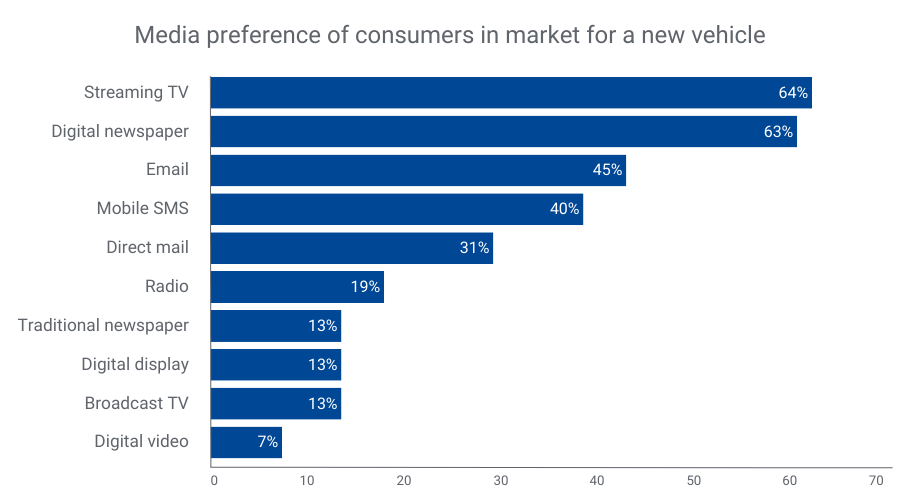
Consumers looking to buy a new vehicle prefer streaming TV, digital newspapers, and email for communication2. By merging our TrueTouchTM engagement channel audiences with our Auto in-market audiences, you can effectively target these consumers through their preferred channels. TrueTouch facilitates personalized advertising campaigns by predicting consumer preferences, ensuring messaging styles align with the right channels and calls to action.
By understanding what types of media people prefer, you can match the best way to talk to them with what to offer, using the right channels for personalized ads. No consumer is the same – and you need to engage with them on their terms to successfully market to them.
Financial
Active in the military
Lifestyle And Interests (Affinity) > Occupation > Military – Active
In-market for a credit union loan
Financial FLA Friendly > In Market Credit Union Loan
40-49 years old
Demographics > Ages > 40-49
30-39 years old
Demographics > Ages > 30-39
Small business owner
Consumer Behaviors > Occupation: Small Business Owners
Health
25-29 years old
Demographics > Ages > 25-29
30-34 years old
Demographics > Ages > 30-34
Weight conscious
Lifestyle and Interests (Affinity) > Health & Fitness > Weight Conscious
Moms interested in fitness
Lifestyle and Interests (Affinity) > Moms, Parents, Families > Fitness Mothers
High spenders at vitamin/supplement stores
Retail Shoppers: Purchase Based > Health and Fitness > Vitamins/Supplements: Vitamins/Supplements
Retail & CPG
Dog owners
Lifestyle And Interests (Affinity) > Pets > Dog Owners
Cat owners
Lifestyle And Interests (Affinity) > Pets > Cat Owners
Fitness enthusiast
Lifestyle and Interests (Affinity) > Health & Fitness > Fitness Enthusiast
Interested in healthy living
Lifestyle and Interests (Affinity) > Health & Fitness > Healthy Living
High spenders at vitamin/supplement stores
Retail Shoppers: Purchase Based > Health and Fitness > Vitamins/Supplements: Vitamins/Supplements
Activate the right audiences with Experian
When you choose Experian’s syndicated audiences, you gain access to over 2,400 audiences that span across 15 verticals and categories. These audiences are directly available for activation on over 30 platforms and can be sent to over 200 media platforms. Experian is ranked #1 for data accuracy (as validated by Truthset) and Experian Marketing Data is the foundation for successful targeting, enrichment, and activation.
For a full list of Experian’s syndicated audiences and activation destinations, download our syndicated audiences guide. Need a custom audience? We can help you build and activate an Experian audience on the platform of your choice.
Check out other seasonal audiences you can activate today.
Footnotes
- Fair Lending Act Friendly audiences: “Fair Lending Friendly” indicates data fields that Experian has made available without use of certain demographic attributes that may increase the likelihood of discriminatory practices prohibited by the Fair Housing Act (“FHA”) and Equal Credit Opportunity Act (“ECOA”). These excluded attributes include, but may not be limited to, race, color, religion, national origin, sex, marital status, age, disability, handicap, family status, ancestry, sexual orientation, unfavorable military discharge, and gender. Experian’s provision of Fair Lending Friendly indicators does not constitute legal advice or otherwise assure your compliance with the FHA, ECOA, or any other applicable laws. Clients should seek legal advice with respect to your use of data in connection with lending decisions or application and compliance with applicable laws.
- Experian looked at our Auto and TrueTouch audience data to understand media preference trends over the past year.
Latest posts

New data from Experian Marketing Services’ Simmons® ConnectSM mobile and digital panel sheds light on the way smartphone users spend time using their phone, with the average adult clocking 58 minutes daily on their device. On average, smartphone owners devote 26% of the time they spend on their phone talking and another 20% texting. Social networking eats up 16% of smartphone time while browsing the mobile web accounts for 14% of time spent. Emailing and playing games account for roughly 9% and 8% of daily smartphone time, respectively, while use of the phone’s camera and GPS each take up another 2% of our smartphone day. *Activities include use of a smartphone’s native features dedicated to each activity as well as downloaded apps whose primary function falls under the given activity. For instance, “watch video” includes the act of watching video on the smartphone’s native video player as well as use of video apps such as YouTube, Netflix, etc. iPhone versus Android users Smartphone users may constantly debate which operating system is supreme, but we see clear differences between the ways consumers use their phone depending on the operating system that runs it. For starters, iPhone users spend an hour and fifteen minutes using their phones per day, a full 26 minutes more than the typical Android phone owner. Additionally, iPhone and Android smartphone owners use their phones in markedly different ways. For instance, 28% of the time that Android users spend using their phones is dedicated to talking, whereas iPhone users spend only 22% of their smartphone time talking on the device. Android owners also devote a greater share of time visiting websites on their phone than iPhone owners. On the other hand, iPhone owners spend a disproportionately greater share of smartphone time than Android owners texting, emailing, using the camera and social networking. Note on time spent It may surprise some to read that an activity like watching video accounts for such a small share (less than 1%) of the typical adult’s daily smartphone use. However, for the charts above to sum to a single daily total it was necessary to calculate individual activity contribution using a base of all smartphone owners, including those who don’t spend any time engaging in a given activity during a typical day. The chart below provides additional insights into the time spent engaging in the major smartphone activities examining only those individuals who engaged in each activity during a 24-hour period. I’ve also added into the chart a reach and frequency metric to indicate the popularity of each activity and the number of times per day that individuals engage in them. In the chart, the activities with the largest bubbles are those in which the greatest share of smartphone owners engage during a typical day and include the usual suspects: talking (79%), texting (76%), visiting websites (62%), emailing (61%) and social networking (52%). Activities with the fewest daily participants are: watching video, which 2.3% of smartphone owners do during a typical day, and reading, which just 0.5% of smartphone owners do daily. Given that nearly 98% of smartphone users don’t watch videos on their phone during a typical day, it’s easier to understand why video comprises such a low share of the average adult’s daily smartphone use. However, the chart above reveals that those who do watch video on their phone spend, on average, 5 minutes a day watching videos spread out over 4.2 different viewing sessions. For more information on consumers’ usage of smartphones, digital tablets, computers and other traditional and digital media platforms, check out Simmons Connect.
New health information exchanges are prompting data quality efforts, as state and local healthcare agencies look to electronically share patient data.
If the time spent on the Internet for personal computers was distilled into an hour then 27 percent of it would be spent on social networking and forums across the United States, United Kingdom and Australia. In the U.S., 16 minutes out of every hour online is spent on social networking and forums, nine minutes on entertainment sites and five minutes shopping. Global comparison In the UK, 13 minutes out of every hour online is spent on social networking and forums, nine minutes on entertainment sites and six minutes shopping. Australian Internet users spend 14 minutes on social sites, nine on entertainment and four minutes shopping online. Across all three markets, time spent shopping online grew year-over-year, but the UK market emerged as having the most prolific online shoppers, spending proportionally more time on retail Websites than online users in the U.S. or Australia. British Internet users spent 10 percent of all time online shopping in 2012, compared to nine percent in the U.S. and six percent in Australia. This was in part due to a bumper winter holiday season in the UK where 370 million hours were spent shopping online, 24 percent higher than the monthly average. Consumption of news content also increased across all three markets with Australian users emerging as the most voracious consumers of news online. Six percent of all time spent online in Australia in 2012 was on a news Website, compared to five percent in the UK and four percent in the U.S. Meanwhile, the time spent on social media proportionate to other online activities declined across all three regions. The U.S., which has been the most dominant market for social media consumption in the last three years dropped from 30 percent of all time spent online to 27 percent. In Australia time spent on social dropped from 27 percent to 24 percent while in the UK it dipped from 25 percent to 22 percent year-over-year. This highlights the rise in access via 3G and 4G networks as consumers spend increasingly more time online while on the move. "Understanding consumer behavior across channels is more important than ever as more visits are being made on the move, particularly among social networking and email,” says Bill Tancer, general manager of global research for Experian Marketing Services. "With smartphones and tablets becoming more powerful, our data clearly indicates the difference between mobile and traditional desktop usage further enabling the ‘always on’ consumer mentality. Marketers need to understand these differences, as well as regionally, to ensure campaigns can be tailored for better and more effective engagement.” Mobile browsing When looking at the U.S. browsing data for mobile devices, email accounted for the largest time spent on average, for the same categories for Q1 2013. Email made up 23 percent of time spent on mobile devices for Q1-13, while social networking accounted for 15 percent. Entertainment had the third highest time spent with 13 percent, followed by shopping with 11 percent and travel with 9 percent. The mobile data does not include app usage, but does include mobile browsing within an app. Read more of the latest consumer trends in The 2013 Digital Marketer Report Learn more about consumer online behavior by visiting our Online Trends page Learn more about the author, Matt Tatham