
At Experian, we understand the critical role that audience targeting plays in the success of marketing campaigns. That’s why we’re excited to share this curated list, aimed at helping agencies and media buyers plan their campaigns and effectively reach their audiences with precision and confidence.
Here’s a look at the Experian audiences that were the most popular in Q2 2023. Which ones will you add to your Q2 campaign planning?
Our top 10 audiences for Q2
Fitness enthusiast
Lifestyle and Interests (Affinity) > Health & Fitness > Fitness Enthusiast
In-store high spender on baby products
Retail Shoppers: Purchase Based > Shopping Behavior > Baby Products: In Store High Spenders
Has a bachelor’s degree
Demographics > Education > Bachelor Degree
In-market for an SUV and CUV
Autos, Cars and Trucks > In Market-Body Styles > SUV and CUV
In-market for a mid-size truck
Autos, Cars and Trucks > In Market-Body Styles > Mid-Size Truck
Homeowner
Demographics > Homeowners/Renters > Homeowner
In-market for a small, mid-size SUV
Autos, Cars and Trucks > In Market-Body Styles > Small Mid-Size SUV
In-market for a full-size truck
Autos, Cars and Trucks > In Market-Body Styles > Full-Size Trucks
In-market for a full-size SUV
Autos, Cars and Trucks > In Market-Body Styles > Full-Size SUVs
Household income level
Demographics > Household Income (HHI) > $75,000+
Our top 5 audiences by vertical
Which audience segments were the most popular by advertiser vertical?
Advanced TV
Household income level
Demographics > Household Income (HHI) > $75,000-$99,999
Interested in dogs
Lifestyle and Interests (Affinity) > Pets > Dogs (FLA / Fair Lending Friendly)1
Homeowner
Demographics > Homeowner/Renter > Homeowner
Household income level
Demographics > Household Income (HHI) > $100,000-$124,999
Interested in arts and entertainment
Lifestyle and Interests (Affinity) > Art and Entertainment > Visual Art and Design (FLA / Fair Lending Friendly)
Agency
Dog owner
Lifestyle And Interests (Affinity) > Pets > Dog Owners
Cat owner
Lifestyle And Interests (Affinity) > Pets > Cat Owners
Active investor
Lifestyle And Interests (Affinity) > Investors > Active Investor
Mutual fund investor
Lifestyle And Interests (Affinity) > Investors > Mutual Fund Investor
In-market for a full-size SUV
Autos, Cars and Trucks > In Market-Body Styles > Full-Size SUVs
Auto
In-market for a new car
Autos, Cars and Trucks > In Market-New/Used > New Car
In-market for a used car
Autos, Cars and Trucks > In Market-New/Used > Buyer Used
In-market for a Honda
Autos, Cars And Trucks > In Market-Make And Models > Honda
In-market for an auto loan
Financial FLA Friendly > In Market Auto Loan
In-market for an auto lease
Financial FLA Friendly > In Market Auto Lease
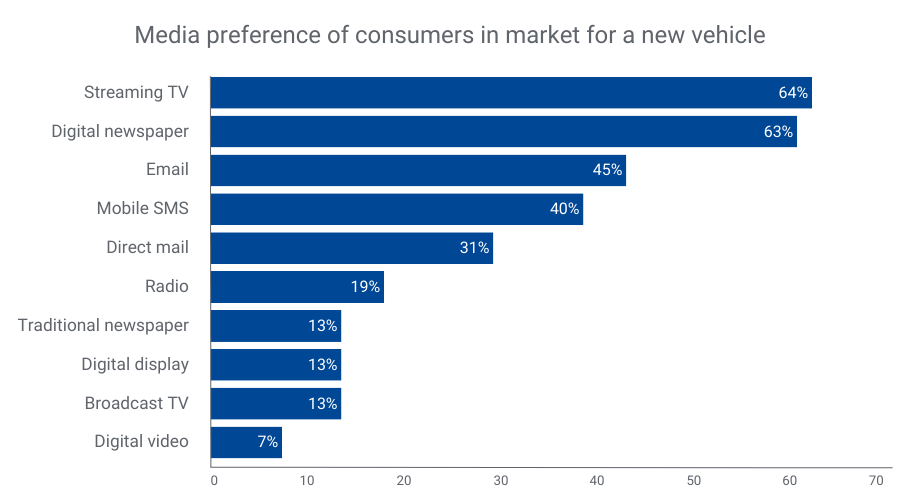
Did you know?
Consumers looking to buy a new vehicle prefer streaming TV, digital newspapers, and email for communication2. By merging our TrueTouchTM engagement channel audiences with our Auto in-market audiences, you can effectively target these consumers through their preferred channels. TrueTouch facilitates personalized advertising campaigns by predicting consumer preferences, ensuring messaging styles align with the right channels and calls to action.
By understanding what types of media people prefer, you can match the best way to talk to them with what to offer, using the right channels for personalized ads. No consumer is the same – and you need to engage with them on their terms to successfully market to them.
Financial
Active in the military
Lifestyle And Interests (Affinity) > Occupation > Military – Active
In-market for a credit union loan
Financial FLA Friendly > In Market Credit Union Loan
40-49 years old
Demographics > Ages > 40-49
30-39 years old
Demographics > Ages > 30-39
Small business owner
Consumer Behaviors > Occupation: Small Business Owners
Health
25-29 years old
Demographics > Ages > 25-29
30-34 years old
Demographics > Ages > 30-34
Weight conscious
Lifestyle and Interests (Affinity) > Health & Fitness > Weight Conscious
Moms interested in fitness
Lifestyle and Interests (Affinity) > Moms, Parents, Families > Fitness Mothers
High spenders at vitamin/supplement stores
Retail Shoppers: Purchase Based > Health and Fitness > Vitamins/Supplements: Vitamins/Supplements
Retail & CPG
Dog owners
Lifestyle And Interests (Affinity) > Pets > Dog Owners
Cat owners
Lifestyle And Interests (Affinity) > Pets > Cat Owners
Fitness enthusiast
Lifestyle and Interests (Affinity) > Health & Fitness > Fitness Enthusiast
Interested in healthy living
Lifestyle and Interests (Affinity) > Health & Fitness > Healthy Living
High spenders at vitamin/supplement stores
Retail Shoppers: Purchase Based > Health and Fitness > Vitamins/Supplements: Vitamins/Supplements
Activate the right audiences with Experian
When you choose Experian’s syndicated audiences, you gain access to over 2,400 audiences that span across 15 verticals and categories. These audiences are directly available for activation on over 30 platforms and can be sent to over 200 media platforms. Experian is ranked #1 for data accuracy (as validated by Truthset) and Experian Marketing Data is the foundation for successful targeting, enrichment, and activation.
For a full list of Experian’s syndicated audiences and activation destinations, download our syndicated audiences guide. Need a custom audience? We can help you build and activate an Experian audience on the platform of your choice.
Check out other seasonal audiences you can activate today.
Footnotes
- Fair Lending Act Friendly audiences: “Fair Lending Friendly” indicates data fields that Experian has made available without use of certain demographic attributes that may increase the likelihood of discriminatory practices prohibited by the Fair Housing Act (“FHA”) and Equal Credit Opportunity Act (“ECOA”). These excluded attributes include, but may not be limited to, race, color, religion, national origin, sex, marital status, age, disability, handicap, family status, ancestry, sexual orientation, unfavorable military discharge, and gender. Experian’s provision of Fair Lending Friendly indicators does not constitute legal advice or otherwise assure your compliance with the FHA, ECOA, or any other applicable laws. Clients should seek legal advice with respect to your use of data in connection with lending decisions or application and compliance with applicable laws.
- Experian looked at our Auto and TrueTouch audience data to understand media preference trends over the past year.
Latest posts

As we ring in the New Year this week, Americans will be tossing back a few adult beverages in celebration. While alcohol consumption certainly increases around holidays and other times of celebration, many Americans imbibe year-round. So where across this great land of ours are you most likely to find adults willing and able to raise a glass (or two) and where are you most likely to be surrounded by teetotalers? Experian Simmons has the answer. Leveraging data from our SimmonsLOCAL study, we examined the drinking patterns of adults of legal drinking age in the 106 Designated Market Areas (DMAs) with populations of at least 500,000 adults age 21 and older. We then ranked those markets by the number of alcoholic beverages consumed by the average adult during a typical month. The chart below lists the DMAs that consume the most alcoholic beverages per capita in a typical month. First place goes to Boston, where the average adult of legal drinking age regularly kicks back 14.4 drinks a month. (Celebrations in Beantown are probably already underway.) Rank DMA Average drinks per month 1 Boston 14.4 2 Austin 13.8 3 Providence-New Bedford 13.4 4 Madison 13.2 4 Hartford & New Haven 13.2 6 Philadelphia 13.1 7 Chicago 13 8 Denver 12.9 9 Tallahassee-Thomasville 12.8 9 Milwaukee 12.8 11 Minneapolis-St. Paul 12.6 11 West Palm Beach-Ft. Pierce 12.6 11 Seattle-Tacoma 12.6 11 Tucson (Sierra Vista) 12.6 15 Green Bay-Appleton 12.5 16 San Diego 12.4 16 Baltimore 12.4 16 Washington, DC 12.4 16 Albany-Schenectady-Troy 12.4 20 New Orleans 12.3 20 St. Louis 12.3 20 Colorado Springs-Pueblo 12.3 23 Burlington-Plattsburgh 12.2 23 Syracuse 12.2 23 Norfolk-Portsmouth-Newport News 12.2 23 Spokane 12.2 23 Portland-Auburn 12.2 Source: Experian Simmons Adult residents of the markets listed below surely know how to have a good time-it's just unlikely to include a cocktail. The chart below lists the DMAs that consume the fewest alcoholic beverages per capita in a typical month. Residents of Chattanooga consume only 6 alcoholic beverages per month, on average, making it the least imbibing market-and probably the one that feels the best the morning after a big gathering. Rank DMA Average drinks per month 106 Chattanooga 6 105 Salt Lake City 7.2 105 Florence-Myrtle Beach 7.2 105 Charleston-Huntington 7.2 105 Tri-Cities, TN-VA 7.2 101 Knoxville 7.4 100 Lexington 7.9 99 Birmingham 8 98 Huntsville-Decatur 8.5 97 Nashville 8.9 97 Evansville 8.9 95 Paducah-Cape Girardeau-Harrisburg-Mt Vernon 9.1 94 Springfield, MO 9.2 94 Tulsa 9.2 94 Greenville-New Bern-Washington 9.2 91 Memphis 9.3 90 Greenville-Spartanburg-Asheville-Anderson 9.4 90 Jackson, MS 9.4 90 Wichita-Hutchinson Plus 9.4 86 Little Rock-Pine Bluff 9.5 86 Louisville 9.5 86 Ft. Smith-Fayetteville-Springdale-Rogers 9.5 83 Fresno-Visalia 9.6 82 Greensboro-High Point-Winston Salem 9.7 82 Roanoke-Lynchburg 9.7 Source: Experian Simmons For more information on SimmonsLOCAL's vivid reporting of consumer behaviors, attitudes, lifestyles and media consumption in 209 Designated Market Areas down to the ZIP code level, visit our website.
Registered Republicans and Democrats have different TV program preferences. But a majority of highly rated Nielsen programs seem to clearly skew Republican. Which TV programs does each group prefer, and what are the common threads among the two groups?
Discount stores appear to be weathering the recession better than some of their full-price counterparts, as they carry first-quality designer merchandise at competitive prices.