
At Experian, we understand the critical role that audience targeting plays in the success of marketing campaigns. That’s why we’re excited to share this curated list, aimed at helping agencies and media buyers plan their campaigns and effectively reach their audiences with precision and confidence.
Here’s a look at the Experian audiences that were the most popular in Q2 2023. Which ones will you add to your Q2 campaign planning?
Our top 10 audiences for Q2
Fitness enthusiast
Lifestyle and Interests (Affinity) > Health & Fitness > Fitness Enthusiast
In-store high spender on baby products
Retail Shoppers: Purchase Based > Shopping Behavior > Baby Products: In Store High Spenders
Has a bachelor’s degree
Demographics > Education > Bachelor Degree
In-market for an SUV and CUV
Autos, Cars and Trucks > In Market-Body Styles > SUV and CUV
In-market for a mid-size truck
Autos, Cars and Trucks > In Market-Body Styles > Mid-Size Truck
Homeowner
Demographics > Homeowners/Renters > Homeowner
In-market for a small, mid-size SUV
Autos, Cars and Trucks > In Market-Body Styles > Small Mid-Size SUV
In-market for a full-size truck
Autos, Cars and Trucks > In Market-Body Styles > Full-Size Trucks
In-market for a full-size SUV
Autos, Cars and Trucks > In Market-Body Styles > Full-Size SUVs
Household income level
Demographics > Household Income (HHI) > $75,000+
Our top 5 audiences by vertical
Which audience segments were the most popular by advertiser vertical?
Advanced TV
Household income level
Demographics > Household Income (HHI) > $75,000-$99,999
Interested in dogs
Lifestyle and Interests (Affinity) > Pets > Dogs (FLA / Fair Lending Friendly)1
Homeowner
Demographics > Homeowner/Renter > Homeowner
Household income level
Demographics > Household Income (HHI) > $100,000-$124,999
Interested in arts and entertainment
Lifestyle and Interests (Affinity) > Art and Entertainment > Visual Art and Design (FLA / Fair Lending Friendly)
Agency
Dog owner
Lifestyle And Interests (Affinity) > Pets > Dog Owners
Cat owner
Lifestyle And Interests (Affinity) > Pets > Cat Owners
Active investor
Lifestyle And Interests (Affinity) > Investors > Active Investor
Mutual fund investor
Lifestyle And Interests (Affinity) > Investors > Mutual Fund Investor
In-market for a full-size SUV
Autos, Cars and Trucks > In Market-Body Styles > Full-Size SUVs
Auto
In-market for a new car
Autos, Cars and Trucks > In Market-New/Used > New Car
In-market for a used car
Autos, Cars and Trucks > In Market-New/Used > Buyer Used
In-market for a Honda
Autos, Cars And Trucks > In Market-Make And Models > Honda
In-market for an auto loan
Financial FLA Friendly > In Market Auto Loan
In-market for an auto lease
Financial FLA Friendly > In Market Auto Lease
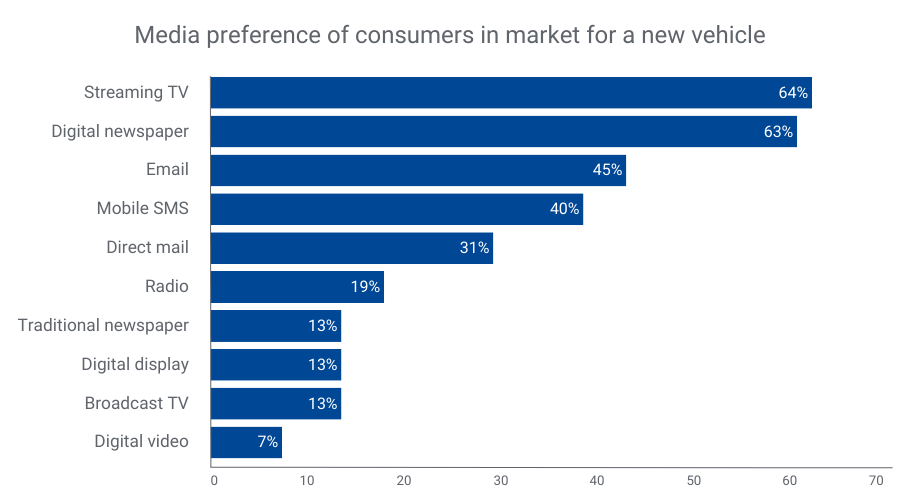
Did you know?
Consumers looking to buy a new vehicle prefer streaming TV, digital newspapers, and email for communication2. By merging our TrueTouchTM engagement channel audiences with our Auto in-market audiences, you can effectively target these consumers through their preferred channels. TrueTouch facilitates personalized advertising campaigns by predicting consumer preferences, ensuring messaging styles align with the right channels and calls to action.
By understanding what types of media people prefer, you can match the best way to talk to them with what to offer, using the right channels for personalized ads. No consumer is the same – and you need to engage with them on their terms to successfully market to them.
Financial
Active in the military
Lifestyle And Interests (Affinity) > Occupation > Military – Active
In-market for a credit union loan
Financial FLA Friendly > In Market Credit Union Loan
40-49 years old
Demographics > Ages > 40-49
30-39 years old
Demographics > Ages > 30-39
Small business owner
Consumer Behaviors > Occupation: Small Business Owners
Health
25-29 years old
Demographics > Ages > 25-29
30-34 years old
Demographics > Ages > 30-34
Weight conscious
Lifestyle and Interests (Affinity) > Health & Fitness > Weight Conscious
Moms interested in fitness
Lifestyle and Interests (Affinity) > Moms, Parents, Families > Fitness Mothers
High spenders at vitamin/supplement stores
Retail Shoppers: Purchase Based > Health and Fitness > Vitamins/Supplements: Vitamins/Supplements
Retail & CPG
Dog owners
Lifestyle And Interests (Affinity) > Pets > Dog Owners
Cat owners
Lifestyle And Interests (Affinity) > Pets > Cat Owners
Fitness enthusiast
Lifestyle and Interests (Affinity) > Health & Fitness > Fitness Enthusiast
Interested in healthy living
Lifestyle and Interests (Affinity) > Health & Fitness > Healthy Living
High spenders at vitamin/supplement stores
Retail Shoppers: Purchase Based > Health and Fitness > Vitamins/Supplements: Vitamins/Supplements
Activate the right audiences with Experian
When you choose Experian’s syndicated audiences, you gain access to over 2,400 audiences that span across 15 verticals and categories. These audiences are directly available for activation on over 30 platforms and can be sent to over 200 media platforms. Experian is ranked #1 for data accuracy (as validated by Truthset) and Experian Marketing Data is the foundation for successful targeting, enrichment, and activation.
For a full list of Experian’s syndicated audiences and activation destinations, download our syndicated audiences guide. Need a custom audience? We can help you build and activate an Experian audience on the platform of your choice.
Check out other seasonal audiences you can activate today.
Footnotes
- Fair Lending Act Friendly audiences: “Fair Lending Friendly” indicates data fields that Experian has made available without use of certain demographic attributes that may increase the likelihood of discriminatory practices prohibited by the Fair Housing Act (“FHA”) and Equal Credit Opportunity Act (“ECOA”). These excluded attributes include, but may not be limited to, race, color, religion, national origin, sex, marital status, age, disability, handicap, family status, ancestry, sexual orientation, unfavorable military discharge, and gender. Experian’s provision of Fair Lending Friendly indicators does not constitute legal advice or otherwise assure your compliance with the FHA, ECOA, or any other applicable laws. Clients should seek legal advice with respect to your use of data in connection with lending decisions or application and compliance with applicable laws.
- Experian looked at our Auto and TrueTouch audience data to understand media preference trends over the past year.
Latest posts

Same-sex marriage is a hot button topic no matter on which side of the issue you stand. But there can be no denying that same-sex couples are finding an expanding number of options in the U.S. and abroad should they decide to legally wed. The 2010 LGBT Consumer Report explores the household arrangements and behaviors of America's LGBT consumers—in particular, those associated with marriage—compared to America's heterosexual population. You will learn that despite being less than half as likely to be married, lesbian, gay and bisexual adults are 22% more likely than their "straight" counterparts to have recently wed or to be planning nuptials for the next year. Looking for that perfect gift for the newly wed couple? You will also get some shopping tips for identifying favored retailers of lesbian, gay and bisexual shoppers. We'll start by sizing the LGBT market. An estimated 3.7% of the non-Hispanic adult population (7.1 million adults) self-identifies as LGBT, which can be broken down as follows: The average heterosexual adult lives in a household with 1.9 other individuals, including adults and kids. By comparison, the average lesbian shares her home with only 1.6 other people. Gay men live in the smallest households, sharing their home with only one other person, on average. Over a third of gay or bisexual men (38%) share their home with at least one other adult male, compared with only 24% of heterosexual men who live under the same roof as another adult male. Thirty-five percent of gay or bisexual men say they live with one (and only one) other adult male, a living arrangement that has a higher chance of consisting of a same-sex, co-habiting couple. Over half of lesbians or bisexual women (53%) share their home with at least one other adult female, compared with only 23% of heterosexual women who live under the same roof as another adult female. Forty-three percent of lesbian or bisexual women say they live with one (and only one) other adult female, a living arrangement that has a higher chance of consisting of a same-sex, co-habiting couple. Lesbian, Gay and Bisexual adults (LGB) as a group are less than half as likely as heterosexuals to be married. Only 26% of LGB adults are wed, compared with 57% of “straight” adults. Of all LGB adults, bisexuals are the most likely group to be married, with over 4 in 10 reporting they are presently wed. Lesbians are more than four and a half times more likely than gay men to be married, with 23% of lesbians having tied the knot versus only 5% of gay men. Lesbian, gay and bisexual adults as a group are 22% more likely than heterosexual adults to have either tied the knot in the last 12 months or have plans to wed in the coming year. 5.7% of lesbian, gay or bisexual adults are newly weds or “soonly” weds vs. 4.6% of heterosexual adults. Lesbian, gay and bisexual adults are twice as likely to shop at Neiman Marcus, making the department store the number one retailer with a wedding registry program among LGB shoppers. With many retailers ending their registry programs in favor of gift cards, we looked at how stores without registry programs stack up among lesbian, gay and bisexual shoppers. LGB adults are almost twice as likely to shop at J. Crew, making the store the number one retailer without a wedding registry program among LGB shoppers.
With the 82nd Academy Awards® just around the corner and only days before final voting ballots are due back to accounting firm PricewaterhouseCoopers, Experian Simmons is taking a close look at the American movie-going population. In any given month, over 56 million adults (26% of the adult population) make a trip to the cinema to take in a film. Movie-going typically reaches its peak in mid-summer, and 2009 was no exception. Experian Simmons DataStreamSM reports that in July of last year, 32% of adults went to movies, the highest level observed at any point in the year. In October of the same year, the percentage of past-month adult cinema-goers had dropped to just 19%, the lowest point observed in all of 2009. In this month’s Consumer Insights report, Experian Simmons sizes the movie-going audience, examines their receptivity to cinema ads—including pre-show commercials and product placement within films—online movie searches as well as Americans’ penchant for tuning into the Academy Awards. All data comes from the Simmons Summer 2009 National Consumer Study. Two-thirds of the adult population have gone to the movies at least once in the last 6 months. Nearly half (46%) have been in the last 90 days and a quarter (26%) have been in the last month. Young adults are, as expected, more likely to go to the movies than older adults, but adults over 50 outnumber young adults when it comes to raw number of movie-goers as you will see in the following chart. Over 147 million individuals have gone to the movies at least once in the last 6 months. With 20.8 million adults ages 18 to 24 going to the movies in the last 6 months, this age group accounts for only 14% of the movie-going population. Adults ages 50 and over, on the other hand, account for 37% of the movie-going population with over 55 million adults in this age group going to the theater at least once in the last 6 months. Among all adults who had been to the movies at least once in the last 6 months, 68% have been at least once in the last 30 days. Many movie-goers (39%) have been only once in the last month and only 7% have been four or more times. Young adults ages 18 to 24 are much more likely than the average movie-goer to have been to the theater in the last month with 75% reporting having been at least once and 10% having been 4 times or more. Experian Simmons DataStreamSM reports similar trends in past 30 day movie-going for 2008 and 2009 with the peak for this behavior occurring in both years on almost the exact same date. During the week of July 22, 2009 32% of adults reported having been to the theater during the last 30 days and during the week of July 21, 2008, 29% reported going. Cinema Blockbusters that month in ’09 included Bruno and Harry Potter and the Half-Blood Prince. In July of ’08, Mama Mia and The Dark Knight were released. When it comes to product placement in movies, frequent cinema-goers are most likely to respond. In fact, 41% of adults who went to the movies 4 or more times in the last 90 days are classified by the Simmons Movie Product Placement segmentation system as “Emulators,” those consumers who notice, remember and are driven to buy products placed into the context of a film. By comparison, only 28% of consumers who went to a movie only once in the last 90 days are Emulators. Forty-eight percent of Horror film fans say they often pay attention to commercials that show along with movie previews in movie theaters making them the most receptive to cinema advertisements followed by Romantic Comedy fans and Family movie fans. Only 39% of Foreign Language or Independent film fans say they pay attention to such ads. Nearly a quarter of all movie-goers get movie information, reviews or show times online in any given month. Aside from the obvious movie sites, you are likely to find movie information seekers on these sites: Californians like foreign language and independent films, whereas New Englanders have more of a penchant for Comedies and Southerners are among the most likely to see Horror films. Below are the top 5 metro areas for finding adults who say they usually see the three selected movie genres when they go to the theater. One-in-seven American adults tuned into the last Academy Awards® ceremony on ABC, including many non-movie-goers. Nine percent of adults who had not been to the movies even once in the past six months tuned into the last awards show and ultimately comprised 19% of all 2009 Oscar® viewers. Still, the more frequently a consumer goes to the movies, the more likely he or she is to watch the annual Academy Awards® ceremony.