At Experian, we understand the critical role that audience targeting plays in the success of marketing campaigns. That’s why we’re excited to share this curated list, aimed at helping agencies and media buyers plan their campaigns and effectively reach their audiences with precision and confidence.
Here’s a look at the Experian audiences that were the most popular in Q2 2023. Which ones will you add to your Q2 campaign planning?
Our top 10 audiences for Q2
Fitness enthusiast
Lifestyle and Interests (Affinity) > Health & Fitness > Fitness Enthusiast
In-store high spender on baby products
Retail Shoppers: Purchase Based > Shopping Behavior > Baby Products: In Store High Spenders
Has a bachelor’s degree
Demographics > Education > Bachelor Degree
In-market for an SUV and CUV
Autos, Cars and Trucks > In Market-Body Styles > SUV and CUV
In-market for a mid-size truck
Autos, Cars and Trucks > In Market-Body Styles > Mid-Size Truck
Homeowner
Demographics > Homeowners/Renters > Homeowner
In-market for a small, mid-size SUV
Autos, Cars and Trucks > In Market-Body Styles > Small Mid-Size SUV
In-market for a full-size truck
Autos, Cars and Trucks > In Market-Body Styles > Full-Size Trucks
In-market for a full-size SUV
Autos, Cars and Trucks > In Market-Body Styles > Full-Size SUVs
Household income level
Demographics > Household Income (HHI) > $75,000+
Our top 5 audiences by vertical
Which audience segments were the most popular by advertiser vertical?
Advanced TV
Household income level
Demographics > Household Income (HHI) > $75,000-$99,999
Interested in dogs
Lifestyle and Interests (Affinity) > Pets > Dogs (FLA / Fair Lending Friendly)1
Homeowner
Demographics > Homeowner/Renter > Homeowner
Household income level
Demographics > Household Income (HHI) > $100,000-$124,999
Interested in arts and entertainment
Lifestyle and Interests (Affinity) > Art and Entertainment > Visual Art and Design (FLA / Fair Lending Friendly)
Agency
Dog owner
Lifestyle And Interests (Affinity) > Pets > Dog Owners
Cat owner
Lifestyle And Interests (Affinity) > Pets > Cat Owners
Active investor
Lifestyle And Interests (Affinity) > Investors > Active Investor
Mutual fund investor
Lifestyle And Interests (Affinity) > Investors > Mutual Fund Investor
In-market for a full-size SUV
Autos, Cars and Trucks > In Market-Body Styles > Full-Size SUVs
Auto
In-market for a new car
Autos, Cars and Trucks > In Market-New/Used > New Car
In-market for a used car
Autos, Cars and Trucks > In Market-New/Used > Buyer Used
In-market for a Honda
Autos, Cars And Trucks > In Market-Make And Models > Honda
In-market for an auto loan
Financial FLA Friendly > In Market Auto Loan
In-market for an auto lease
Financial FLA Friendly > In Market Auto Lease
Did you know?
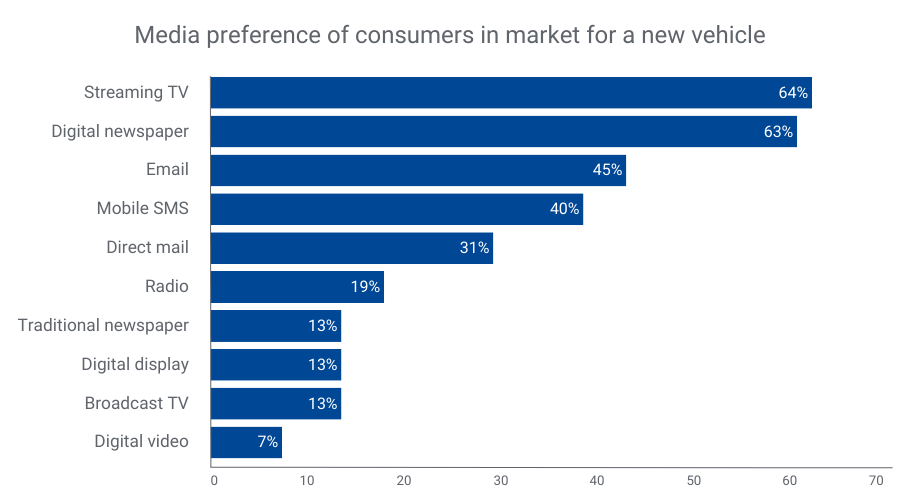
Consumers looking to buy a new vehicle prefer streaming TV, digital newspapers, and email for communication2. By merging our TrueTouchTM engagement channel audiences with our Auto in-market audiences, you can effectively target these consumers through their preferred channels. TrueTouch facilitates personalized advertising campaigns by predicting consumer preferences, ensuring messaging styles align with the right channels and calls to action.
By understanding what types of media people prefer, you can match the best way to talk to them with what to offer, using the right channels for personalized ads. No consumer is the same – and you need to engage with them on their terms to successfully market to them.
Financial
Active in the military
Lifestyle And Interests (Affinity) > Occupation > Military – Active
In-market for a credit union loan
Financial FLA Friendly > In Market Credit Union Loan
40-49 years old
Demographics > Ages > 40-49
30-39 years old
Demographics > Ages > 30-39
Small business owner
Consumer Behaviors > Occupation: Small Business Owners
Health
25-29 years old
Demographics > Ages > 25-29
30-34 years old
Demographics > Ages > 30-34
Weight conscious
Lifestyle and Interests (Affinity) > Health & Fitness > Weight Conscious
Moms interested in fitness
Lifestyle and Interests (Affinity) > Moms, Parents, Families > Fitness Mothers
High spenders at vitamin/supplement stores
Retail Shoppers: Purchase Based > Health and Fitness > Vitamins/Supplements: Vitamins/Supplements
Retail & CPG
Dog owners
Lifestyle And Interests (Affinity) > Pets > Dog Owners
Cat owners
Lifestyle And Interests (Affinity) > Pets > Cat Owners
Fitness enthusiast
Lifestyle and Interests (Affinity) > Health & Fitness > Fitness Enthusiast
Interested in healthy living
Lifestyle and Interests (Affinity) > Health & Fitness > Healthy Living
High spenders at vitamin/supplement stores
Retail Shoppers: Purchase Based > Health and Fitness > Vitamins/Supplements: Vitamins/Supplements
Activate the right audiences with Experian
When you choose Experian’s syndicated audiences, you gain access to over 2,400 audiences that span across 15 verticals and categories. These audiences are directly available for activation on over 30 platforms and can be sent to over 200 media platforms. Experian is ranked #1 for data accuracy (as validated by Truthset) and Experian Marketing Data is the foundation for successful targeting, enrichment, and activation.
For a full list of Experian’s syndicated audiences and activation destinations, download our syndicated audiences guide. Need a custom audience? We can help you build and activate an Experian audience on the platform of your choice.
Check out other seasonal audiences you can activate today.
Footnotes
- Fair Lending Act Friendly audiences: “Fair Lending Friendly” indicates data fields that Experian has made available without use of certain demographic attributes that may increase the likelihood of discriminatory practices prohibited by the Fair Housing Act (“FHA”) and Equal Credit Opportunity Act (“ECOA”). These excluded attributes include, but may not be limited to, race, color, religion, national origin, sex, marital status, age, disability, handicap, family status, ancestry, sexual orientation, unfavorable military discharge, and gender. Experian’s provision of Fair Lending Friendly indicators does not constitute legal advice or otherwise assure your compliance with the FHA, ECOA, or any other applicable laws. Clients should seek legal advice with respect to your use of data in connection with lending decisions or application and compliance with applicable laws.
- Experian looked at our Auto and TrueTouch audience data to understand media preference trends over the past year.
Latest posts

The Simmons Multi-Media Engagement Study is a unique syndicated research program that measures – across multiple dimensions – the relationship between media vehicles and their audiences. This strategic tool provides measures of the cognitive and emotional engagement consumers have with major media properties, which includes broadcast, cable, and syndicated television, major magazines, and Internet sites. The Fall 2009 release of the Simmons Multi-Media Engagement Study utilizes a patented behavioral integration model to map the engagement levels of nearly 800 media vehicle users back to the respondents in the Experian Simmons National Consumer Study, allowing the analysis of media engagement to be filtered by consumer behaviors including users of over 8,000 brands in over 460 product categories. The following slides will demonstrate some powerful examples leveraging the Spring 2009 MME study. Among all U.S. adults, Consumer Reports magazine is the most Trustworthy media vehicle. In fact, 6 of the top 10 Trustworthy media vehicles are print magazines. The other top vehicles include 3 websites and 1 cable television network. When broken down by gender, there are 4 vehicles that remain consistent across the gender breaks, although their rank orders do change. Among media properties that index at 110 or higher for new car intenders*, we can determine which are best for communicating a message of trust. Below are the top vehicles ranked by the percent of new car intenders saying “I trust this to tell the truth.” When ranking print magazines by Ad Attention/Receptivity – the dimension that measures how likely consumers are to notice and pay attention to ads as well as buy advertised products – we find that the top of the list is dominated by niche publications, whose audiences are focused and whose ads are typically targeted. In a similar vein, those magazines that focus on a mass-market audience tend to have the lowest Ad Attention/Receptivity scores. Looking at the statement, “I get valuable information from the ads in this magazine,” we can see some interesting differences between consumers by region. For instance, while American Baby is tops in 3 of the 4 census regions, it is fourth in the Midwest. Smart Money magazine makes the list only in the Northeast and House Beautiful only in the West. Likewise, Family Handyman appears in both the Midwest and South, but not in the Northeast or West. Among print magazines that index at 110 or higher for readers planning to retire in the next year, we can determine which magazines would be ideal for placing ads promoting plans and hobbies for their future free time. The following magazines rank top for future retirees who say “This magazine has ads for things I care about.” The Personal Time Out dimension helps identify vehicles that people like to relax with and to spend their free time using. While there are similarities across users of all ages, these top websites for each age group show that younger users prefer social media and entertainment-oriented sites, while more mature users lean towards lifestyle sites when they just want to kick back. Of the Facebook.com users who say, “I like to kick back and wind down with Facebook.com,” we can look at what retailers they are most likely to shop compared to other online adults. Facebook.com users who like to kick back and wind down on the site are 172% more likely to shop at Express and 130% more likely to shop at Victoria’s Secret or Banana Republic. Should these retailers advertise on Facebook, they could benefit by including messages of escape and time-out. When it comes to word of mouth, synergy is a powerful tool. While 69% of all viewers of The Oprah Winfrey Show say, “This program gives me something to talk about,” this number increases to 81% among those viewers who either read O, The Oprah Magazine or visit Oprah.com. Incredibly, when looking at Oprah viewers who visit her website and also read her magazine, fully 96% say The Oprah Winfrey Show gives them something to talk about, an increase of 39% over all program viewers.
African Americans represent 11% of the U.S. adult population and, as a group, constitute the nation’s largest racial minority market. African Americans are also more optimistic about their financial situation than the general population, and with good reason. According to the Selig Center for Economic Growth, African American buying power reached $913 billion in 2008, up from $590 billion in 2000. By 2013, African American buying power will reach an astonishing $1.2 trillion, meaning that almost nine cents out of every dollar spent in the United States will come from African American consumers. In celebration of Black History Month, Experian Simmons examines the attitudes, behaviors and media consumption of our country’s African American consumers using data from Simmons DataStreamSM, the Simmons National Consumer Study, New Media Study, Multi-Media Engagement Study and Experian MicromarketerG3 as well as findings from our friends at Experian Hitwise. When it comes to attitudes towards personal financial outlook, African Americans are more likely than the average American adult to say that in the next 12 months they will be better off financially. As of December 28th, 2009, 36% of African Americans said they would be better off financially in the next 12 months, compared with 31% of all adults who felt the same. African Americans are trend setters. Below are the top indexing statements on apparel, auto, food and social interaction among African American adults compared to the total adult population. Index relative to total adult population in parentheses. House Beautiful magazine is a great publication for reaching African Americans who respond to print ads. Readers of House Beautiful, for instance, are 37% more likely to be African American and House Beautiful scores 83% higher than the average magazine among African American readers who say they are likely to buy product or services advertised in the magazine. Where in the United States is the best place to find African American consumers with household incomes of $100,000 or more? Hinesville-Fort Stewart, Georgia is tops followed by Fresno and Stockton, California. African American consumers are more likely than the average online adult to use a wide range of emerging technologies and media. For instance, online African American consumers are 20% more likely than average to watch movies online, 19% more likely to listen to Internet radio and 18% more likely to use social tags or bookmarks. Below are the top sites ranked by the percentage of visits coming from the top African American Mosaic lifestyle segments. The list is dominated by social networking sites.
Coffee drinkers in America Coffee plays such an integral part of every day life in America that it may be safe to say that coffee helps the United States go round. In fact, fully 60% of all U.S. households use either whole or ground coffee beans at home. Experian Simmons extensively reviewed the American coffee drinker for this report which features detailed insights into the coffee-drinking American. In addition, we compare the patrons of Dunkin’ Donuts and Starbucks, the leading players in the battle for brew. Coffee in the Home The average U.S. household that uses whole or ground coffee consumes 4.2 cups per day. In total that’s about 280.5 million cups of coffee consumed at home by Americans each day or about 102 billion cups per year. Among households that use coffee, 89% stock regular coffee and 46% stock decaf.* Among households that use coffee, 84% use pre-ground coffee and 26% use whole bean coffee at least some of the time.* Instant Flavored Coffee Over a quarter of households (27%) stock instant coffee. Sixteen percent of households use instant flavored coffee. The most commonly used flavors among instant flavored coffee drinkers are: Older Americans More Likely to Drink Coffee Fifty-seven percent of adults ages 18-24 live in households that use coffee, but 25 to 34 year olds are the least likely to stock coffee in their cupboards with only 54% reporting they use whole or ground bean coffee at home. Coffee Use Increases with Household Income Seventy percent of Americans who report annual household incomes of $150,000+ drink coffee compared with 54% of those with household income less than $25,000. Dunkin' Donuts Vs. Starbucks Dunkin' Donuts 11% of American adults go to DD Between 9.15.08 and 9.15.09 the share of DD customers who go there 6+ times a month is up 11%* DD consumers are 41% more likely than the average adult to be registered Independents and 9% less likely to be registered Republicans Starbucks 13% of American adults go to Starbucks Between 9.15.08 and 9.15.09 the share of Starbucks customers who go there 6+ times a month is down 22% Starbucks consumers are 11% more likely to be registered Independents and 11% more likely to be registered Republicans Coffee Drinkers Are Coffee Drinkers A majority of coffee-drinking Americans are loyal to their franchise. However, there are a considerable number of Dunkin’ Donuts and Starbucks consumers who jump between coffee houses. How Often Americans Order Their Coffee The majority of both Dunkin’ Donuts and Starbucks customers visit each chain between one and five times in a typical month. Learn more about Simmons consumer research and studies.