At Experian, we understand the critical role that audience targeting plays in the success of marketing campaigns. That’s why we’re excited to share this curated list, aimed at helping agencies and media buyers plan their campaigns and effectively reach their audiences with precision and confidence.
Here’s a look at the Experian audiences that were the most popular in Q2 2023. Which ones will you add to your Q2 campaign planning?
Our top 10 audiences for Q2
Fitness enthusiast
Lifestyle and Interests (Affinity) > Health & Fitness > Fitness Enthusiast
In-store high spender on baby products
Retail Shoppers: Purchase Based > Shopping Behavior > Baby Products: In Store High Spenders
Has a bachelor’s degree
Demographics > Education > Bachelor Degree
In-market for an SUV and CUV
Autos, Cars and Trucks > In Market-Body Styles > SUV and CUV
In-market for a mid-size truck
Autos, Cars and Trucks > In Market-Body Styles > Mid-Size Truck
Homeowner
Demographics > Homeowners/Renters > Homeowner
In-market for a small, mid-size SUV
Autos, Cars and Trucks > In Market-Body Styles > Small Mid-Size SUV
In-market for a full-size truck
Autos, Cars and Trucks > In Market-Body Styles > Full-Size Trucks
In-market for a full-size SUV
Autos, Cars and Trucks > In Market-Body Styles > Full-Size SUVs
Household income level
Demographics > Household Income (HHI) > $75,000+
Our top 5 audiences by vertical
Which audience segments were the most popular by advertiser vertical?
Advanced TV
Household income level
Demographics > Household Income (HHI) > $75,000-$99,999
Interested in dogs
Lifestyle and Interests (Affinity) > Pets > Dogs (FLA / Fair Lending Friendly)1
Homeowner
Demographics > Homeowner/Renter > Homeowner
Household income level
Demographics > Household Income (HHI) > $100,000-$124,999
Interested in arts and entertainment
Lifestyle and Interests (Affinity) > Art and Entertainment > Visual Art and Design (FLA / Fair Lending Friendly)
Agency
Dog owner
Lifestyle And Interests (Affinity) > Pets > Dog Owners
Cat owner
Lifestyle And Interests (Affinity) > Pets > Cat Owners
Active investor
Lifestyle And Interests (Affinity) > Investors > Active Investor
Mutual fund investor
Lifestyle And Interests (Affinity) > Investors > Mutual Fund Investor
In-market for a full-size SUV
Autos, Cars and Trucks > In Market-Body Styles > Full-Size SUVs
Auto
In-market for a new car
Autos, Cars and Trucks > In Market-New/Used > New Car
In-market for a used car
Autos, Cars and Trucks > In Market-New/Used > Buyer Used
In-market for a Honda
Autos, Cars And Trucks > In Market-Make And Models > Honda
In-market for an auto loan
Financial FLA Friendly > In Market Auto Loan
In-market for an auto lease
Financial FLA Friendly > In Market Auto Lease
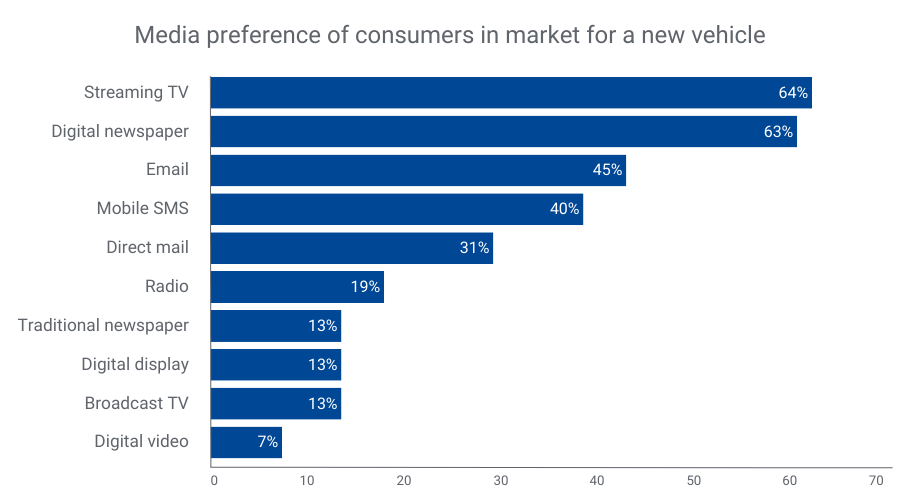
Did you know?
Consumers looking to buy a new vehicle prefer streaming TV, digital newspapers, and email for communication2. By merging our TrueTouchTM engagement channel audiences with our Auto in-market audiences, you can effectively target these consumers through their preferred channels. TrueTouch facilitates personalized advertising campaigns by predicting consumer preferences, ensuring messaging styles align with the right channels and calls to action.
By understanding what types of media people prefer, you can match the best way to talk to them with what to offer, using the right channels for personalized ads. No consumer is the same – and you need to engage with them on their terms to successfully market to them.
Financial
Active in the military
Lifestyle And Interests (Affinity) > Occupation > Military – Active
In-market for a credit union loan
Financial FLA Friendly > In Market Credit Union Loan
40-49 years old
Demographics > Ages > 40-49
30-39 years old
Demographics > Ages > 30-39
Small business owner
Consumer Behaviors > Occupation: Small Business Owners
Health
25-29 years old
Demographics > Ages > 25-29
30-34 years old
Demographics > Ages > 30-34
Weight conscious
Lifestyle and Interests (Affinity) > Health & Fitness > Weight Conscious
Moms interested in fitness
Lifestyle and Interests (Affinity) > Moms, Parents, Families > Fitness Mothers
High spenders at vitamin/supplement stores
Retail Shoppers: Purchase Based > Health and Fitness > Vitamins/Supplements: Vitamins/Supplements
Retail & CPG
Dog owners
Lifestyle And Interests (Affinity) > Pets > Dog Owners
Cat owners
Lifestyle And Interests (Affinity) > Pets > Cat Owners
Fitness enthusiast
Lifestyle and Interests (Affinity) > Health & Fitness > Fitness Enthusiast
Interested in healthy living
Lifestyle and Interests (Affinity) > Health & Fitness > Healthy Living
High spenders at vitamin/supplement stores
Retail Shoppers: Purchase Based > Health and Fitness > Vitamins/Supplements: Vitamins/Supplements
Activate the right audiences with Experian
When you choose Experian’s syndicated audiences, you gain access to over 2,400 audiences that span across 15 verticals and categories. These audiences are directly available for activation on over 30 platforms and can be sent to over 200 media platforms. Experian is ranked #1 for data accuracy (as validated by Truthset) and Experian Marketing Data is the foundation for successful targeting, enrichment, and activation.
For a full list of Experian’s syndicated audiences and activation destinations, download our syndicated audiences guide. Need a custom audience? We can help you build and activate an Experian audience on the platform of your choice.
Check out other seasonal audiences you can activate today.
Footnotes
- Fair Lending Act Friendly audiences: “Fair Lending Friendly” indicates data fields that Experian has made available without use of certain demographic attributes that may increase the likelihood of discriminatory practices prohibited by the Fair Housing Act (“FHA”) and Equal Credit Opportunity Act (“ECOA”). These excluded attributes include, but may not be limited to, race, color, religion, national origin, sex, marital status, age, disability, handicap, family status, ancestry, sexual orientation, unfavorable military discharge, and gender. Experian’s provision of Fair Lending Friendly indicators does not constitute legal advice or otherwise assure your compliance with the FHA, ECOA, or any other applicable laws. Clients should seek legal advice with respect to your use of data in connection with lending decisions or application and compliance with applicable laws.
- Experian looked at our Auto and TrueTouch audience data to understand media preference trends over the past year.
Latest posts

Healthcare marketers: Open enrollment starts November 1st. Are you ready? It’s that time of year again—time to promote your insurance plans to existing and potential members ahead of open enrollment. But do you know your members beyond the basics? Sure, you know their name, address, phone number and email address, but do you know what communication channels they prefer? Do you know their lifestyle, behaviors and interests? In order for member communications to be effective, they need to be data-driven—first and foremost. The problem is, the industry is fragmented—and so is its data. With individuals covered by both private and public insurance plans—many payers don’t have access to a complete and accurate view of members and their respective data. And as the industry continues to move toward digital transformation and embraces automation, organizations that aren’t leveraging data insights are in danger of missing out on the opportunity to create a more solid connection with members. Partnering with a third-party data provider like Experian to enrich your first-party data is the answer. With a reliable source of data, health plans can more easily identify members, deduplicate their profiles, and leverage accurate contact information and communicate on a personal, relevant, empathetic level. Here are 5 ways to attract new members and retain existing members: 1. Create more accurate personas for marketing needs: Whether we use your data or combine yours with ours, you can gain stronger member analysis for segmentation and modeling that can help you maintain current relationships or expand your outreach to acquire new members—and ensure the loyalty of both categories. 2. Ensure the accuracy of member data: With Experian’s identity and data solutions, you can rest assured that your member database is accurate and up to date to maximize contact rates and minimize errors. 3. Build strong communication channels with your members: Optimize your advertising efforts through preferred channels—and identify those communication channels—to effectively connect with your customers using our data identifying their lifestyle, interests, behaviors and more. 4. Understand more about your members’ needs and behaviors: We’ll help you keep your members healthy. What do your members do, need, prefer? How much can they afford for healthcare? How do they live? You could guess, or you can let unbiased data guide your decisions so you can better assist your members in their health care goals. 5. Create a better member experience: With data and insights, Experian can give you the information you need to enable a consistent member experience, allowing you to match your products in a way that complements your member’s needs and lifestyle. Experian cuts through the data overload by focusing on data that matters and drives actionable decisions. With Experian on your side, you’ll be able to leverage the largest consumer database. We’re here to help you to manage a wide range of marketing needs, including measuring your campaign impact and determining the best messages to use to connect with your audience. We can also assist with securely managing your data in a way that helps to ensure the accuracy of that data to give you the most up-to-date picture of your current member database. Ready to learn more about our healthcare marketing solutions for open enrollment? Complete our online form and an Experian Marketing Services representative will reach out to you soon.

With the long-term effects to the economy unknown, many consumers are feeling the financial impact, while others are looking for opportunities, resulting in a transformational shift in spending. Some brands are experiencing decreased or paused marketing budgets, and you may be trepidatious about making the right decisions in your efforts to grow share of wallet. Recent events have been an impetus for change and we’re seeing brands make modifications to traditional marketing strategies. Some are developing innovative technologies and utilizing new sources of data and analytics. As we look at how these changes impact marketing results, we see the gap grow between those brands who are equipped to pivot and implement new strategies quickly, versus those who are not. So what steps can your organization implement now to make the smartest choices for both your customers and your business to secure more share of wallet? Here are four ideas to accelerate the success of your next financial marketing campaign: 1. Meet your customers wherever they are: Digital-first strategies have never been more relevant than they are right now. While consumers have fully embraced online engagement, marketers are even more focused on reaching high-value segments in the channels they utilize. By using an informed, data-driven strategy that includes preferred marketing communication channels and decision-making styles, engagement increases across those channels your target audience frequents the most. For example, are they heavy social media users? Do they prefer streaming TV? Or do they tend to rely on financial advice vs. performing their own research? To drive take rates, your audience must be exposed to a tailored message, in the right channel, and possibly multiple times. 2. Use messaging that resonates: As consumers refocus priorities, their expectations of brands with whom they do business are ever-increasing. Reflecting an understanding of the current needs and interests of your customers and prospects is an undertone that can only help strengthen their view of your brand. Consumer behavior has changed and is unlikely to revert to what was, so you want to be relevant, but you also do not want to be seen as ‘tone deaf’. As a result, consider revising your segmentation strategy to leverage predictive insights, such as household economic indicators, financial behaviors, lifestyle propensities and interests to help shape your message into one that truly makes an impact. 3. Prove the worth of your campaign: New consumer journeys are being formulated and showing ROI is imperative as your marketing budget is scrutinized. Having the right industry-relevant metrics and reports to analyze and share with leadership are key. Demonstrate that your campaigns are contributing to bottom-line success—and justify future campaigns—by using data-driven measurement insights collected across multiple reads and countless touchpoints. Marketing budgets are being scrutinized now more than ever, so showing ROI is critical. Having the right metrics and reports to analyze and share with leadership are key. 4. Follow government regulations—leverage Fair Lending-friendly audiences: Whether you’re cross-selling or prospecting, now is the time to identify the right audiences with rich data insights to not only execute impactful campaigns but adhere to government regulations that protect consumers and your organization. Trusting that the data you are activating follows Fair Lending Laws, including the Equal Credit Opportunity Act (“ECOA”) and the Fair Housing Act (“FHA”) is crucial. The Federal ECOA prohibits creditors from discriminating against credit applicants on the basis of several prohibited factors. Developing people-based segments that are not derived using these factors positions you to follow these regulations. Check out our previous blog post about Fair Lending-friendly audiences here. As you transition to new operating models, access to current and accurate consumer data can provide confidence in campaign potential, help you avoid business risk, enable you to respond to market changes and make better decisions. Experian can help you implement these strategies and put your brand unique position for growth. From start to finish, we provide the marketing solutions you need to plan, build and execute successful, Fair Lending-friendly campaigns to cross-sell to existing customers and acquire new customers. Learn more about Experian’s financial services marketing solutions here. *Experian Fair Lending-friendly audiences do not constitute legal advice or otherwise assure compliance with the FHA, ECOA, or any other applicable laws. It’s recommended to seek legal advice with respect to the use of data in connection with lending decisions or application and compliance with applicable laws.

There’s no question that COVID-19 has changed the shopping landscape forever. While the initial onset of quarantines and lockdowns negatively impacted brick and mortar retailers, online shopping soared to levels higher than 2019’s Black Friday/Cyber Monday extravaganza, accounting for $153 billion in spending over April and May1. Many consumers will continue to shop online for the foreseeable future for various reasons, which means marketers must have a greater focus on providing a positive online customer experience. Despite MSN Money’s claim that COVID may have made holiday shopping extinct2—in part because retailers such as Walmart, Target, Best Buy and more are keeping their doors closed on Thanksgiving—it turns out that’s not the case. According to polls taken by Chain Store Age, the pandemic hasn’t impacted consumers’ holiday spending plans, but it has affected how they intend to shop. This sentiment is echoed by Radial, who shared that 60% of consumers plan to shop less in-store this season. Even so, Salesforce noted that respondents to their poll found that consumers value safety and health above all else in their in-store shopping experiences, with 60% stating that social distancing measures were important to them3. So how can you navigate this new shopping normal and make the most of the 2020 holiday season? 1. Leverage data to strengthen communicationsData has always been an important component to a successful marketing plan, but it’s even more important now that shoppers are scattered across multiple devices and shifting their preference from offline to online—or a hybrid of the two. Connecting consumer identities across devices and channels means you can reach customers more effectively, promoting events, items and experiences that are most relevant to them on the channels they frequent most. You can also leverage mobile location data to understand consumer traffic patterns, including understanding which competitors they may visit. Not only will this help you to anticipate their behaviors, but you’ll learn more about their habits and preferences, which in turn helps you to craft messaging that speaks directly to their needs—and encourages their loyalty. 2. Be transparent in your messagingBrick and mortar holiday shopping isn’t totally out of the question this year, it’s just going to look a little different. If you’re still offering customers an offline experience, be open and honest with them about what they can expect. Use your outreach to share information about how you’re protecting employees, sanitizing the store, and making for a safer in-store experience so your customers feel comfortable walking through your doors. (The NRF has excellent resources to help you navigate this as required by state guidelines.)Also, let them know if there are any changes to shopping policies, such as wearing masks, contactless payment, the number of people allowed in the store at one time, return windows and more. The more transparent you can be in your messaging, the more comfortable customers will feel in keeping you in mind for their holiday shopping plans. And if your online business is booming, make sure you communicate any changes in fulfillment or shipping due to safety measures or delivery delays. This will be important messaging to those who may not be traveling to see family this year and are shopping online to have gifts shipped to their loved ones. 3. Offer positive new experiences and perksWhether you’re online or offline or both, customers will feel encouraged to shop when you offer them a little something extra to help make their shopping experience more enjoyable. Curbside pick-up has become an important aspect of this new normal in retail, so make sure you share with your customer whether that option is available to them. If “try before you buy” isn’t available like it may have been in the past, see what you can do to offer a similar experience—for example, many fashion retailers are offering virtual styling services that allow customers to connect with an expert for further insight on fits and cuts that may work for them (or the friends and family they’re shopping for). Some home furnishing retailers provide the ability to “visualize” an accessory or piece of furniture in your home.Free gift-wrapping services are always appreciated, as are in-store experiences for shoppers with kids (but they must be socially distant, of course). Be creative and use data to help inform your decisions so you can create perks and experiences that will really connect with your customer. Even with new challenges, retailers have the opportunity to offer a positive shopping experience through the holiday season and beyond, whether online or offline. And given the stressors of the season, it’s likely consumers will be shopping for themselves as much as they’re shopping for friends and family. As Business Insider put it, “…retailers will need to be more targeted and creative in their approach to Black Friday to get customers to spend,” and having the right data will be key. Download our new Holiday Marketing eBook for trends, tips and tricks to help you plan and execute powerful holiday marketing campaigns. 1https://theblog.adobe.com/online-shopping-during-covid-19-exceeds-2019-holiday-season-levels/ 2https://www.msn.com/en-us/money/companies/covid-19-may-have-made-thanksgiving-day-holiday-shopping-extinct/ar-BB17fmtm 3https://www.zdnet.com/article/covid-19-has-permanently-changed-shopping-behavior/